Free tool · Lean
Value Stream Map
Draw the flow of one product or service from the supplier to the customer: every step with its cycle time, changeover, uptime and yield, and the pieces waiting between the steps. The tool turns the piles into time, draws the map with its lead-time ladder, shows how little of the lead time is work, names the step above takt, and lets you draw the future state with a kaizen burst for each change.
3 · Process steps
In the order of the flow. CT is the work time of one piece; with more operators the step releases a piece every CT ÷ operators. Between the steps, count the pieces waiting: the tool turns them into time through the demand.
No steps yet. Choose a template, add a step, or .
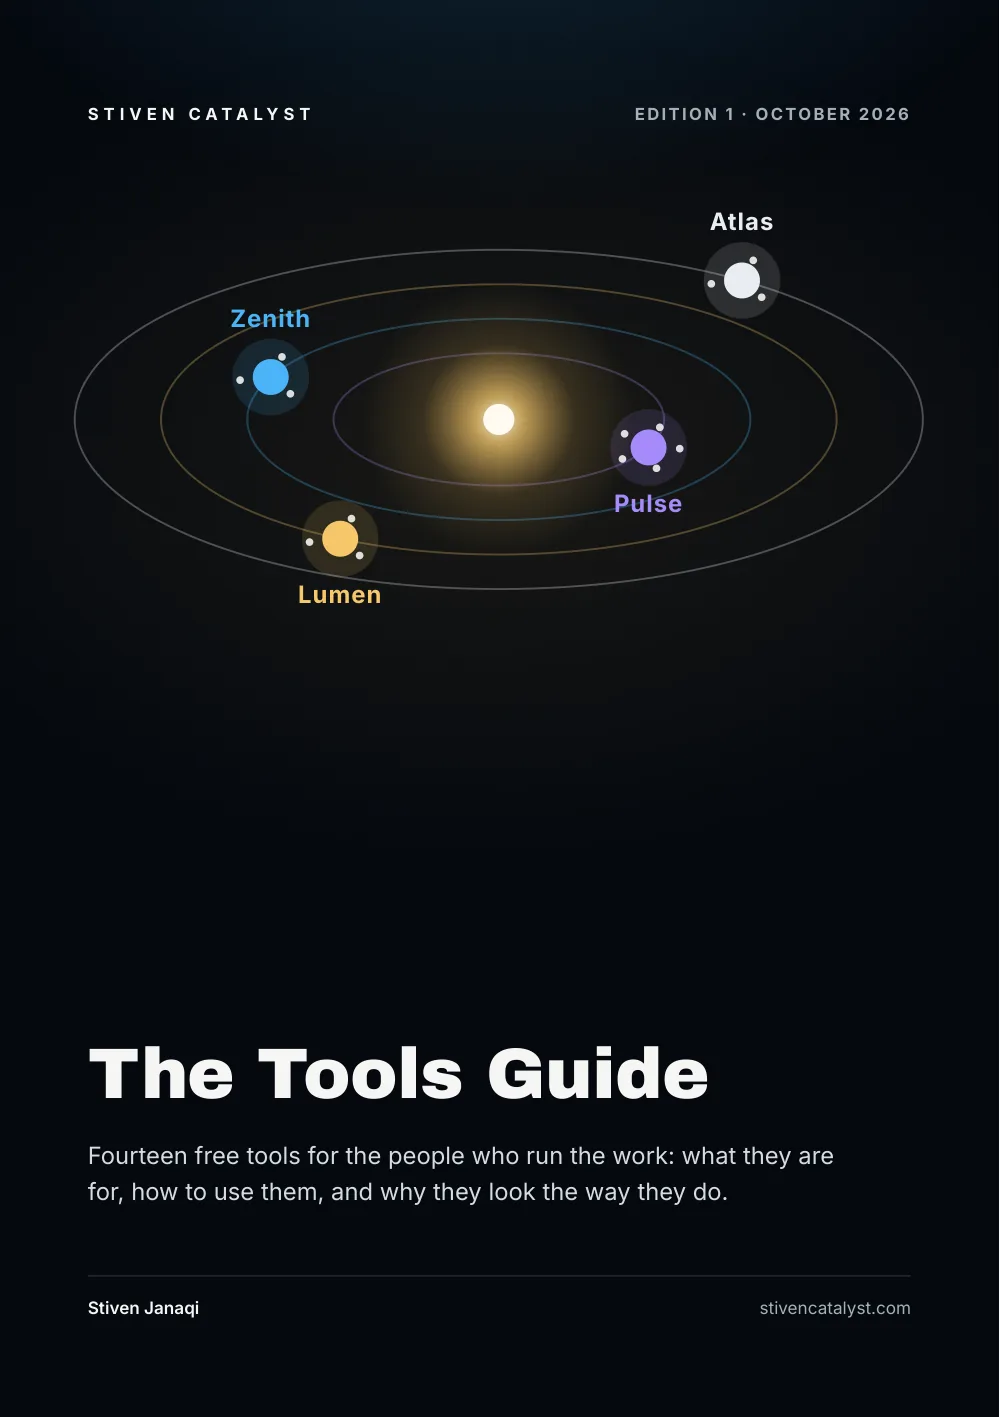
The guide · Edition 3 · Page 41
How t o use this t ool, in the guide
Why each tool exists, which family it belongs to and how to use it step by step, in one book you can leaf through.
Feedback
Did this t ool help you?
Your work
All your work in one file
Every tool keeps your work only in this browser. Save it as one file to keep a copy, to carry on from another phone or computer, or to hand it to a colleague. Nothing is uploaded.
Works offline too: once a tool has been opened on this device, it and the other tools of its role open without a connection.
- Six Sigma · 5 minSigma & Control Cha
r tTurn defects into a sigma level, combine on time, undamaged and complete into perfect delivery, and see whether a bad day is a signal or noise.→ - Worksheet · 10 min5 WhysMove from a symptom to a root cause you can change, then agree one countermeasure, one owner and one check. Print it or save it as PDF.→
- Root causes · 15 minFishbonePut the effect at the head and collect causes with the team on the 6M, 4P or hotel bones, each with its why. Votes and likely causes rank them, the likely ones become actions to verify, and the top one goes to 5 Whys or the causes to Pareto.→
- Risk · 30 minFMEAWrite down how each process step can fail, rate severity, occurrence and detection, and get the RPN and the AIAG-VDA action priority. A heat map, the top ten risks and the actions with owners until the re-rating shows the risk is gone.→
- Six Sigma · 10 minProcess LabPaste measurements and get the right control chart (I-MR, Xbar-R/S, np, c, u) with Nelson rules and before/after phases, Cpk, chi-square, regression and a Gage R&R or attribute agreement study. Every number in plain words.→
- Lean · 20 minTime StudyTime each element over five cycles with a stopwatch, space bar as the lap key. Get the standard time per station, takt from demand, a Yamazumi against it and the first element to move.→
- Standard · 20 minStandard WorkOne job as a TWI breakdown: major steps, key points marked Safety, Quality, Technique or Cost, and a reason for each, with the time per step against the takt. Versions with change notes, print on A4, Word.→
- Lean · 15 minSpagh
e t ti DiagramDraw the walking paths of one job over the floor plan, tap by tap, in metres. Get the metres and minutes walked per shift, the stop visited most and the longest repeated leg, then compare the layout after the change.→ - Six Sigma · WeeklyProject Po
r tfolioEvery DMAIC project on one page: phase, status, the next tollgate and its checklist, days in the phase, sigma before and after, and savings planned against realised. Each project keeps its charter, SIPOC, CTQ tree, RACI, Kano, RTY, COPQ and control plan.→ - Course · 45 minSix Sigma in the WarehouseDMAIC in five steps on one warehouse case, with the tool to use at each step, three questions per step, the eight wastes and a project charter.→