
About this guide
Fourteen tools, four planets, one idea
Stiven Catalyst has fourteen free tools for the people who run the work: shift leads, area managers, process managers, and anyone carrying their experience into the next role.
This guide explains how the tools are organised, why the site looks the way it does, and how to use each tool, step by step. You do not need to read it in order: find your planet and start there.
- Free. Every tool is free to use.
- No account. You open a tool and start. There is nothing to sign up for.
- On your device. Your work is kept in your browser, not on a server. No cookies, no analytics.
One exception, stated in the tool: when you type a company's website in the CV Builder, that address goes to Google's icon service to fetch the logo.
Start here
Which planet is yours?
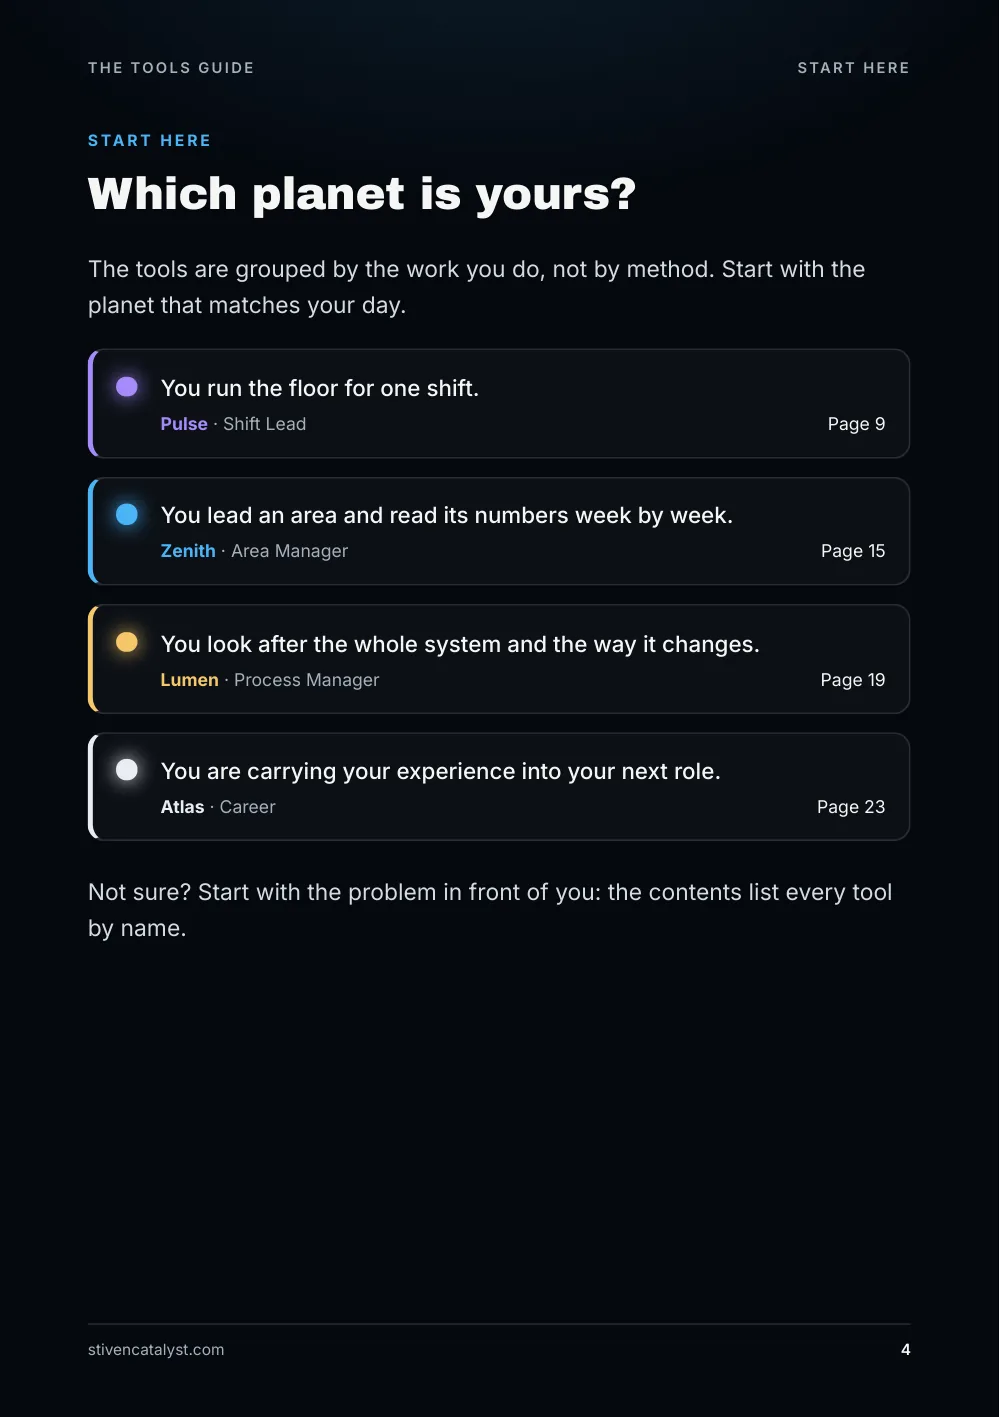
The tools are grouped by the work you do, not by method. Start with the planet that matches your day.
- You run the floor for one shift. Pulse, Shift Lead.
- You lead an area and read its numbers week by week. Zenith, Area Manager.
- You look after the whole system and the way it changes. Lumen, Process Manager.
- You are carrying your experience into your next role. Atlas, Career.
Not sure? Start with the problem in front of you: the contents list every tool by name.
The idea, 1
Why a solar system
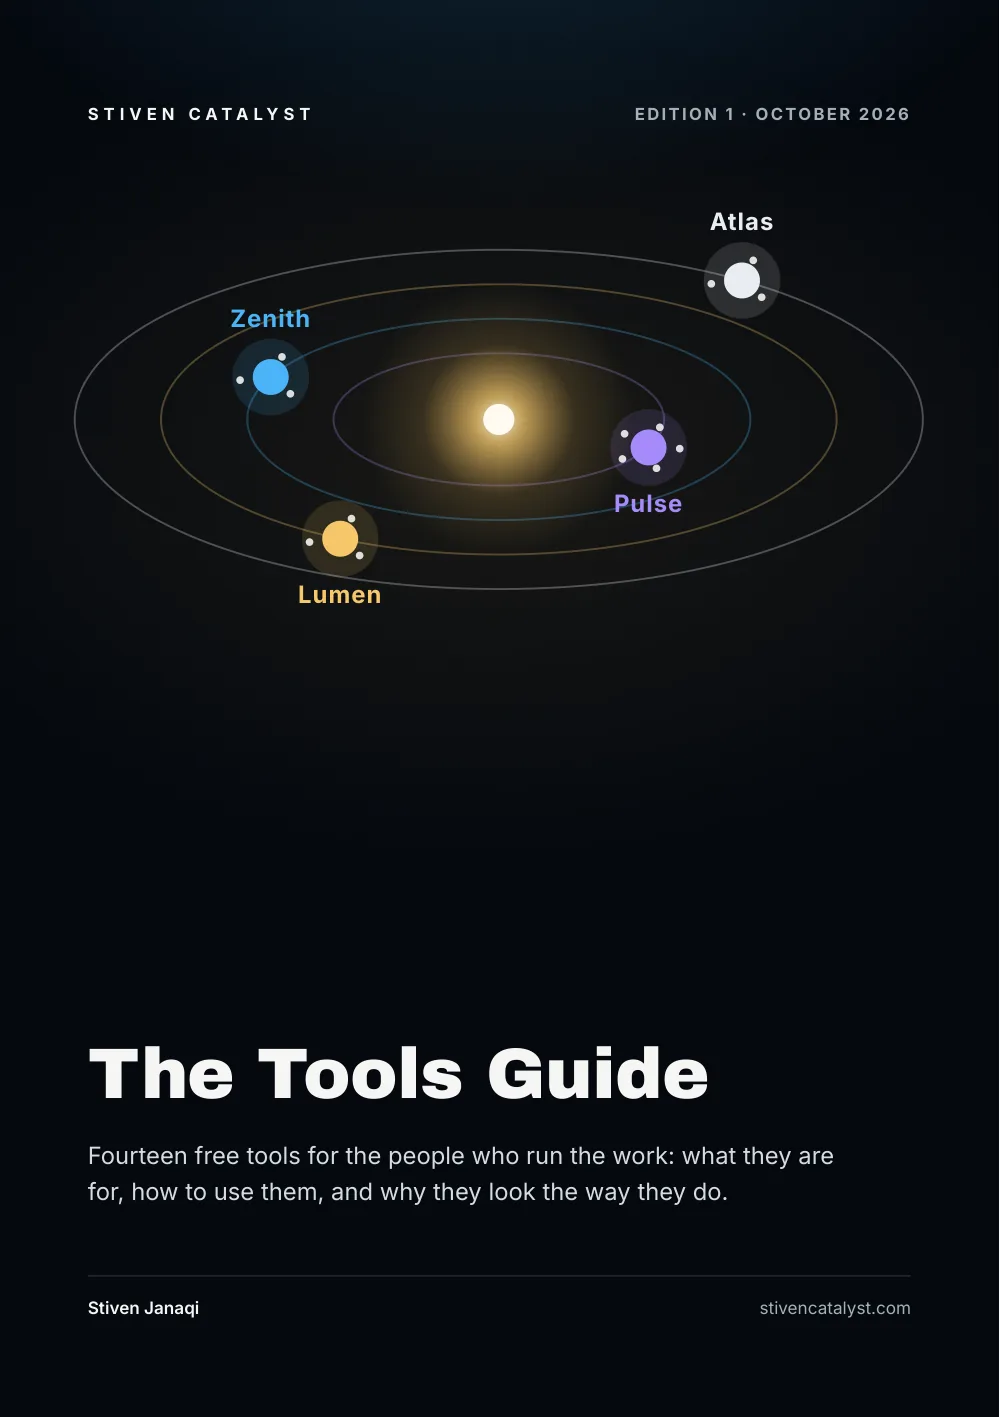
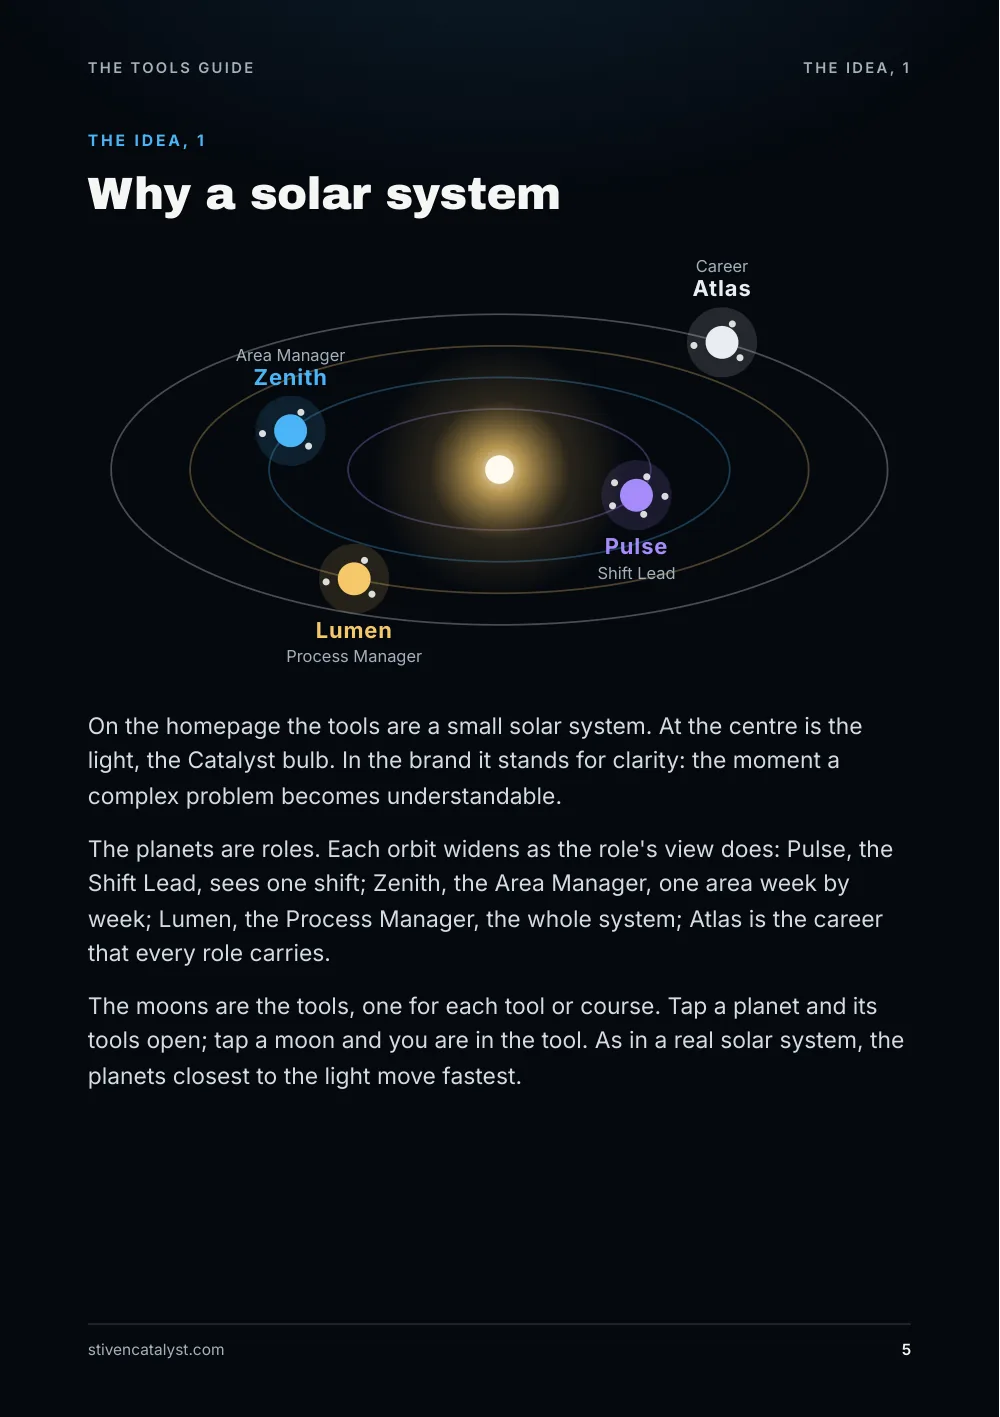
On the homepage the tools are a small solar system. At the centre is the light, the Catalyst bulb. In the brand it stands for clarity: the moment a complex problem becomes understandable.
The planets are roles. Each orbit widens as the role's view does: Pulse, the Shift Lead, sees one shift; Zenith, the Area Manager, one area week by week; Lumen, the Process Manager, the whole system; Atlas is the career that every role carries.
The moons are the tools, one for each tool or course. Tap a planet and its tools open; tap a moon and you are in the tool. As in a real solar system, the planets closest to the light move fastest.
The idea, 2
Four families, four colours
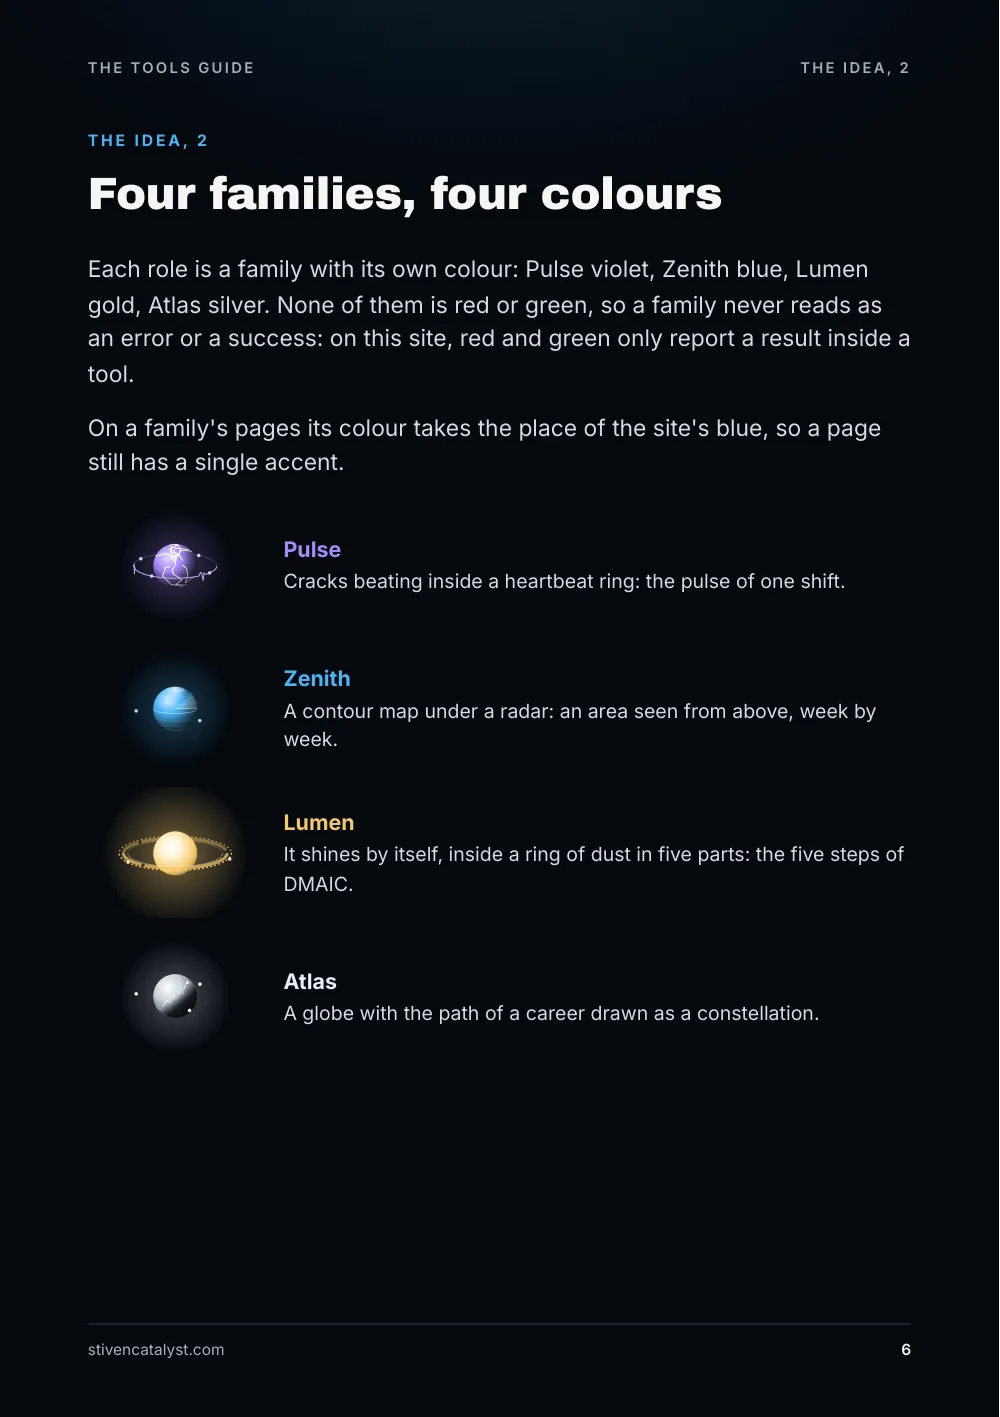
Each role is a family with its own colour: Pulse violet, Zenith blue, Lumen gold, Atlas silver. None of them is red or green, so a family never reads as an error or a success: on this site, red and green only report a result inside a tool.
On a family's pages its colour takes the place of the site's blue, so a page still has a single accent.
- Pulse: Cracks beating inside a heartbeat ring: the pulse of one shift.
- Zenith: A contour map under a radar: an area seen from above, week by week.
- Lumen: It shines by itself, inside a ring of dust in five parts: the five steps of DMAIC.
- Atlas: A globe with the path of a career drawn as a constellation.
The idea, 3
Small tools that work together
The idea behind the tools is simple: tools made from the work on the floor, that need nothing but a browser. No installation, no account, no server that keeps your data.
What makes them more than separate calculators is that they pass work to each other, inside your browser:
- The Damage, Incomplete and Delay logs feed Shift Pulse, and the Shift Handover takes their numbers with “Fill in from the logs”.
- Any log result goes on with one button: “Take it to 5 Whys”, “Open in Pareto 80/20” or “Open as control chart”.
- The CX Control Tower sends its root causes to Pareto 80/20.
- The Cover Letter takes your details from the CV Builder or the ATS CV.
And on each role page, a coaching workspace turns the tools into a practice: a project with a goal, a measurement and a review date. More on the last pages.
Before you start
Your work stays with you
Every tool keeps your work only in the browser you use. It is not sent anywhere, which also means it is not on your phone if you worked on your laptop.
To keep everything, or to move it to another device, use “Save all my work” at the end of any tool page: one file with the work of every tool. “Open a saved file” brings it back and replaces only the tools in that file.
- Most tools print or save as PDF, and the logs download as CSV for Excel.
- The log tools keep a separate log for each language of the site.
- If the browser cannot save, the tool says so: download the CSV or copy the summary to keep your work.
- Clearing the browser's data clears your work too. Save a file first.
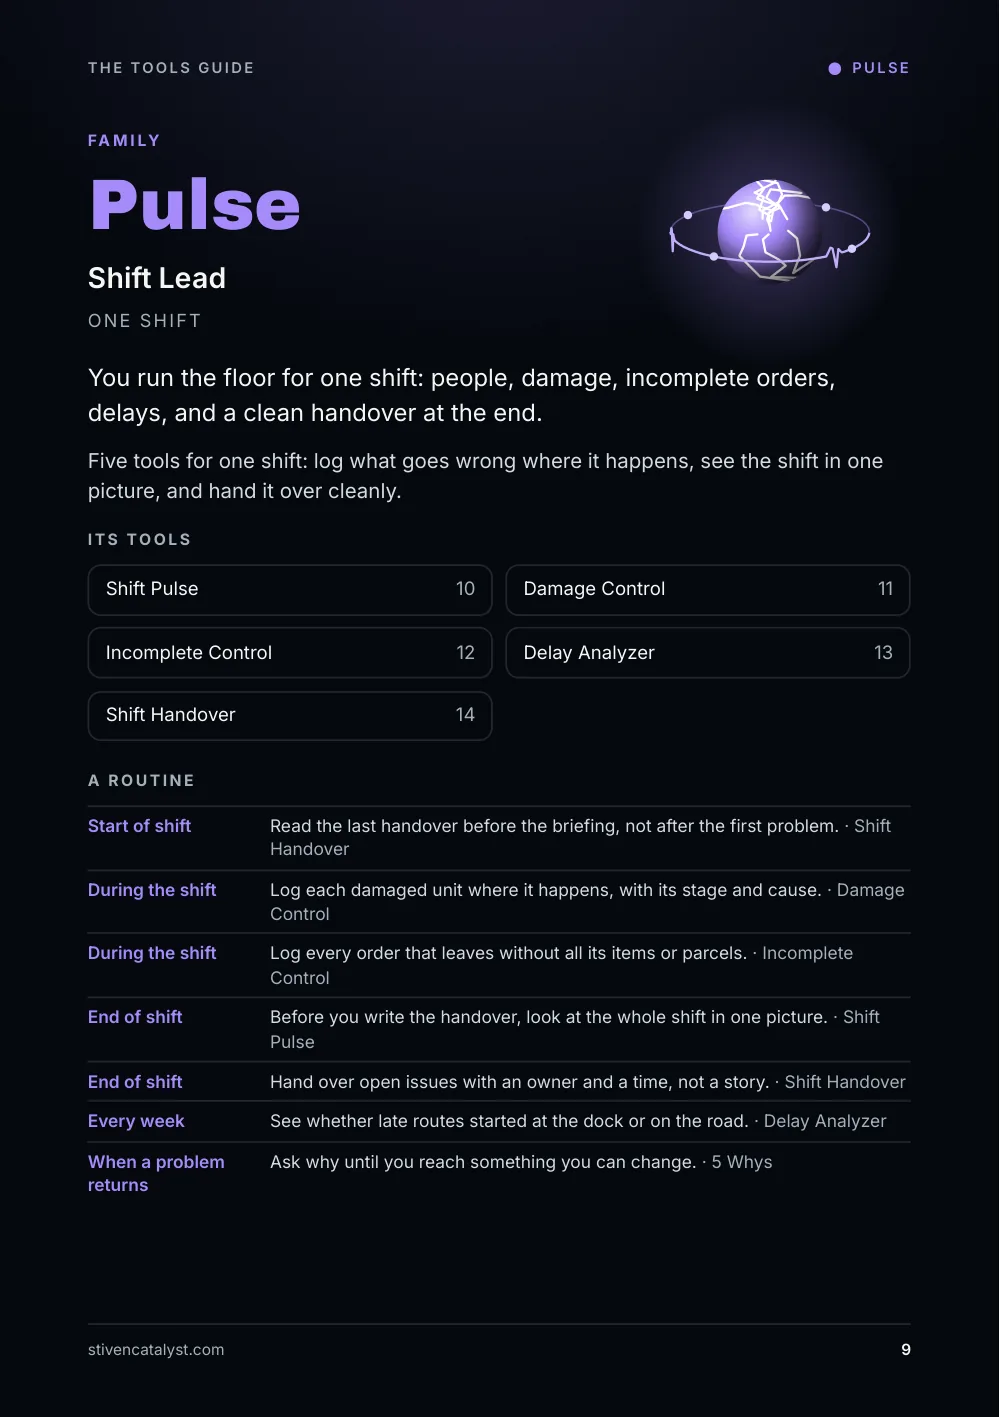
Family
Pulse · Shift Lead
One shift. You run the floor for one shift: people, damage, incomplete orders, delays, and a clean handover at the end.
Five tools for one shift: log what goes wrong where it happens, see the shift in one picture, and hand it over cleanly.
A routine
- Start of shift: Read the last handover before the briefing, not after the first problem. (Shift Handover)
- During the shift: Log each damaged unit where it happens, with its stage and cause. (Damage Control)
- During the shift: Log every order that leaves without all its items or parcels. (Incomplete Control)
- End of shift: Before you write the handover, look at the whole shift in one picture. (Shift Pulse)
- End of shift: Hand over open issues with an owner and a time, not a story. (Shift Handover)
- Every week: See whether late routes started at the dock or on the road. (Delay Analyzer)
- When a problem returns: Ask why until you reach something you can change. (5 Whys)
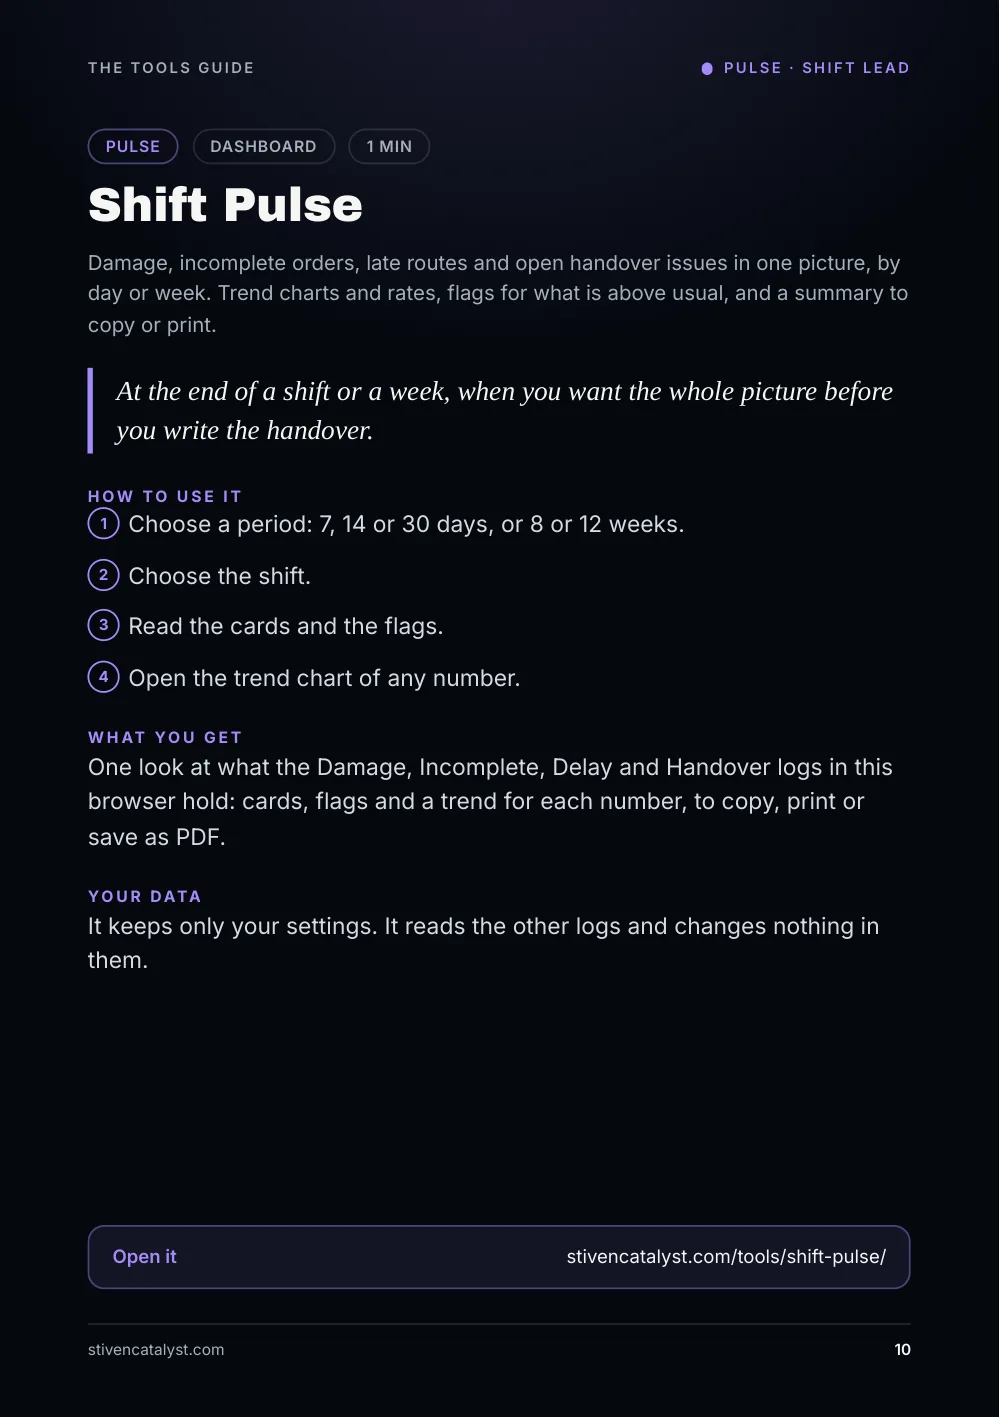
Shift Pulse
Dashboard · 1 min. Damage, incomplete orders, late routes and open handover issues in one picture, by day or week. Trend charts and rates, flags for what is above usual, and a summary to copy or print.
At the end of a shift or a week, when you want the whole picture before you write the handover.
How to use it
- Choose a period: 7, 14 or 30 days, or 8 or 12 weeks.
- Choose the shift.
- Read the cards and the flags.
- Open the trend chart of any number.
What you get: One look at what the Damage, Incomplete, Delay and Handover logs in this browser hold: cards, flags and a trend for each number, to copy, print or save as PDF.
Your data: It keeps only your settings. It reads the other logs and changes nothing in them.
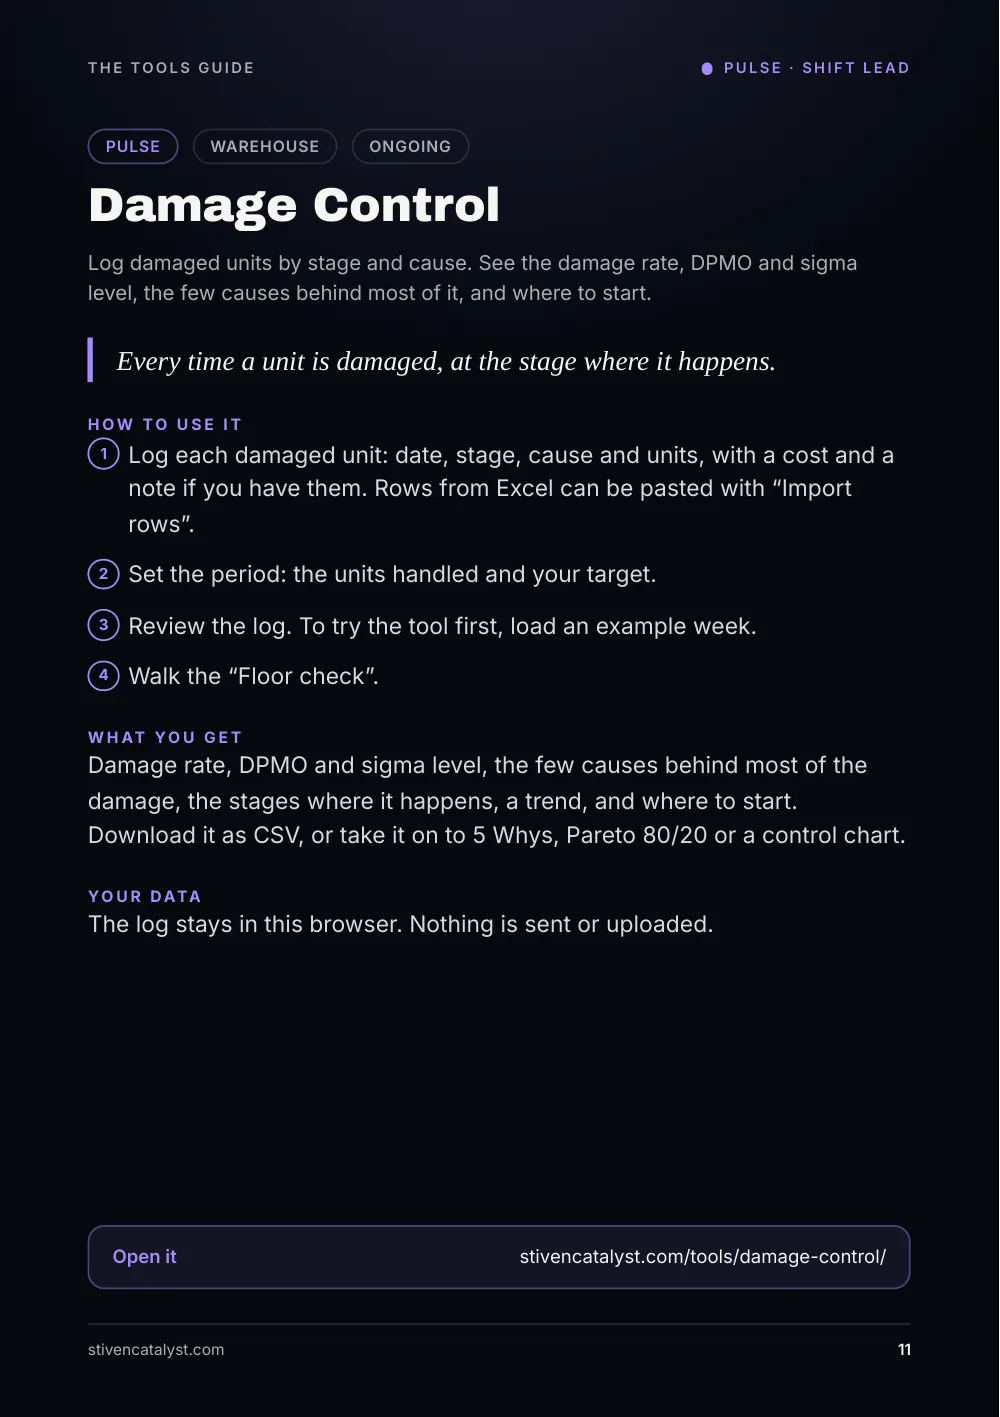
Damage Control
Warehouse · Ongoing. Log damaged units by stage and cause. See the damage rate, DPMO and sigma level, the few causes behind most of it, and where to start.
Every time a unit is damaged, at the stage where it happens.
How to use it
- Log each damaged unit: date, stage, cause and units, with a cost and a note if you have them. Rows from Excel can be pasted with “Import rows”.
- Set the period: the units handled and your target.
- Review the log. To try the tool first, load an example week.
- Walk the “Floor check”.
What you get: Damage rate, DPMO and sigma level, the few causes behind most of the damage, the stages where it happens, a trend, and where to start. Download it as CSV, or take it on to 5 Whys, Pareto 80/20 or a control chart.
Your data: The log stays in this browser. Nothing is sent or uploaded.
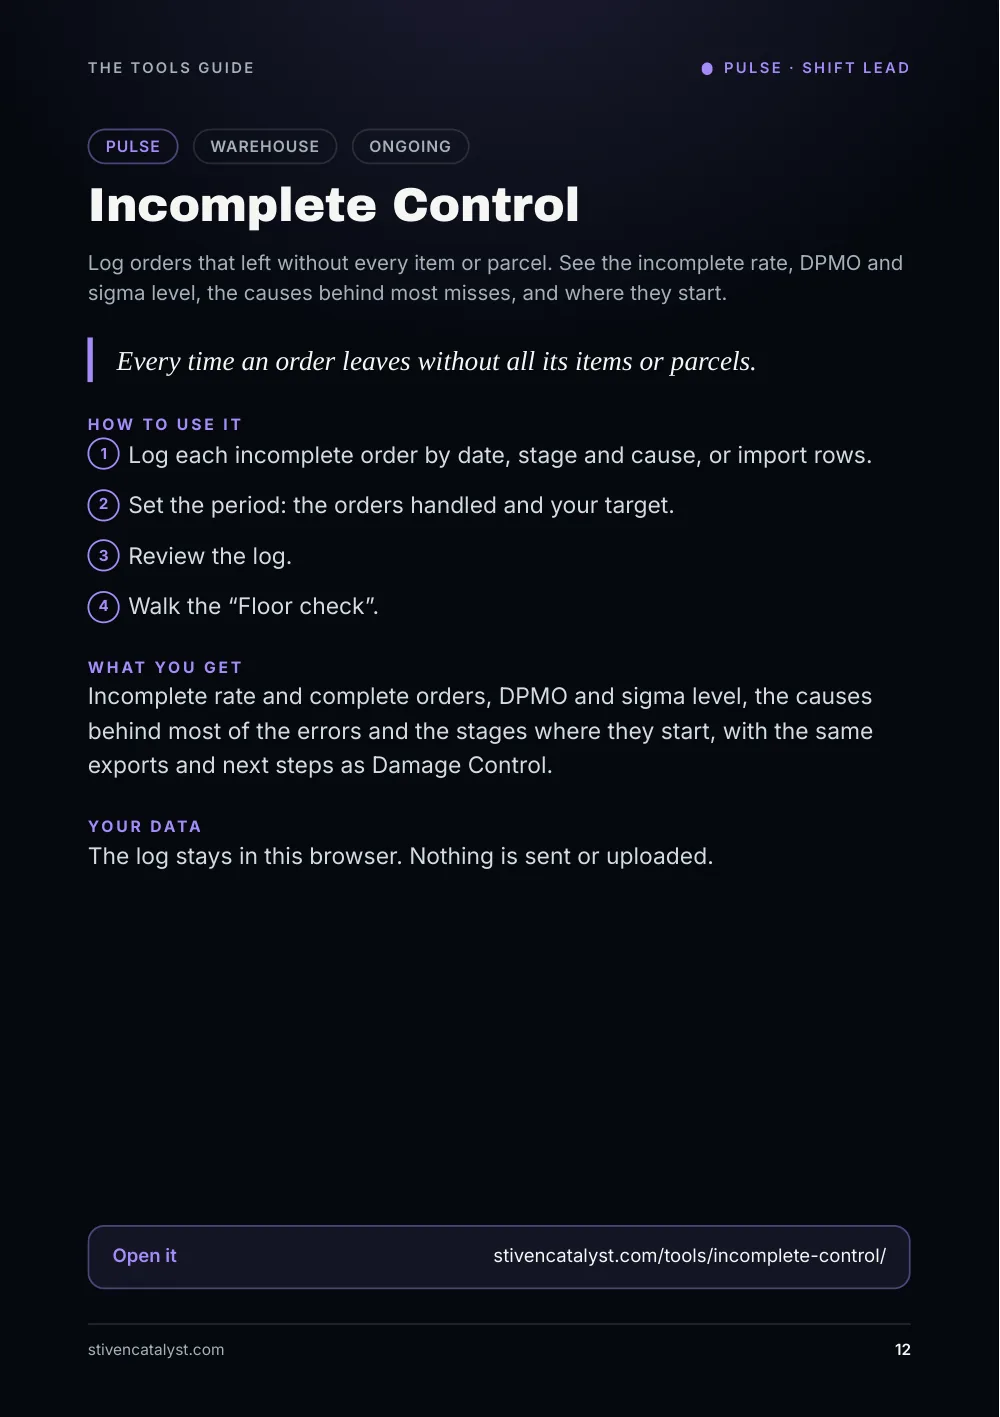
Incomplete Control
Warehouse · Ongoing. Log orders that left without every item or parcel. See the incomplete rate, DPMO and sigma level, the causes behind most misses, and where they start.
Every time an order leaves without all its items or parcels.
How to use it
- Log each incomplete order by date, stage and cause, or import rows.
- Set the period: the orders handled and your target.
- Review the log.
- Walk the “Floor check”.
What you get: Incomplete rate and complete orders, DPMO and sigma level, the causes behind most of the errors and the stages where they start, with the same exports and next steps as Damage Control.
Your data: The log stays in this browser. Nothing is sent or uploaded.
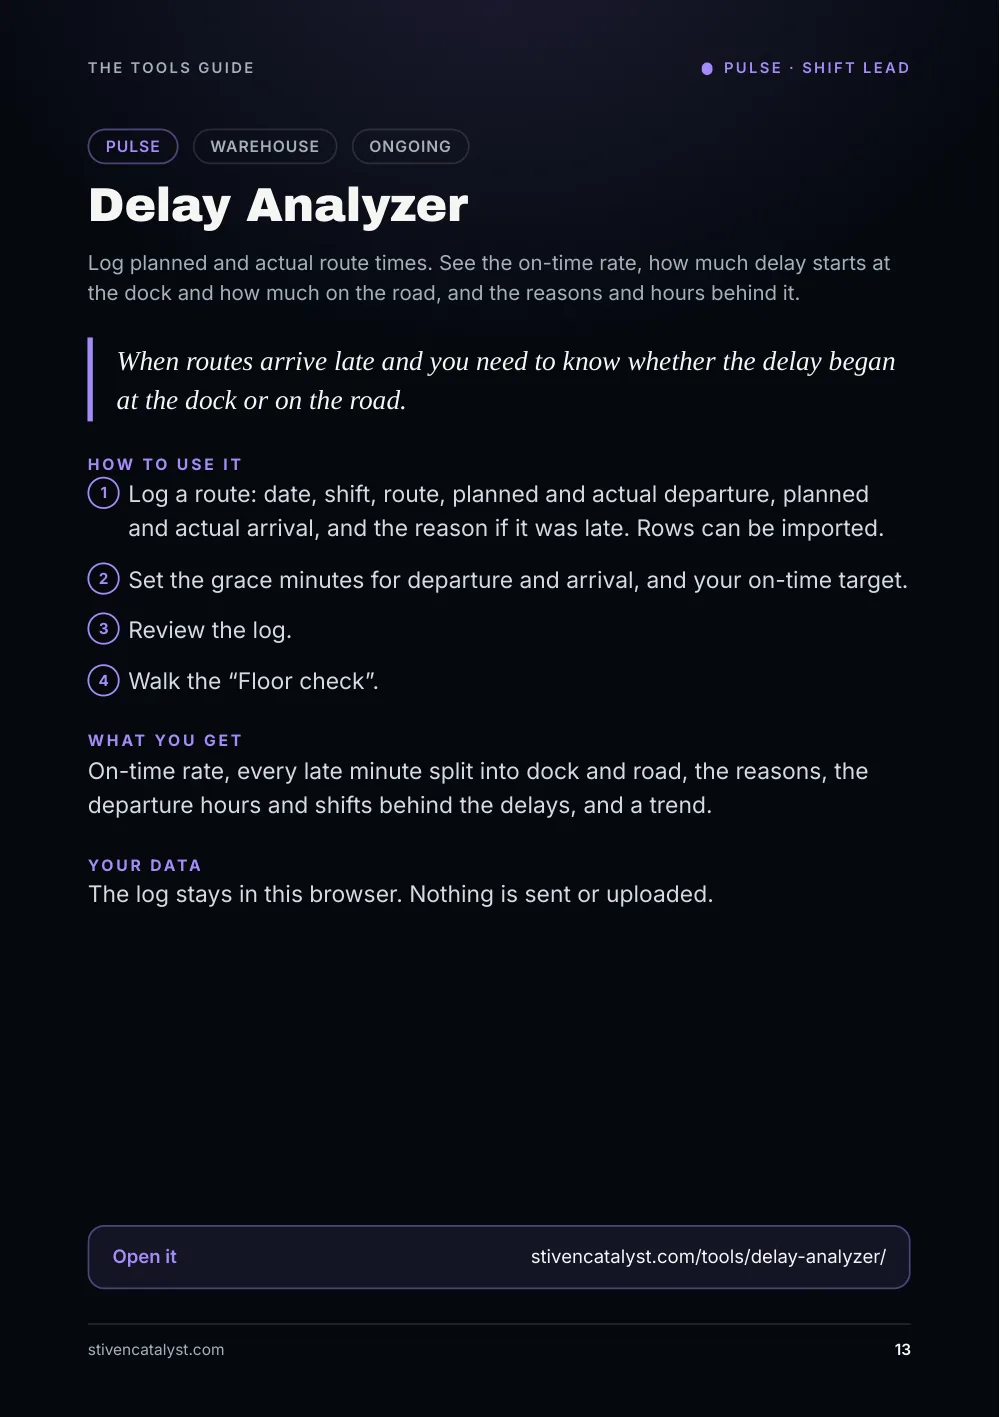
Delay Analyzer
Warehouse · Ongoing. Log planned and actual route times. See the on-time rate, how much delay starts at the dock and how much on the road, and the reasons and hours behind it.
When routes arrive late and you need to know whether the delay began at the dock or on the road.
How to use it
- Log a route: date, shift, route, planned and actual departure, planned and actual arrival, and the reason if it was late. Rows can be imported.
- Set the grace minutes for departure and arrival, and your on-time target.
- Review the log.
- Walk the “Floor check”.
What you get: On-time rate, every late minute split into dock and road, the reasons, the departure hours and shifts behind the delays, and a trend.
Your data: The log stays in this browser. Nothing is sent or uploaded.
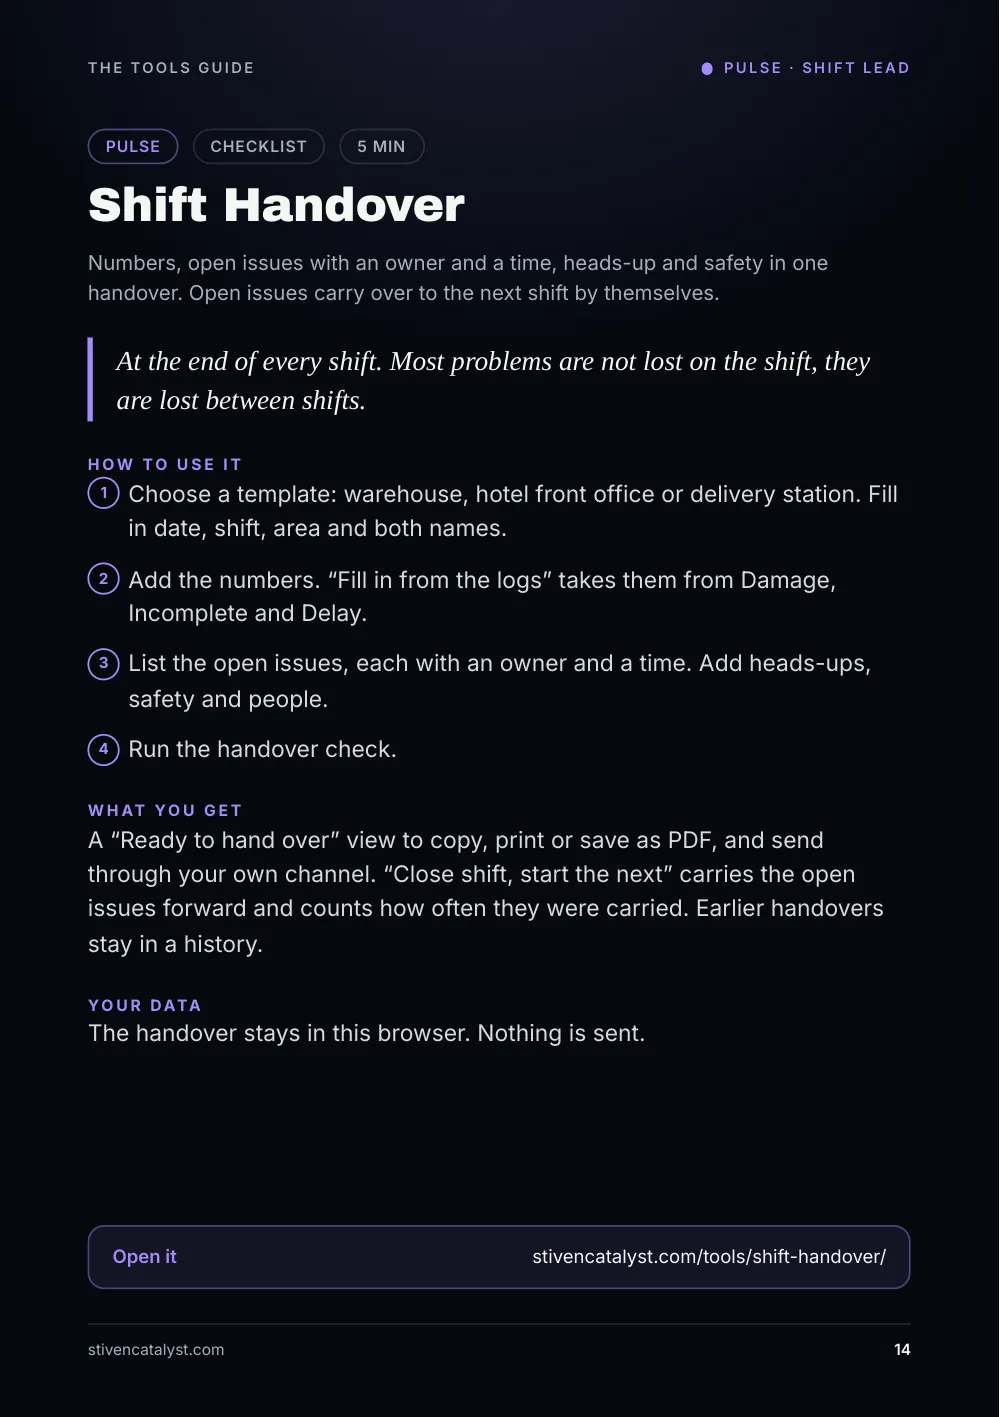
Shift Handover
Checklist · 5 min. Numbers, open issues with an owner and a time, heads-up and safety in one handover. Open issues carry over to the next shift by themselves.
At the end of every shift. Most problems are not lost on the shift, they are lost between shifts.
How to use it
- Choose a template: warehouse, hotel front office or delivery station. Fill in date, shift, area and both names.
- Add the numbers. “Fill in from the logs” takes them from Damage, Incomplete and Delay.
- List the open issues, each with an owner and a time. Add heads-ups, safety and people.
- Run the handover check.
What you get: A “Ready to hand over” view to copy, print or save as PDF, and send through your own channel. “Close shift, start the next” carries the open issues forward and counts how often they were carried. Earlier handovers stay in a history.
Your data: The handover stays in this browser. Nothing is sent.
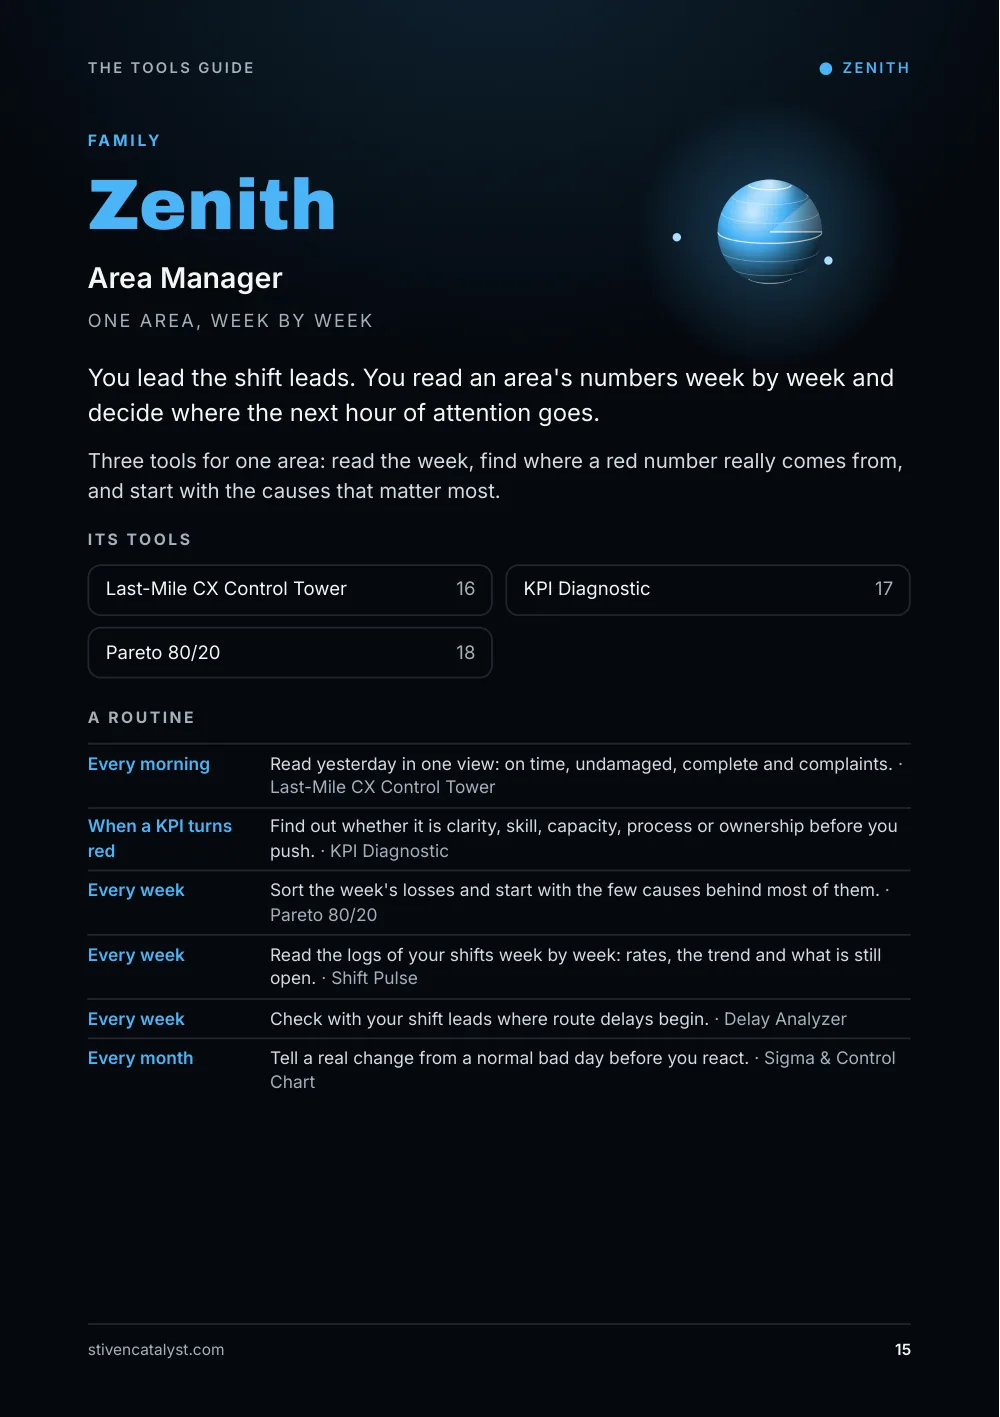
Family
Zenith · Area Manager
One area, week by week. You lead the shift leads. You read an area's numbers week by week and decide where the next hour of attention goes.
Three tools for one area: read the week, find where a red number really comes from, and start with the causes that matter most.
A routine
- Every morning: Read yesterday in one view: on time, undamaged, complete and complaints. (Last-Mile CX Control Tower)
- When a KPI turns red: Find out whether it is clarity, skill, capacity, process or ownership before you push. (KPI Diagnostic)
- Every week: Sort the week's losses and start with the few causes behind most of them. (Pareto 80/20)
- Every week: Read the logs of your shifts week by week: rates, the trend and what is still open. (Shift Pulse)
- Every week: Check with your shift leads where route delays begin. (Delay Analyzer)
- Every month: Tell a real change from a normal bad day before you react. (Sigma & Control Chart)
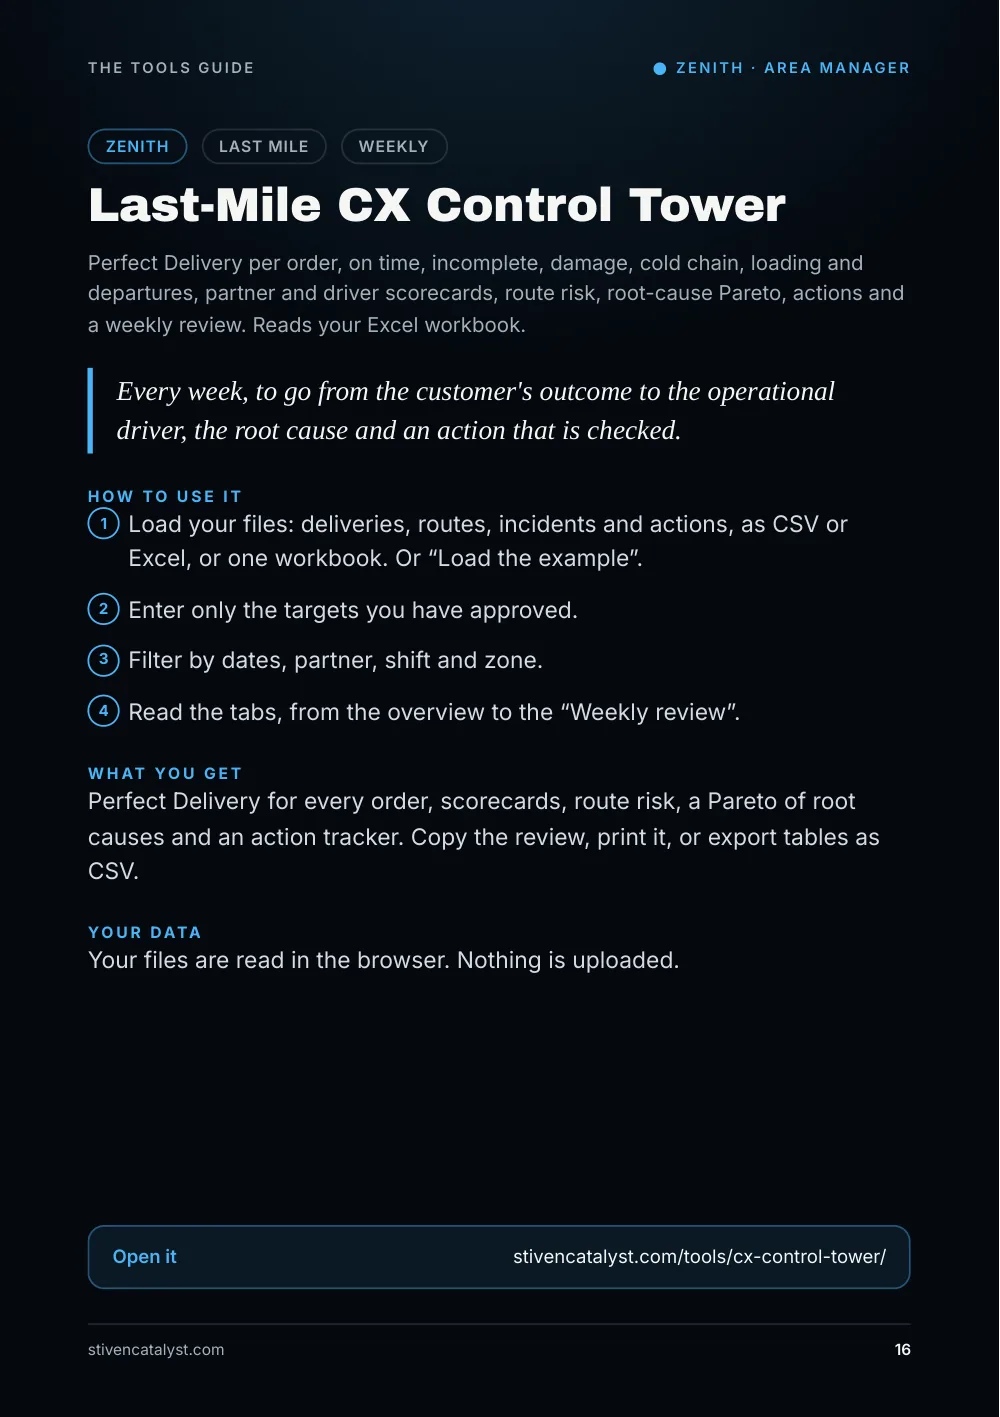
Last-Mile CX Control Tower
Last mile · Weekly. Perfect Delivery per order, on time, incomplete, damage, cold chain, loading and departures, partner and driver scorecards, route risk, root-cause Pareto, actions and a weekly review. Reads your Excel workbook.
Every week, to go from the customer's outcome to the operational driver, the root cause and an action that is checked.
How to use it
- Load your files: deliveries, routes, incidents and actions, as CSV or Excel, or one workbook. Or “Load the example”.
- Enter only the targets you have approved.
- Filter by dates, partner, shift and zone.
- Read the tabs, from the overview to the “Weekly review”.
What you get: Perfect Delivery for every order, scorecards, route risk, a Pareto of root causes and an action tracker. Copy the review, print it, or export tables as CSV.
Your data: Your files are read in the browser. Nothing is uploaded.
KPI Diagnostic
Diagnostic · 2 min. A number turned red. Ten statements show whether the cause is clarity, skill, capacity, process design or ownership, with first moves for each.
A number turned red. Before you push harder on it, find out where the cause sits.
How to use it
- Name the KPI, if you like.
- Rate ten statements.
- Press “See the result”.
What you get: The cause that fits best, clarity, skill, capacity, process design or ownership, with a score for each, three first moves and a “Question for the floor”.
Your data: Nothing you enter is stored or sent.
Pareto 80/20
Root causes · 5 min. Which few causes make most of your delays, errors, idle time or complaints? Templates for delivery, warehouse and hotel, CSV and Excel import, a checked chart.
When a few causes make most of the trouble and you need to know which to fix first.
How to use it
- Choose a template: delivery, warehouse or hotel. Or “Load the example”.
- Bring your data: a CSV or Excel file, or cells pasted from a sheet.
- Check the columns: cause, count, value, date.
- Rank the causes by how often they happen or by what they cost. If you like, compare before and after.
What you get: A checked Pareto chart with every row accounted for, “Where to start”, and exports as PNG, SVG and CSV.
Your data: Files are read in the browser, Excel included. Up to 20,000 rows are kept.
Family
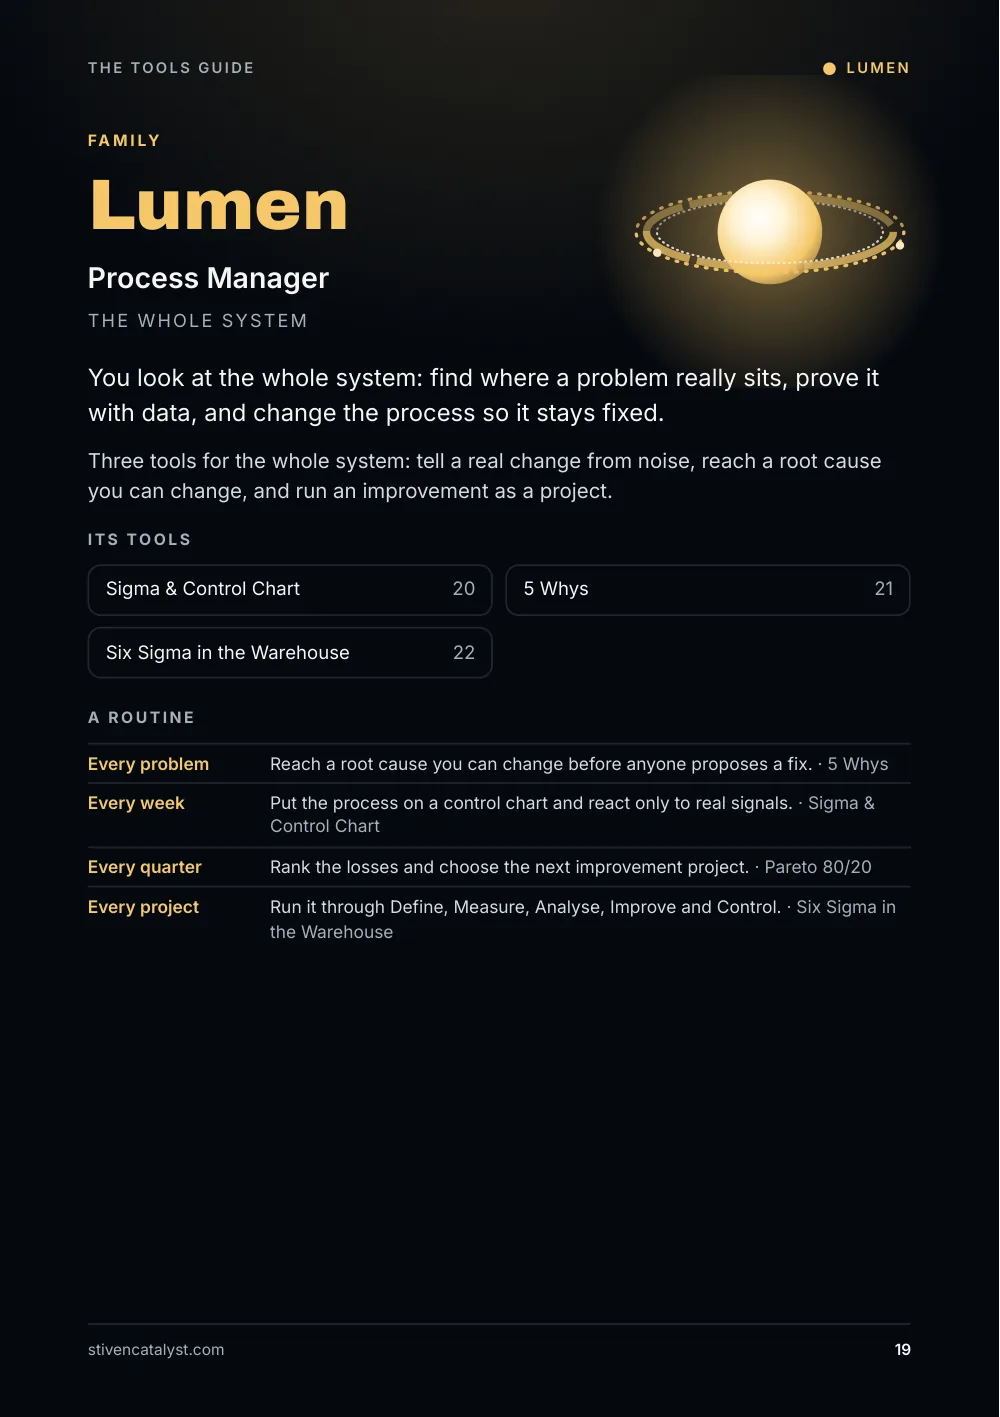
Lumen · Process Manager
The whole system. You look at the whole system: find where a problem really sits, prove it with data, and change the process so it stays fixed.
Three tools for the whole system: tell a real change from noise, reach a root cause you can change, and run an improvement as a project.
A routine
- Every problem: Reach a root cause you can change before anyone proposes a fix. (5 Whys)
- Every week: Put the process on a control chart and react only to real signals. (Sigma & Control Chart)
- Every quarter: Rank the losses and choose the next improvement project. (Pareto 80/20)
- Every project: Run it through Define, Measure, Analyse, Improve and Control. (Six Sigma in the Warehouse)
Sigma & Control Chart
Six Sigma · 5 min. Turn defects into a sigma level, combine on time, undamaged and complete into perfect delivery, and see whether a bad day is a signal or noise.
When you need to know how good a process is, and whether a bad day is a real change or normal noise.
How to use it
- For the sigma level: units, defects and chances per unit.
- For perfect delivery: on time, undamaged and complete, in percent.
- For the control chart: what you count, by day or by week, and a baseline.
- Add the days one by one with “Add a day”, or import rows.
What you get: The sigma level, perfect delivery, and a control chart that lists the “Signals to investigate”. Download as CSV, copy or print.
Your data: Everything stays in this browser.
5 Whys
Worksheet · 10 min. Move from a symptom to a root cause you can change, then agree one countermeasure, one owner and one check. Print it or save it as PDF.
When a problem comes back. Start from what happened, not from who did it.
How to use it
- Write the problem.
- Ask why, five times or as often as it takes.
- Name the root cause: something you can change.
- Agree a countermeasure, an owner, a due date and how you will know it worked.
What you get: A worksheet to print, save as PDF or copy as text. The log tools can send their problem straight into it.
Your data: The worksheet stays in this browser.
Six Sigma in the Warehouse
Course · 45 min. DMAIC in five steps on one warehouse case, with the tool to use at each step, three questions per step, the eight wastes and a project charter.
When an improvement is a project, not a quick fix.
How to use it
- Work through Define, Measure, Analyse, Improve and Control. Each step has its output, key ideas, common mistakes, a real case and “Check yourself”.
- Read the eight wastes and the glossary.
- Fill in the project charter, or “Fill with the course case” to see an example.
What you get: A DMAIC project charter to print, save as PDF or copy as text.
Your data: Your answers and your charter are kept only in this browser.
Family
Atlas · Career
Every orbit. Carry your experience into the next role: a designed CV, an ATS CV and a matching cover letter.
Three tools for the next role: a designed CV, a CV that screening software reads correctly, and a letter that matches.
A routine
- Every quarter: Add one result with a number to your CV while you still remember it. (CV Builder)
- Before you apply: Check your CV against the job ad, the way screening software reads it. (ATS CV)
- Every application: Write the letter for this company, not for any company. (Cover Letter)
CV Builder
Career · 20 min. A designer-quality CV on live A4 pages: photo, key figures, and company logos found from a website. In English, German or Albanian, saved as PDF.
When your CV should look designed, not typed.
How to use it
- Choose the CV's language, English, German or Albanian, its spacing and colours.
- Add a photo, your contact details, up to four key figures, a profile and your key achievements.
- Add your experience. A company's website brings in its logo.
- Add education, skills and languages, then read the CV check.
What you get: A CV you watch change on real A4 pages, downloaded as PDF, and a backup file you can open again with “Open a backup file”.
Your data: Kept in this browser, photos and logos included. Only the company websites you type go to Google's icon service, to fetch the logos.
ATS CV
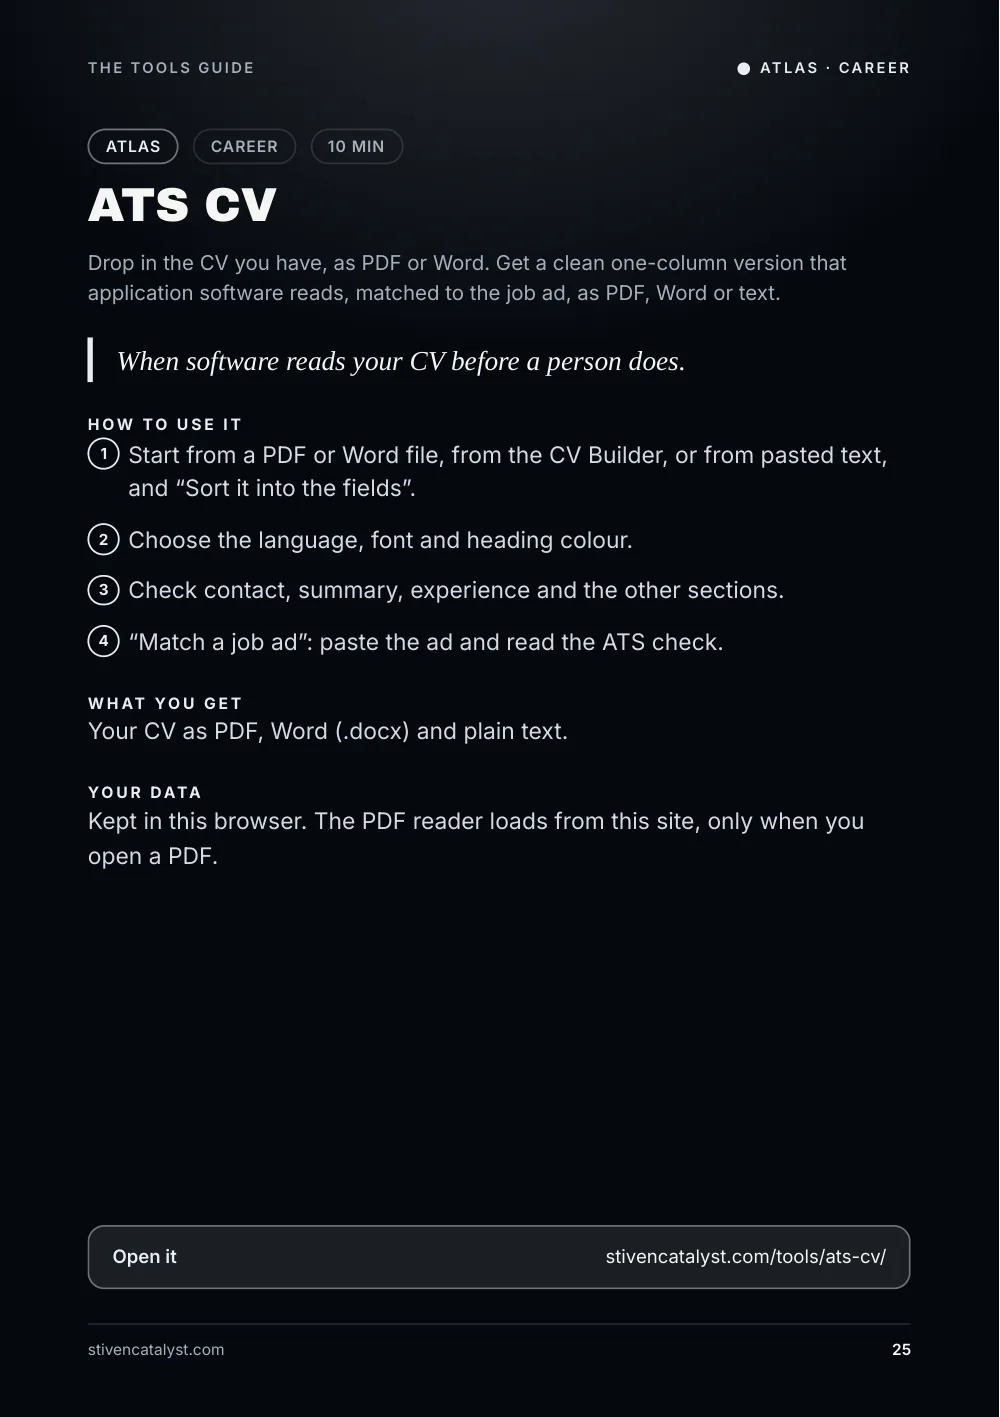
Career · 10 min. Drop in the CV you have, as PDF or Word. Get a clean one-column version that application software reads, matched to the job ad, as PDF, Word or text.
When software reads your CV before a person does.
How to use it
- Start from a PDF or Word file, from the CV Builder, or from pasted text, and “Sort it into the fields”.
- Choose the language, font and heading colour.
- Check contact, summary, experience and the other sections.
- “Match a job ad”: paste the ad and read the ATS check.
What you get: Your CV as PDF, Word (.docx) and plain text.
Your data: Kept in this browser. The PDF reader loads from this site, only when you open a PDF.
Cover Letter
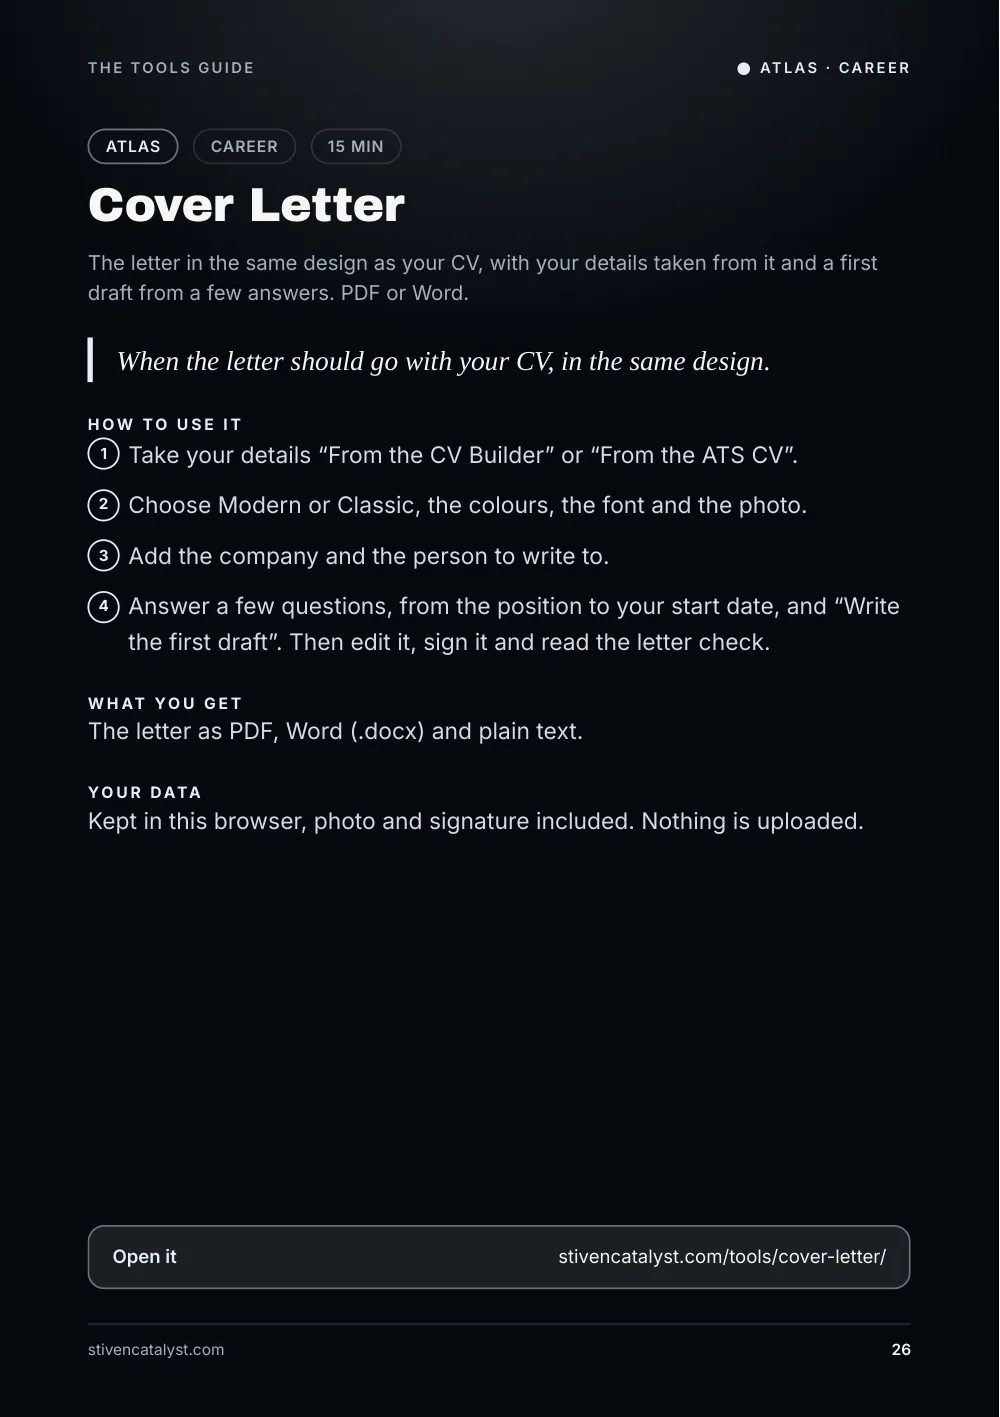
Career · 15 min. The letter in the same design as your CV, with your details taken from it and a first draft from a few answers. PDF or Word.
When the letter should go with your CV, in the same design.
How to use it
- Take your details “From the CV Builder” or “From the ATS CV”.
- Choose Modern or Classic, the colours, the font and the photo.
- Add the company and the person to write to.
- Answer a few questions, from the position to your start date, and “Write the first draft”. Then edit it, sign it and read the letter check.
What you get: The letter as PDF, Word (.docx) and plain text.
Your data: Kept in this browser, photo and signature included. Nothing is uploaded.
From a tool to a practice
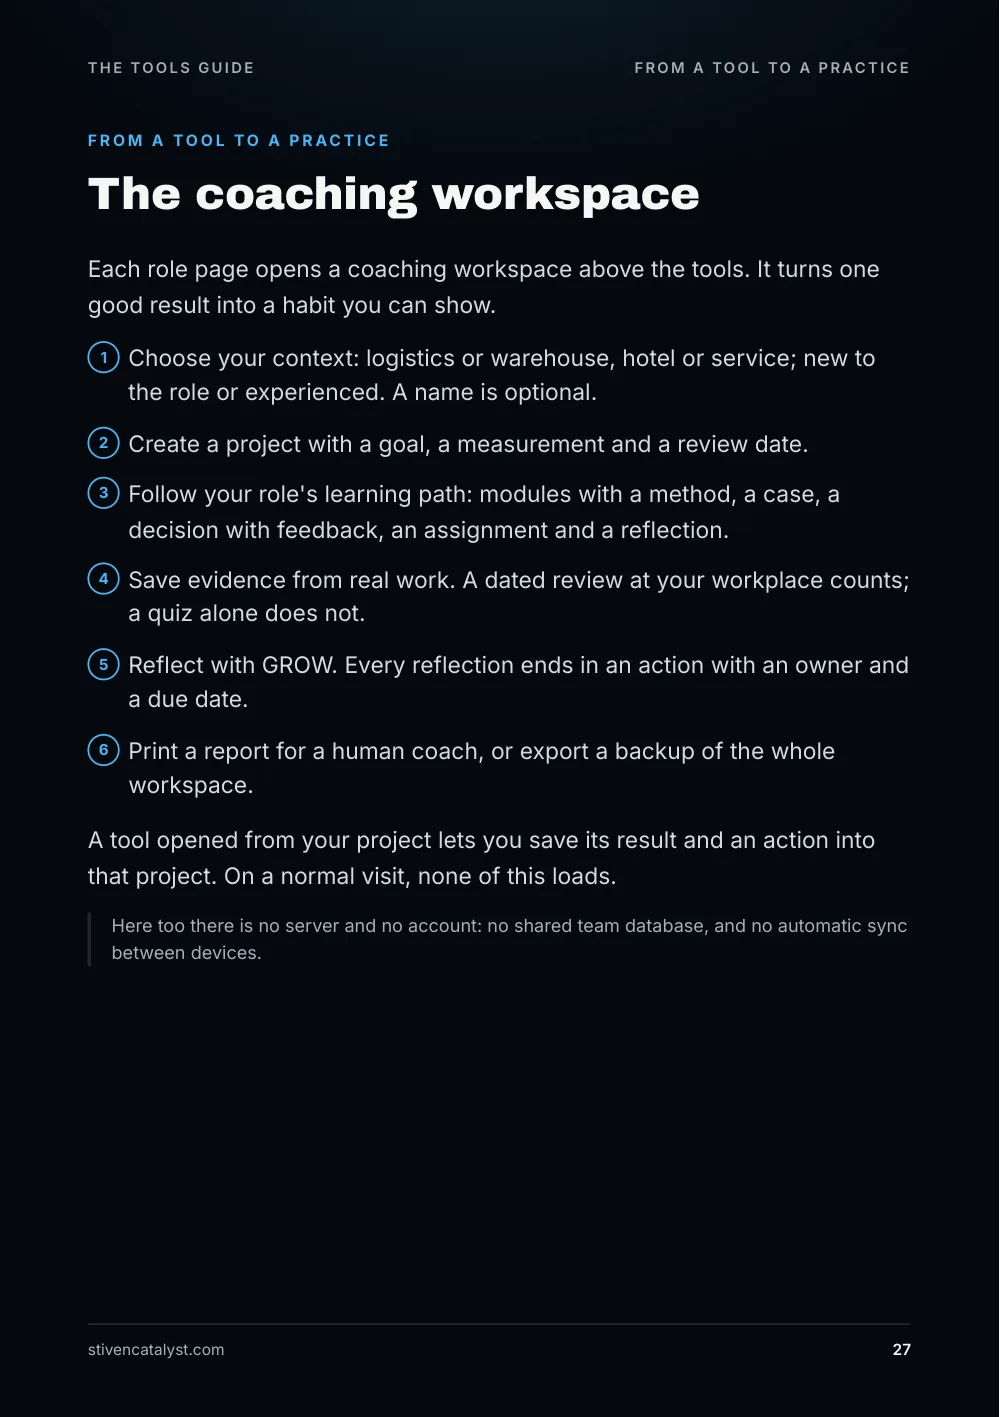
The coaching workspace
Each role page opens a coaching workspace above the tools. It turns one good result into a habit you can show.
- Choose your context: logistics or warehouse, hotel or service; new to the role or experienced. A name is optional.
- Create a project with a goal, a measurement and a review date.
- Follow your role's learning path: modules with a method, a case, a decision with feedback, an assignment and a reflection.
- Save evidence from real work. A dated review at your workplace counts; a quiz alone does not.
- Reflect with GROW. Every reflection ends in an action with an owner and a due date.
- Print a report for a human coach, or export a backup of the whole workspace.
A tool opened from your project lets you save its result and an action into that project. On a normal visit, none of this loads.
Here too there is no server and no account: no shared team database, and no automatic sync between devices.
Edition 2
What could come next
Ideas under consideration, not promises with dates. Tell me which one would help you most.
- Faster tool pages: smaller scripts, so the tools open more quickly on a phone.
- The Delay Analyzer for routes without a recorded departure time.
- A shared space for a coach and a team, but only with real accounts and access control, because the promise of these tools is that your data stays yours.
When a tool changes, this guide gets a new edition. The newest one is always on the site.
See clearly. Think differently. Act deliberately.