When a US company enrolled new hires in its savings plan unless they said no, joining rose from 37% to 86%, and three in four members kept the pre-set rate of 3%. Countries where people are organ donors unless they opt out show consent of 86% to nearly 100%; in four opt-in countries it was 4% to 28%. Across 58 studies, a default moved choices by about 27 percentage points on average, with a wide spread. Three channels explain how defaults work; a card closes the issue.
Management Review · Third series · November 2026 · No. 93
Defaults: the choice nobody makes
One company that turned its savings form around, eleven European countries and their organ donor rules, a meta-analysis of 58 default studies, the three ways a default works, and a card for the defaults a manager sets.
- No.
- 93
- Pages
- 10
- Sources
- 3
- Topics
- Strategy
- Online since
- 3 November 2026
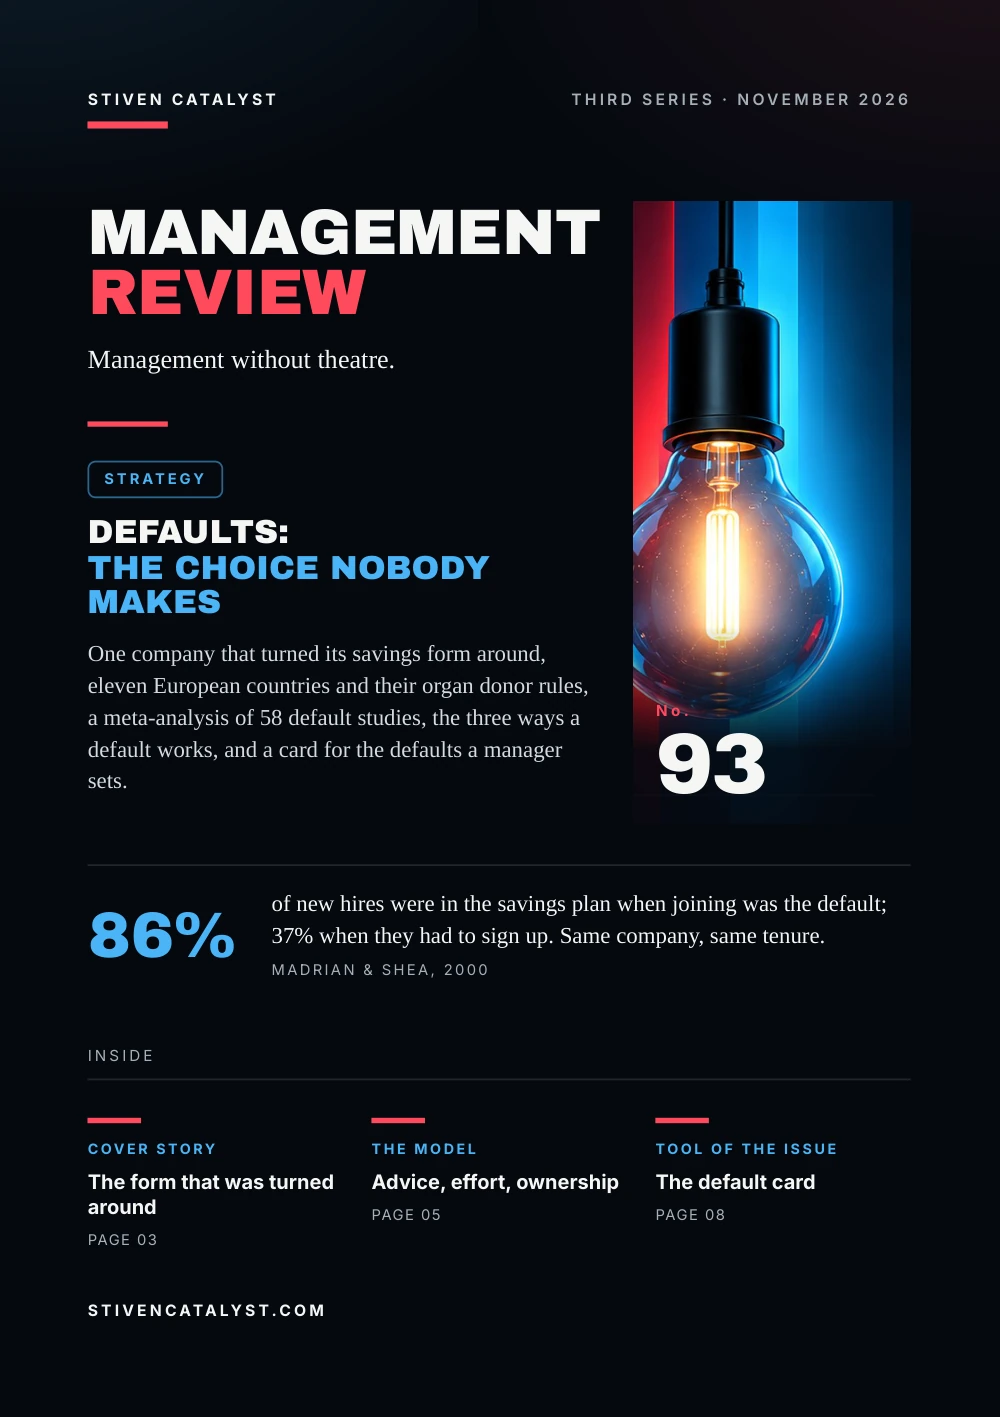
Stiven CatalystThird series · November 2026
ManagementReview
Management without theatre.
Strategy
Defaults:the choice nobody makes
One company that turned its savings form around, eleven European countries and their organ donor rules, a meta-analysis of 58 default studies, the three ways a default works, and a card for the defaults a manager sets.

No.93
86%
of new hires were in the savings plan when joining was the default; 37% when they had to sign up. Same company, same tenure.Madrian & Shea, 2000
stivencatalyst.com
No. 93 · Strategy
In this issue
A manager decides many things without deciding them: the box already ticked, the shift that repeats unless someone changes it, the step a checklist skips unless asked. What happens when nobody acts is itself a choice, and most people take it. This issue asks how strong that pull is, and how to set it on purpose.
- 03Cover storyThe form that was turned around
- 04The numbersOne word on a form
- 05The modelAdvice, effort, ownership
- 06What the research saysStrong on average, uneven in practice
- 07How it is measuredCount who stays put
- 08Tool of the issueThe default card
- 09SourcesSources and method
How to read this issue
Figure
Every figure has its source and year at the foot of its page.
Our reading
Where the editor interprets rather than the research, it says so.
Practice
The steps and the card are proposals to try, not research results.
Cover story
The form that wasturned around
Until April 1998, a large US health and insurance company let staff join its 401(k) savings plan after a year, by filling in a form or calling. From then on, new hires were enrolled on day one, at 3% of pay in a money market fund, unless they opted out. The employer match and the fund menu stayed the same.
New hires with 3–15 months' tenure, before and after the switch (1998–99)
76%of automatically enrolled members saved exactly 3%; about 10% of earlier members did
61%of the new cohort kept the whole default, rate and fund; 1% of earlier staff had chosen it
Our reading
The default brought people in, and then held them at a low rate in the safest fund. It decided both.
Source: Brigitte C. Madrian & Dennis F. Shea, National Bureau of Economic Research, 2000
Madrian & Shea, NBER working paper (2000): cohort hired before the switch, measured June 1998, against the first opt-out cohort, June 1999. Contribution rates are of members only. One firm; the authors find immediate eligibility explains little.
The numbers
One wordon a form
In explicit-consent countries nobody is an organ donor without registering; in presumed-consent countries everyone is, unless they register not to be. Eric Johnson and Daniel Goldstein set the two side by side in 2003, and ran the same choice online.
12% · 99.98%effective consent in Germany (opt-in) and Austria (opt-out)
27.5%in the Netherlands, after a 1998 registry, a campaign and over 12 million letters
Online experiment, 161 people: would be a donor, by the form of the question
Our reading
With no default, people chose much as under opt-out. Opt-in was the odd one out: it asked for effort most never made.
Source: Eric J. Johnson & Daniel Goldstein, Science 302(5649), 2003
Consent rates are registrations, not donations: the authors' estimate from registries (2003). Their regression found 16.3% more actual donations under opt-out (1991–2001). In the online test, changing the answer took one click.
The model
Advice, effor t,ownership
Johnson and Goldstein named three reasons a default sticks, and the later literature calls them endorsement, ease and endowment. A default can work through one, two or all three at once.
01
Endorsement
The pre-set option reads as advice from whoever set it. In the savings plan, earlier staff who joined after the switch, choosing for themselves, still leaned to the default fund.
02
Ease
Staying costs nothing; changing takes a form, a call, a minute. The harder the switch, the more may stay.
03
Endowment
The default feels like the status quo. Leaving it reads as a loss, and losses weigh more than equal gains.
In the meta-analysis, studies whose default carried endorsement or endowment showed larger effects; ease did not, perhaps because few studies varied the effort. Defaults were stronger for consumer choices and weaker for environmental ones, where the authors suspect preferences are held more firmly.
Our reading
A default from a manager the team trusts carries advice. Set it as if it were advice, because it will be read as such.
Sources: Eric J. Johnson & Daniel Goldstein, Science 302(5649), 2003; Jon M. Jachimowicz, Shannon Duncan, Elke U. Weber & Eric J. Johnson, Behavioural Public Policy 3(2), 2019; Brigitte C. Madrian & Dennis F. Shea, National Bureau of Economic Research, 2000
Channels from Johnson & Goldstein (2003) and Jachimowicz et al. (2019), who coded each study's channels by rater judgement, a rough measure. The advice effect is from Madrian & Shea (2000). The card texts are in our words.
What the research says
Strong on average,uneven in practice
Jon Jachimowicz and colleagues gathered the studies, up to May 2017, that compared an opt-in with an opt-out version of the same choice: 58 datasets from 35 articles, 73,675 people in all.
27 pointsaverage shift towards the pre-set option, in the 38 yes-or-no datasets
d = 0.68standardised effect, a medium one; healthy-eating nudges reached 0.23
The 58 results, by what they found
Our reading
The average is large, the spread larger. A default set at work is a trial: check what it does, do not assume it.
Source: Jon M. Jachimowicz, Shannon Duncan, Elke U. Weber & Eric J. Johnson, Behavioural Public Policy 3(2), 2019
Jachimowicz et al. (2019); “clear” means the confidence interval excludes zero. Heterogeneity was very high (I² 98%). The authors say choice architects often misjudge default effects and should test them. Pilots are in No. 69.
How it is measured
Count whostays put
Madrian and Shea measured a “default rate”: the share of people sitting exactly on the pre-set option, set against the share who had picked it when they had to choose. The same count works for any default at work.
Find it
forms, rosters, checklists, system settings: what happens if nobody acts?
Count who stays
the share exactly on the default, set against a period or group that chose actively
Split it
by group: in the plan, 74% of those earning under $20,000 stayed on the default, 30% at $70,000–79,000
Repeat it
defaults fade slowly: members on it fell from 92% to 57% over 15 months
Our reading
A high default rate is not success. It says the default decides; whether it decides well is a second question.
Source: Brigitte C. Madrian & Dennis F. Shea, National Bureau of Economic Research, 2000
Figures from Madrian & Shea (2000), one company, 1998–99, staff hired under automatic enrolment. Applying the count to forms and rosters is the editors' proposal.
Tool of the issue
The defaultcard
One card per default: a pre-ticked box, a standing roster, a step that runs unless someone stops it. Where the default becomes a step in the standard, Standard Work keeps it with its reason, so the next person knows why it is set that way.
01The choicewhat is decided, where: form, roster, checklist, system
02If nobody actswhat happens today, and who set it that way
03Would they choose it?what people pick when they must choose; who the default fits and who it fails
04The way outhow to change it, in how many steps; is it as easy as staying?
05The default we wantpre-set, or no pre-set and an active choice; the reason in one line
06Check ondate; share on the default, by group
Sources: Brigitte C. Madrian & Dennis F. Shea, National Bureau of Economic Research, 2000; Eric J. Johnson & Daniel Goldstein, Science 302(5649), 2003; Jon M. Jachimowicz, Shannon Duncan, Elke U. Weber & Eric J. Johnson, Behavioural Public Policy 3(2), 2019
The card is the editors' proposal, not research. It draws on Madrian & Shea's default rate, the two errors of a default and the active-choice option in Johnson & Goldstein (2003), and the advice to test in Jachimowicz et al. (2019).
Open the tool: Standard Workstivencatalyst.com/tools/standard-work/
Sources and method
Every figurehas a source.
The figures in this issue come from the sources below. The year shows how recent each one is.
- The Power of Suggestion: Inertia in 401(k) Participation and Savings Behavior (NBER Working Paper 7682; published in The Quarterly Journal of Economics 116(4), 2001)Brigitte C. Madrian & Dennis F. Shea, National Bureau of Economic Research, 2000https://www.nber.org/papers/w7682
- Do Defaults Save Lives?Eric J. Johnson & Daniel Goldstein, Science 302(5649), 2003https://doi.org/10.1126/science.1091721
- When and why defaults influence decisions: a meta-analysis of default effectsJon M. Jachimowicz, Shannon Duncan, Elke U. Weber & Eric J. Johnson, Behavioural Public Policy 3(2), 2019https://doi.org/10.1017/bpp.2018.43
Editorial method
Each figure was checked for its year, its publisher and what it measures, in the full text where it could be opened. A source read only in a summary, an abstract or excerpts is marked “via”. A figure not confirmed in what was read is marked so on its page, or left out. The editor's interpretation is marked “Our reading”.
ManagementReview
Management without theatre.
Every issue, one management question, checked against the best research.
All issues
stivencatalyst.com/magazine/management-review.html
Management Review · No. 93 · November 2026 · Stiven Catalyst
Edited by Stiven Janaqi, who answers for it; “the editors” in this publication means him. Its texts, translations, layout and the checking of figures against their sources are done in working sessions with Claude, an AI model by Anthropic.
stivencatalyst.com/how-this-is-made.html
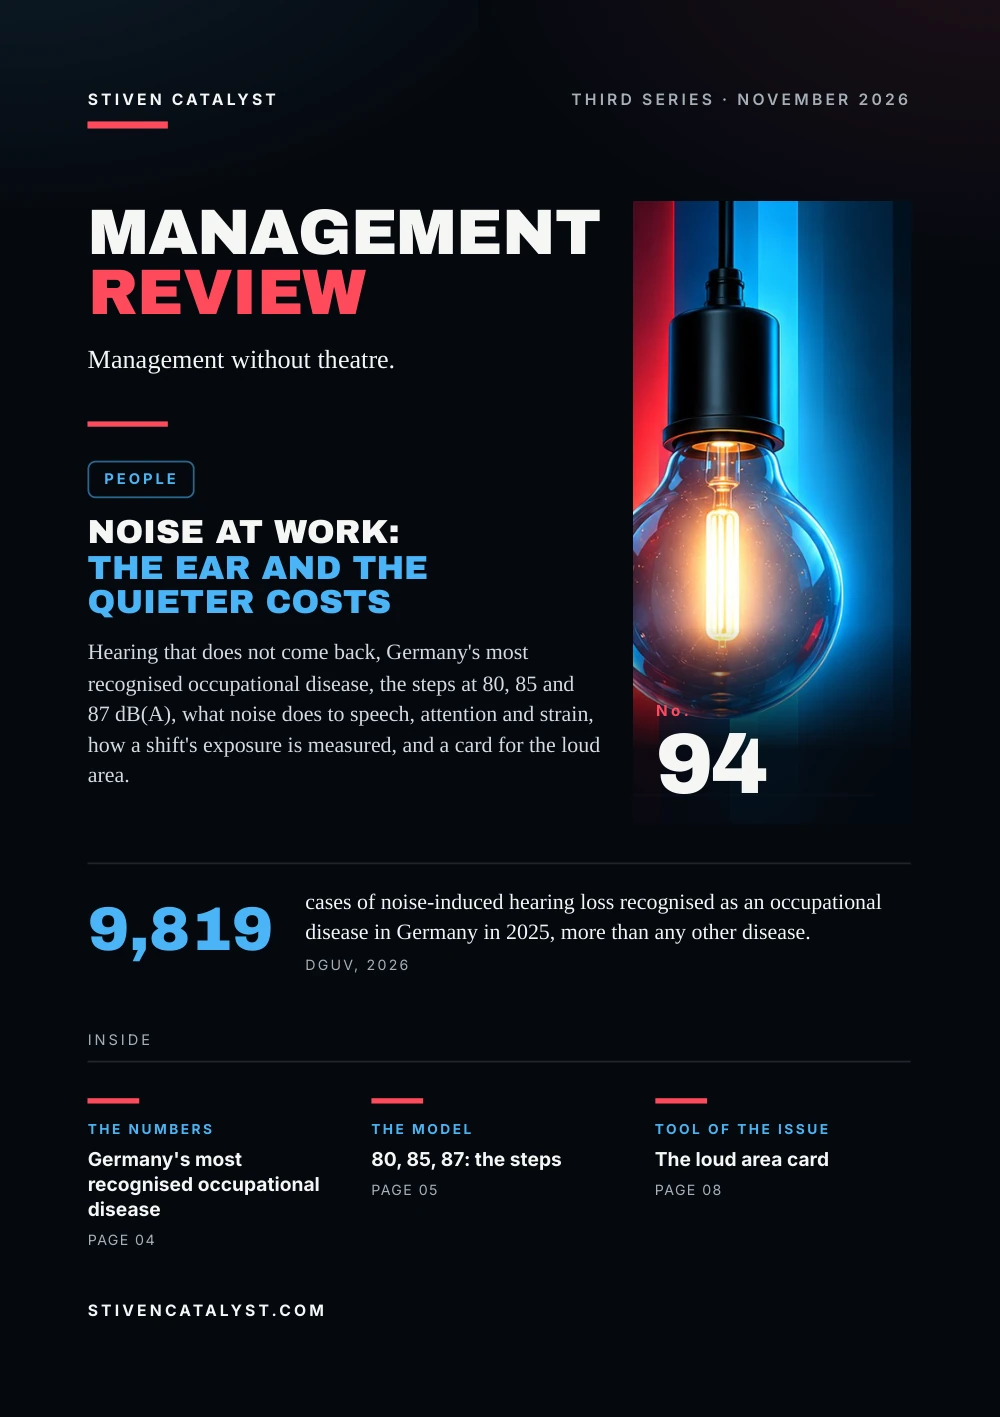 Next issue
Noise at work: the ear and the quieter costs
Click or swipe a page to turn it. The arrow keys work too.
Management Review · No. 93
The figures of the issue
The charts of the printed pages, with their sources.
Madrian & Shea, NBER working paper (2000): cohort hired before the switch, measured June 1998, against the first opt-out cohort, June 1999. Contribution rates are of members only. One firm; the authors find immediate eligibility explains little.
Source: Brigitte C. Madrian & Dennis F. Shea, National Bureau of Economic Research, 2000
Consent rates are registrations, not donations: the authors' estimate from registries (2003). Their regression found 16.3% more actual donations under opt-out (1991–2001). In the online test, changing the answer took one click.
Source: Eric J. Johnson & Daniel Goldstein, Science 302(5649), 2003
Jachimowicz et al. (2019); “clear” means the confidence interval excludes zero. Heterogeneity was very high (I² 98%). The authors say choice architects often misjudge default effects and should test them. Pilots are in No. 69.
Source: Jon M. Jachimowicz, Shannon Duncan, Elke U. Weber & Eric J. Johnson, Behavioural Public Policy 3(2), 2019
The whole text Read the issue as text For reading on a small screen, searching or a screen reader. The same words, without the page design.
In this issue
A manager decides many things without deciding them: the box already ticked, the shift that repeats unless someone changes it, the step a checklist skips unless asked. What happens when nobody acts is itself a choice, and most people take it. This issue asks how strong that pull is, and how to set it on purpose.
When a US company enrolled new hires in its savings plan unless they said no, joining rose from 37% to 86%, and three in four members kept the pre-set rate of 3%. Countries where people are organ donors unless they opt out show consent of 86% to nearly 100%; in four opt-in countries it was 4% to 28%. Across 58 studies, a default moved choices by about 27 percentage points on average, with a wide spread. Three channels explain how defaults work; a card closes the issue.
Stiven Janaqi, Editor
Cover story
The form that was turned around
Until April 1998, a large US health and insurance company let staff join its 401(k) savings plan after a year, by filling in a form or calling. From then on, new hires were enrolled on day one, at 3% of pay in a money market fund, unless they opted out. The employer match and the fund menu stayed the same.
New hires with 3–15 months' tenure, before and after the switch (1998–99): In the plan: Sign up 37%, Default 86%; Average contribution, % of pay: Sign up 7.4, Default 4.4.
- 76% of automatically enrolled members saved exactly 3%; about 10% of earlier members did
- 61% of the new cohort kept the whole default, rate and fund; 1% of earlier staff had chosen it
Our reading
The default brought people in, and then held them at a low rate in the safest fund. It decided both.
Madrian & Shea, NBER working paper (2000): cohort hired before the switch, measured June 1998, against the first opt-out cohort, June 1999. Contribution rates are of members only. One firm; the authors find immediate eligibility explains little.
Source: Brigitte C. Madrian & Dennis F. Shea, National Bureau of Economic Research, 2000
The numbers
One word on a form
In explicit-consent countries nobody is an organ donor without registering; in presumed-consent countries everyone is, unless they register not to be. Eric Johnson and Daniel Goldstein set the two side by side in 2003, and ran the same choice online.
- 12% · 99.98% effective consent in Germany (opt-in) and Austria (opt-out)
- 27.5% in the Netherlands, after a 1998 registry, a campaign and over 12 million letters
Online experiment, 161 people: would be a donor, by the form of the question: Opt-in 42%, Opt-out 82%, No default 79%.
Our reading
With no default, people chose much as under opt-out. Opt-in was the odd one out: it asked for effort most never made.
Consent rates are registrations, not donations: the authors' estimate from registries (2003). Their regression found 16.3% more actual donations under opt-out (1991–2001). In the online test, changing the answer took one click.
Source: Eric J. Johnson & Daniel Goldstein, Science 302(5649), 2003
The model
Advice, effor t, ownership
Johnson and Goldstein named three reasons a default sticks, and the later literature calls them endorsement, ease and endowment. A default can work through one, two or all three at once.
- Endorsement. The pre-set option reads as advice from whoever set it. In the savings plan, earlier staff who joined after the switch, choosing for themselves, still leaned to the default fund.
- Ease. Staying costs nothing; changing takes a form, a call, a minute. The harder the switch, the more may stay.
- Endowment. The default feels like the status quo. Leaving it reads as a loss, and losses weigh more than equal gains.
In the meta-analysis, studies whose default carried endorsement or endowment showed larger effects; ease did not, perhaps because few studies varied the effort. Defaults were stronger for consumer choices and weaker for environmental ones, where the authors suspect preferences are held more firmly.
Our reading
A default from a manager the team trusts carries advice. Set it as if it were advice, because it will be read as such.
Channels from Johnson & Goldstein (2003) and Jachimowicz et al. (2019), who coded each study's channels by rater judgement, a rough measure. The advice effect is from Madrian & Shea (2000). The card texts are in our words.
Sources: Eric J. Johnson & Daniel Goldstein, Science 302(5649), 2003; Jon M. Jachimowicz, Shannon Duncan, Elke U. Weber & Eric J. Johnson, Behavioural Public Policy 3(2), 2019; Brigitte C. Madrian & Dennis F. Shea, National Bureau of Economic Research, 2000
What the research says
Strong on average, uneven in practice
Jon Jachimowicz and colleagues gathered the studies, up to May 2017, that compared an opt-in with an opt-out version of the same choice: 58 datasets from 35 articles, 73,675 people in all.
- 27 points average shift towards the pre-set option, in the 38 yes-or-no datasets
- d = 0.68 standardised effect, a medium one; healthy-eating nudges reached 0.23
The 58 results, by what they found: Clear effect towards the default 46, No clear effect 10, Clear effect the other way 2.
Our reading
The average is large, the spread larger. A default set at work is a trial: check what it does, do not assume it.
Jachimowicz et al. (2019); “clear” means the confidence interval excludes zero. Heterogeneity was very high (I² 98%). The authors say choice architects often misjudge default effects and should test them. Pilots are in No. 69.
Source: Jon M. Jachimowicz, Shannon Duncan, Elke U. Weber & Eric J. Johnson, Behavioural Public Policy 3(2), 2019
How it is measured
Count who stays put
Madrian and Shea measured a “default rate”: the share of people sitting exactly on the pre-set option, set against the share who had picked it when they had to choose. The same count works for any default at work.
- Find it. forms, rosters, checklists, system settings: what happens if nobody acts?
- Count who stays. the share exactly on the default, set against a period or group that chose actively
- Split it. by group: in the plan, 74% of those earning under $20,000 stayed on the default, 30% at $70,000–79,000
- Repeat it. defaults fade slowly: members on it fell from 92% to 57% over 15 months
Our reading
A high default rate is not success. It says the default decides; whether it decides well is a second question.
Figures from Madrian & Shea (2000), one company, 1998–99, staff hired under automatic enrolment. Applying the count to forms and rosters is the editors' proposal.
Source: Brigitte C. Madrian & Dennis F. Shea, National Bureau of Economic Research, 2000
Tool of the issue
The default card
One card per default: a pre-ticked box, a standing roster, a step that runs unless someone stops it. Where the default becomes a step in the standard, Standard Work keeps it with its reason, so the next person knows why it is set that way.
- The choice what is decided, where: form, roster, checklist, system
- If nobody acts what happens today, and who set it that way
- Would th
e y choose it? what people pick when they must choose; who the default fits and who it fails - The way out how to change it, in how many steps; is it as easy as staying?
- The default we want pre-set, or no pre-set and an active choice; the reason in one line
- Check on date; share on the default, by group
The card is the editors' proposal, not research. It draws on Madrian & Shea's default rate, the two errors of a default and the active-choice option in Johnson & Goldstein (2003), and the advice to test in Jachimowicz et al. (2019).
Sources: Brigitte C. Madrian & Dennis F. Shea, National Bureau of Economic Research, 2000; Eric J. Johnson & Daniel Goldstein, Science 302(5649), 2003; Jon M. Jachimowicz, Shannon Duncan, Elke U. Weber & Eric J. Johnson, Behavioural Public Policy 3(2), 2019
Open the tool: Standard Work
Sources and method
Every figure has a source.
The figures in this issue come from the sources below. The year shows how recent each one is.
- Brigitte C. Madrian & Dennis F. Shea, National Bureau of Economic Research, “The Power of Suggestion: Inertia in 401(k) Participation and Savings Behavior (NBER Working Paper 7682; published in The Quarterly Journal of Economics 116(4), 2001)”, 2000. https://www.nber.org/papers/w7682
- Eric J. Johnson & Daniel Goldstein, Science 302(5649), “Do Defaults Save Lives?”, 2003. https://doi.org/10.1126/science.1091721
- Jon M. Jachimowicz, Shannon Duncan, Elke U. Weber & Eric J. Johnson, Behavioural Public Policy 3(2), “When and why defaults influence decisions: a meta-analysis of default effects”, 2019. https://doi.org/10.1017/bpp.2018.43
Edit orial me thod
Each figure was checked for its year, its publisher and what it measures, in the full text where it could be opened. A source read only in a summary, an abstract or excerpts is marked “via”. A figure not confirmed in what was read is marked so on its page, or left out. The editor's interpretation is marked “Our reading”.
Edited by Stiven Janaqi, who answers for it; “the editors” in this publication means him. Its texts, translations, layout and the checking of figures against their sources are done in working sessions with Claude, an AI model by Anthropic. How this is made
Management Review · Monthly edition