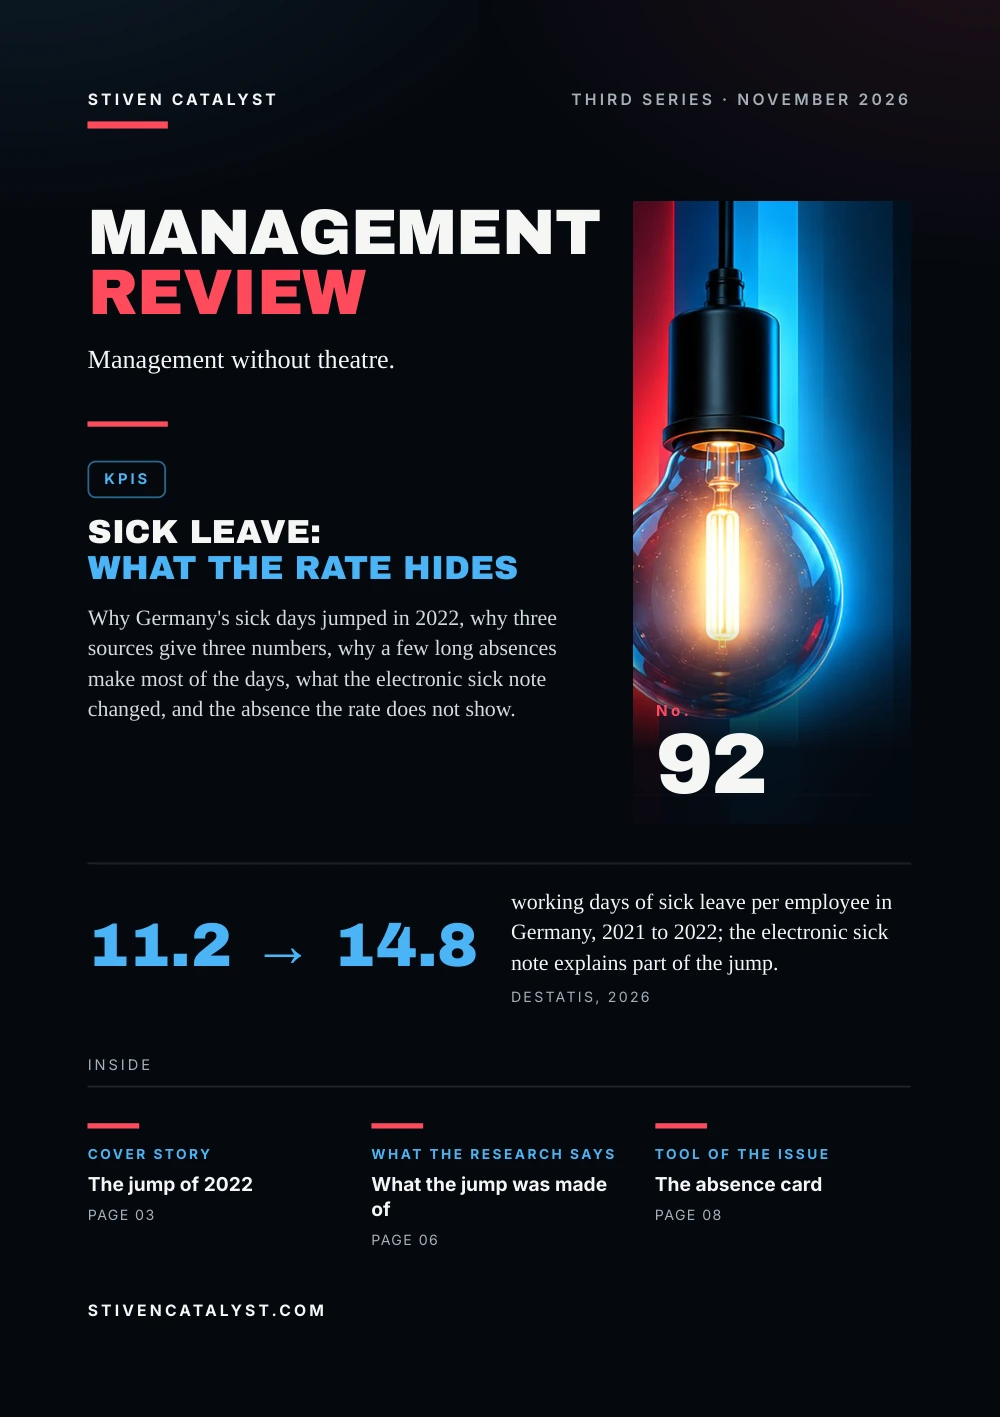
Destatis puts sick leave at 11.2 working days per employee in 2021 and 14.8 in 2022, the year the sick note began to travel electronically from the doctor to the insurer. The insurers count in other units, so their figures differ. In TK's data, 3.6% of sick notes made 45.7% of the days. DAK's analysis traces much of the jump to more complete counting. And 62.5% of employees surveyed had worked while sick.
Management Review · Third series · November 2026 · No. 92
Sick leave: what the rate hides
Why Germany's sick days jumped in 2022, why three sources give three numbers, why a few long absences make most of the days, what the electronic sick note changed, and the absence the rate does not show.
- No.
- 92
- Pages
- 10
- Sources
- 4
- Topics
- KPIs
- Online since
- 3 November 2026
Stiven CatalystThird series · November 2026
ManagementReview
Management without theatre.
KPIs
Sick leave:what the rate hides
Why Germany's sick days jumped in 2022, why three sources give three numbers, why a few long absences make most of the days, what the electronic sick note changed, and the absence the rate does not show.

No.92
11.2 → 14.8
working days of sick leave per employee in Germany, 2021 to 2022; the electronic sick note explains part of the jump.Destatis, 2026
stivencatalyst.com
No. 92 · KPIs
In this issue
Sickness absence is one of the few people figures every company has, and it is often read as a sign of morale or discipline. This issue asks what the number actually counts, how Germany counts it, why it jumped in 2022, and what it leaves out.
- 03Cover storyThe jump of 2022
- 04The numbersThree sources, three numbers
- 05The modelFew long cases, most of the days
- 06What the research saysWhat the jump was made of
- 07What the rate hidesPresent, but sick
- 08Tool of the issueThe absence card
- 09SourcesSources and method
How to read this issue
Figure
Every figure has its source and year at the foot of its page.
Our reading
Where the editor interprets rather than the research, it says so.
Practice
The steps and the card are proposals to try, not research results.
Cover story
The jumpof 2022
For years employees in Germany were off sick for around 10 to 11 working days a year. In 2022 the figure rose to 14.8. That year the paper sick note began to give way: from January, practices switched one by one to sending it to the health insurer electronically.
Working days of sick leave per employee, Germany (Destatis, 2026)
Before, employees sent the insurer its copy themselves. Asked in DAK's survey of 2024, 57.5% said they always had, 12.5% sometimes, 16.3% never. Destatis attributes the rise since 2021 partly to the electronic note, which records short absences more fully.
Our reading
When the way of counting changes, the number moves even if nobody is sicker. Compare the years since 2022 with each other.
Sources: Statistisches Bundesamt (Destatis), nach der Arbeitszeitrechnung des IAB, 2026; Bundesministerium der Justiz, gesetze-im-internet.de, 1994; DAK-Gesundheit; Susanne Hildebrandt, Terese Dehl & Hans-Dieter Nolting, IGES Institut, 2025
Destatis, days lost per employee, from the IAB's working-time accounts; by its account only absences over three days are counted, so the true figure is likely higher. A note is due after three calendar days, or sooner if the employer asks (§ 5 EntgFG).
The numbers
Three sources,three numbers
Each source counts in its own way: working days or calendar days, employees or all insured people, every day of the year or one day a month. The figures cannot be set side by side without saying which.
Destatis: 14.6 days (2025)
working days lost per employee, from the IAB's working-time accounts
TK: 18.5 days, 5.08% (2025)
calendar days per insured year; members in work or on unemployment benefit; standardised by age and sex
DAK: 5.4% (2024)
the share off sick on an average calendar day: 1,967.4 days per 100 insured years over 366 days
TK's rate for 2025, counted two ways (2026)
Our reading
A higher figure from an insurer does not mean more sickness. Often it is another unit.
Sources: Statistisches Bundesamt (Destatis), nach der Arbeitszeitrechnung des IAB, 2026; Techniker Krankenkasse; Thomas Grobe & Sven Bessel, aQua-Institut, 2026; DAK-Gesundheit; Susanne Hildebrandt, Terese Dehl & Hans-Dieter Nolting, IGES Institut, 2025
The health ministry's monthly statistic counts on the first of each month. TK recomputed its own data that way; in 2025 many of those days fell on weekends, holidays or days with low sickness, so the method came out low.
The model
Few long cases,most of the days
The rate is the number of sick notes times their average length, spread over the days of the year. Two teams can share the same rate, one with many short absences and one with a few long ones.
Sick notes by length, TK members, 2025 (2026)
Our reading
Short absences disrupt the shift; long ones make the rate. They call for different answers: cover for the first, a way back to work for the second.
Sources: Techniker Krankenkasse; Thomas Grobe & Sven Bessel, aQua-Institut, 2026; Bundesministerium der Justiz, gesetze-im-internet.de, 1994; Statistisches Bundesamt (Destatis), nach der Arbeitszeitrechnung des IAB, 2026
TK raw figures; the editors added 15–28 and 29–42 days into one row. Six weeks is where the employer's sick pay ends and the insurer's sickness benefit begins (§ 3 EntgFG). Notes of up to three days are counted incompletely.
What the research says
What the jumpwas made of
For its 2025 report DAK-Gesundheit had the IGES Institute take the jump apart. Its rate rose from 4.0% in 2021 to 5.5% in 2022. Of the extra sick notes, 94% lasted up to 14 days; they made 80% of the extra days.
Employees with at least one sick report in a year: what they say and what the insurer saw (2025)
Colds (J06) made 35% of the extra days. Doctors did treat more of them: 20.1% of insured employees in late 2023, 9.7% in late 2019. That predicts notes for 8.8%; DAK received them for 13.8%. IGES puts 60% of that rise down to the electronic note, 40% to more treatment.
Our reading
What employees say barely moved; what the insurer saw rose by 13 points. Much of the new sickness is old sickness, now counted.
Source: DAK-Gesundheit; Susanne Hildebrandt, Terese Dehl & Hans-Dieter Nolting, IGES Institut, 2025
DAK: 2.4 million members. Survey: 7,068 employees asked online by forsa in 2024, weighted to be representative, set beside DAK's survey of 2015. The 60:40 split is IGES's estimate for one diagnosis, J06, averaged over 2023.
What the rate hides
Present,but sick
A low rate can also mean that people come in sick. In DAK's 2024 survey, 62.5% of employees had worked at least once in the past year when they should have reported sick, at the workplace or from home; in 2015, 67.5%.
Reasons given by those who worked sick, 2024 (2025)
Our reading
The most common reason is loyalty to colleagues. Where there is no cover, coming in sick is how people protect the team.
Source: DAK-Gesundheit; Susanne Hildebrandt, Terese Dehl & Hans-Dieter Nolting, IGES Institut, 2025
Shares of the 3,950–4,261 who had worked sick; several reasons could apply. A bonus for no sick days moved 1.6%. 92.2% of all respondents never stayed away without good reason. Burnout is in No. 29, mental health in No. 75.
Tool of the issue
The absencecard
One card for reading the team's absence each month. The Shift Capacity tool takes an absence allowance when it works out the heads each shift needs, so the absence you expect is planned rather than absorbed.
01What is countedworking or calendar days; who is in the base; notes only, or every absence
02How often, how longnumber of absences and average length, separately
03Long cases apartover six weeks: who supports the return
04Same month last yearcolds peak in winter; compare like with like, never one day
05Worked sickask the team, anonymously: who came in or logged on ill, and why
06What we changecover, workload, the absence allowance in the plan
Sources: Statistisches Bundesamt (Destatis), nach der Arbeitszeitrechnung des IAB, 2026; Techniker Krankenkasse; Thomas Grobe & Sven Bessel, aQua-Institut, 2026; DAK-Gesundheit; Susanne Hildebrandt, Terese Dehl & Hans-Dieter Nolting, IGES Institut, 2025
The card is the editors' proposal, built on the definitions of Destatis, TK and DAK and on DAK's survey; it uses the team's figures, never a person's diagnosis. The essay linked below sets out the author's card for any KPI.
More in the essayKPIs the team trusts
Open the tool: Shift Capacitystivencatalyst.com/tools/shift-capacity/
Sources and method
Every figurehas a source.
The figures in this issue come from the sources below. The year shows how recent each one is.
- Indikatoren zur Qualität der Arbeit: KrankenstandStatistisches Bundesamt (Destatis), nach der Arbeitszeitrechnung des IAB, 2026https://www.destatis.de/DE/Themen/Arbeit/Arbeitsmarkt/Indikatoren-Qualitaet-Arbeit/Dimension-2/krankenstand.html
- Entgeltfortzahlungsgesetz (EntgFG), § 3 Anspruch auf Entgeltfortzahlung im Krankheitsfall und § 5 Anzeige- und NachweispflichtenBundesministerium der Justiz, gesetze-im-internet.de, 1994https://www.gesetze-im-internet.de/entgfg/
- Gesundheitsreport 2026: ArbeitsunfähigkeitenTechniker Krankenkasse; Thomas Grobe & Sven Bessel, aQua-Institut, 2026https://www.tk.de/resource/blob/2214302/78df7e278b4eb9519cf89ef483ecb8a7/gesundheitsreport-au-2026-data.pdf
- Gesundheitsreport 2025: Analyse der Arbeitsunfähigkeiten. Mythos Rekordkrankenstand. Generation Z in der ArbeitsweltDAK-Gesundheit; Susanne Hildebrandt, Terese Dehl & Hans-Dieter Nolting, IGES Institut, 2025https://caas.content.dak.de/caas/v1/media/142382/data/8f878876acd7ba6e3076622bcc006219/gesundheitsreport2025-ebook.pdf
Editorial method
Each figure was checked for its year, its publisher and what it measures, in the full text where it could be opened. A source read only in a summary, an abstract or excerpts is marked “via”. A figure not confirmed in what was read is marked so on its page, or left out. The editor's interpretation is marked “Our reading”.
ManagementReview
Management without theatre.
Every issue, one management question, checked against the best research.
All issues
stivencatalyst.com/magazine/management-review.html
Management Review · No. 92 · November 2026 · Stiven Catalyst
Edited by Stiven Janaqi, who answers for it; “the editors” in this publication means him. Its texts, translations, layout and the checking of figures against their sources are done in working sessions with Claude, an AI model by Anthropic.
stivencatalyst.com/how-this-is-made.html
 Next issue
Defaults: the choice nobody makes
Click or swipe a page to turn it. The arrow keys work too.
Management Review · No. 92
The figures of the issue
The charts of the printed pages, with their sources.
Destatis, days lost per employee, from the IAB's working-time accounts; by its account only absences over three days are counted, so the true figure is likely higher. A note is due after three calendar days, or sooner if the employer asks (§ 5 EntgFG).
Source: Statistisches Bundesamt (Destatis), nach der Arbeitszeitrechnung des IAB, 2026
The health ministry's monthly statistic counts on the first of each month. TK recomputed its own data that way; in 2025 many of those days fell on weekends, holidays or days with low sickness, so the method came out low.
Source: Techniker Krankenkasse; Thomas Grobe & Sven Bessel, aQua-Institut, 2026
TK raw figures; the editors added 15–28 and 29–42 days into one row. Six weeks is where the employer's sick pay ends and the insurer's sickness benefit begins (§ 3 EntgFG). Notes of up to three days are counted incompletely.
Source: Techniker Krankenkasse; Thomas Grobe & Sven Bessel, aQua-Institut, 2026
DAK: 2.4 million members. Survey: 7,068 employees asked online by forsa in 2024, weighted to be representative, set beside DAK's survey of 2015. The 60:40 split is IGES's estimate for one diagnosis, J06, averaged over 2023.
Source: DAK-Gesundheit; Susanne Hildebrandt, Terese Dehl & Hans-Dieter Nolting, IGES Institut, 2025
Shares of the 3,950–4,261 who had worked sick; several reasons could apply. A bonus for no sick days moved 1.6%. 92.2% of all respondents never stayed away without good reason. Burnout is in No. 29, mental health in No. 75.
Source: DAK-Gesundheit; Susanne Hildebrandt, Terese Dehl & Hans-Dieter Nolting, IGES Institut, 2025
The whole text Read the issue as text For reading on a small screen, searching or a screen reader. The same words, without the page design.
In this issue
Sickness absence is one of the few people figures every company has, and it is often read as a sign of morale or discipline. This issue asks what the number actually counts, how Germany counts it, why it jumped in 2022, and what it leaves out.
Destatis puts sick leave at 11.2 working days per employee in 2021 and 14.8 in 2022, the year the sick note began to travel electronically from the doctor to the insurer. The insurers count in other units, so their figures differ. In TK's data, 3.6% of sick notes made 45.7% of the days. DAK's analysis traces much of the jump to more complete counting. And 62.5% of employees surveyed had worked while sick.
Stiven Janaqi, Editor
Cover story
The jump of 2022
For years employees in Germany were off sick for around 10 to 11 working days a year. In 2022 the figure rose to 14.8. That year the paper sick note began to give way: from January, practices switched one by one to sending it to the health insurer electronically.
Working days of sick leave per employee, Germany (Destatis, 2026): 2017 10.6, 2018 10.6, 2019 10.9, 2020 11.2, 2021 11.2, 2022 14.8, 2023 15.2, 2024 14.8, 2025 14.6.
Before, employees sent the insurer its copy themselves. Asked in DAK's survey of 2024, 57.5% said they always had, 12.5% sometimes, 16.3% never. Destatis attributes the rise since 2021 partly to the electronic note, which records short absences more fully.
Our reading
When the way of counting changes, the number moves even if nobody is sicker. Compare the years since 2022 with each other.
Destatis, days lost per employee, from the IAB's working-time accounts; by its account only absences over three days are counted, so the true figure is likely higher. A note is due after three calendar days, or sooner if the employer asks (§ 5 EntgFG).
Sources: Statistisches Bundesamt (Destatis), nach der Arbeitszeitrechnung des IAB, 2026; Bundesministerium der Justiz, gesetze-im-internet.de, 1994; DAK-Gesundheit; Susanne Hildebrandt, Terese Dehl & Hans-Dieter Nolting, IGES Institut, 2025
The numbers
Three sources, three numbers
Each source counts in its own way: working days or calendar days, employees or all insured people, every day of the year or one day a month. The figures cannot be set side by side without saying which.
- Destatis: 14.6 days (2025). working days lost per employee, from the IAB's working-time accounts
- TK: 18.5 days, 5.08% (2025). calendar days per insured year; members in work or on unemployment benefit; standardised by age and sex
- DAK: 5.4% (2024). the share off sick on an average calendar day: 1,967.4 days per 100 insured years over 366 days
TK's rate for 2025, counted two ways (2026): Every day of the year 5.08%, First of each month 4.54%.
Our reading
A higher figure from an insurer does not mean more sickness. Often it is another unit.
The health ministry's monthly statistic counts on the first of each month. TK recomputed its own data that way; in 2025 many of those days fell on weekends, holidays or days with low sickness, so the method came out low.
Sources: Statistisches Bundesamt (Destatis), nach der Arbeitszeitrechnung des IAB, 2026; Techniker Krankenkasse; Thomas Grobe & Sven Bessel, aQua-Institut, 2026; DAK-Gesundheit; Susanne Hildebrandt, Terese Dehl & Hans-Dieter Nolting, IGES Institut, 2025
The model
Few long cases, most of the days
The rate is the number of sick notes times their average length, spread over the days of the year. Two teams can share the same rate, one with many short absences and one with a few long ones.
Sick notes by length, TK members, 2025 (2026): 1 to 3 days: Share of sick notes 40.0%, Share of days 7.4%; 4 to 7 days: Share of sick notes 32.3%, Share of days 14.5%; 8 to 14 days: Share of sick notes 15.4%, Share of days 14.0%; 15 to 42 days: Share of sick notes 8.8%, Share of days 18.4%; More than 6 weeks: Share of sick notes 3.6%, Share of days 45.7%.
Our reading
Short absences disrupt the shift; long ones make the rate. They call for different answers: cover for the first, a way back to work for the second.
TK raw figures; the editors added 15–28 and 29–42 days into one row. Six weeks is where the employer's sick pay ends and the insurer's sickness benefit begins (§ 3 EntgFG). Notes of up to three days are counted incompletely.
Sources: Techniker Krankenkasse; Thomas Grobe & Sven Bessel, aQua-Institut, 2026; Bundesministerium der Justiz, gesetze-im-internet.de, 1994; Statistisches Bundesamt (Destatis), nach der Arbeitszeitrechnung des IAB, 2026
What the research says
What the jump was made of
For its 2025 report DAK-Gesundheit had the IGES Institute take the jump apart. Its rate rose from 4.0% in 2021 to 5.5% in 2022. Of the extra sick notes, 94% lasted up to 14 days; they made 80% of the extra days.
Employees with at least one sick report in a year: what they say and what the insurer saw (2025): Say they reported sick (survey): 2015 69.7%, 2024 69.9%; Sick note on file at DAK (insurer data): 2015 50.4%, 2024 63.6%.
Colds (J06) made 35% of the extra days. Doctors did treat more of them: 20.1% of insured employees in late 2023, 9.7% in late 2019. That predicts notes for 8.8%; DAK received them for 13.8%. IGES puts 60% of that rise down to the electronic note, 40% to more treatment.
Our reading
What employees say barely moved; what the insurer saw rose by 13 points. Much of the new sickness is old sickness, now counted.
DAK: 2.4 million members. Survey: 7,068 employees asked online by forsa in 2024, weighted to be representative, set beside DAK's survey of 2015. The 60:40 split is IGES's estimate for one diagnosis, J06, averaged over 2023.
Source: DAK-Gesundheit; Susanne Hildebrandt, Terese Dehl & Hans-Dieter Nolting, IGES Institut, 2025
What the rate hides
Present, but sick
A low rate can also mean that people come in sick. In DAK's 2024 survey, 62.5% of employees had worked at least once in the past year when they should have reported sick, at the workplace or from home; in 2015, 67.5%.
Reasons given by those who worked sick, 2024 (2025): I did not want to let colleagues down 70.2%, I had to get my work finished 48.4%, Customers or patients would suffer 36.5%, Working from home made it possible 35.5%, I feared disadvantages 14.6%.
Our reading
The most common reason is loyalty to colleagues. Where there is no cover, coming in sick is how people protect the team.
Shares of the 3,950–4,261 who had worked sick; several reasons could apply. A bonus for no sick days moved 1.6%. 92.2% of all respondents never stayed away without good reason. Burnout is in No. 29, mental health in No. 75.
Source: DAK-Gesundheit; Susanne Hildebrandt, Terese Dehl & Hans-Dieter Nolting, IGES Institut, 2025
Tool of the issue
The absence card
One card for reading the team's absence each month. The Shift Capacity tool takes an absence allowance when it works out the heads each shift needs, so the absence you expect is planned rather than absorbed.
- What is counted working or calendar days; who is in the base; notes only, or every absence
- How o
f ten, how long number of absences and average length, separately - Long cases apa
r t over six weeks: who supports the return - Same month last year colds peak in winter; compare like with like, never one day
- Worked sick ask the team, anonymously: who came in or logged on ill, and why
- What we change cover, workload, the absence allowance in the plan
The card is the editors' proposal, built on the definitions of Destatis, TK and DAK and on DAK's survey; it uses the team's figures, never a person's diagnosis. The essay linked below sets out the author's card for any KPI.
Sources: Statistisches Bundesamt (Destatis), nach der Arbeitszeitrechnung des IAB, 2026; Techniker Krankenkasse; Thomas Grobe & Sven Bessel, aQua-Institut, 2026; DAK-Gesundheit; Susanne Hildebrandt, Terese Dehl & Hans-Dieter Nolting, IGES Institut, 2025
More in the essay: KPIs the team trusts
Open the tool: Shift Capacity
Sources and method
Every figure has a source.
The figures in this issue come from the sources below. The year shows how recent each one is.
- Statistisches Bundesamt (Destatis), nach der Arbeitszeitrechnung des IAB, “Indikatoren zur Qualität der Arbeit: Krankenstand”, 2026. https://www.destatis.de/DE/Themen/Arbeit/Arbeitsmarkt/Indikatoren-Qualitaet-Arbeit/Dimension-2/krankenstand.html
- Bundesministerium der Justiz, gesetze-im-internet.de, “Entgeltfortzahlungsgesetz (EntgFG), § 3 Anspruch auf Entgeltfortzahlung im Krankheitsfall und § 5 Anzeige- und Nachweispflichten”, 1994. https://www.gesetze-im-internet.de/entgfg/
- Techniker Krankenkasse; Thomas Grobe & Sven Bessel, aQua-Institut, “Gesundheitsreport 2026: Arbeitsunfähigkeiten”, 2026. https://www.tk.de/resource/blob/2214302/78df7e278b4eb9519cf89ef483ecb8a7/gesundheitsreport-au-2026-data.pdf
- DAK-Gesundheit; Susanne Hildebrandt, Terese Dehl & Hans-Dieter Nolting, IGES Institut, “Gesundheitsreport 2025: Analyse der Arbeitsunfähigkeiten. Mythos Rekordkrankenstand. Generation Z in der Arbeitswelt”, 2025. https://caas.content.dak.de/caas/v1/media/142382/data/8f878876acd7ba6e3076622bcc006219/gesundheitsreport2025-ebook.pdf
Edit orial me thod
Each figure was checked for its year, its publisher and what it measures, in the full text where it could be opened. A source read only in a summary, an abstract or excerpts is marked “via”. A figure not confirmed in what was read is marked so on its page, or left out. The editor's interpretation is marked “Our reading”.
Edited by Stiven Janaqi, who answers for it; “the editors” in this publication means him. Its texts, translations, layout and the checking of figures against their sources are done in working sessions with Claude, an AI model by Anthropic. How this is made
Management Review · Monthly edition