Two laboratory studies matched hours awake against measured doses of alcohol: around 17 hours awake looked like 0.05%, around 24 hours like 0.10%. In 2,737 US interns, fatigue-related errors were reported in 3.8% of months without 24-hour shifts and in 16% of months with five or more. A trial found 36% more serious errors on the schedule with those shifts. On the road, drivers with 4 to 5 hours' sleep had 4.3 times the crash rate. Three counts and a card close the issue.
Management Review · Third series · November 2026 · No. 89
Hours awake: the tired shif t
What 17 and 24 hours awake did to performance in the laboratory, how errors rose with the number of 24-hour shifts, what changed when the long shifts went, why sleep in the last 24 hours matters, and a card for the roster.
- No.
- 89
- Pages
- 10
- Sources
- 6
- Topics
- People
- Online since
- 1 November 2026
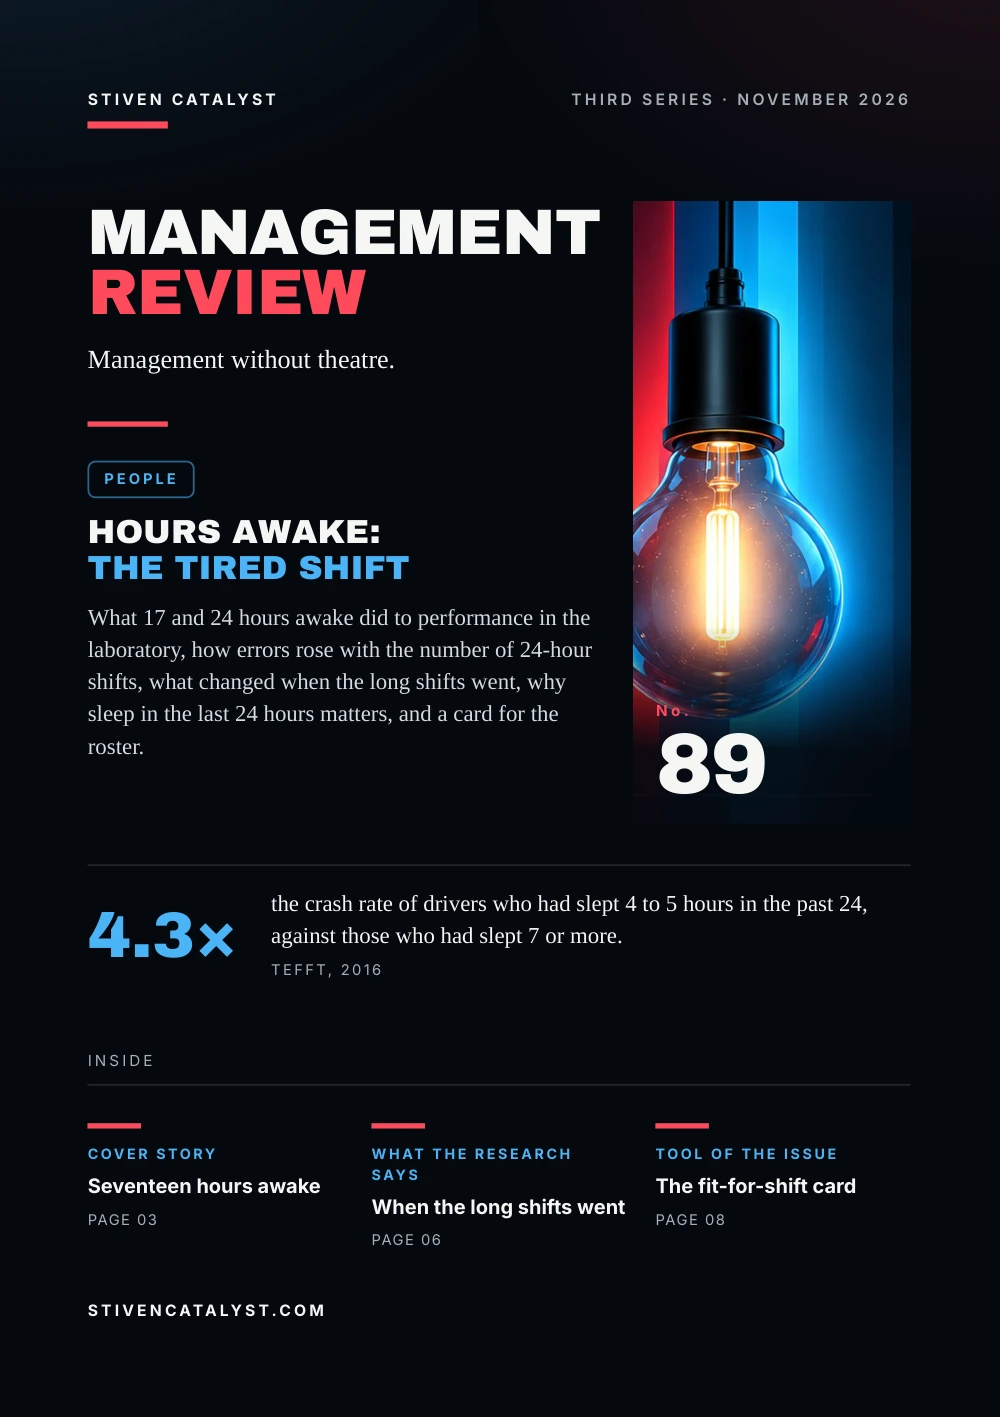
Stiven CatalystThird series · November 2026
ManagementReview
Management without theatre.
People
Hours awake:the tired shift
What 17 and 24 hours awake did to performance in the laboratory, how errors rose with the number of 24-hour shifts, what changed when the long shifts went, why sleep in the last 24 hours matters, and a card for the roster.

No.89
4.3×
the crash rate of drivers who had slept 4 to 5 hours in the past 24, against those who had slept 7 or more.Tefft, 2016
stivencatalyst.com
No. 89 · People
In this issue
A roster counts hours on duty. It rarely counts how long a person has been awake when the hardest task of the shift arrives. This issue asks what the research says about that second number, and how a manager can see it before the shift starts.
- 03Cover storySeventeen hours awake
- 04The numbersMonth by month
- 05The modelThree clocks in one shift
- 06What the research saysWhen the long shifts went
- 07How it is measuredCount the sleep, not only the hours
- 08Tool of the issueThe fit-for-shift card
- 09SourcesSources and method
How to read this issue
Figure
Every figure has its source and year at the foot of its page.
Our reading
Where the editor interprets rather than the research, it says so.
Practice
The steps and the card are proposals to try, not research results.
Cover story
Seventeenhours awake
In 1997 Drew Dawson and Kathryn Reid in Adelaide set out to put a familiar measure on fatigue. They compared performance on a hand-eye coordination test after a long time awake with performance on the same test after drinking alcohol.
Hours awake and the blood alcohol level with similar performance (1997)
Williamson and Feyer repeated the comparison in 2000 with 39 people, 30 from the transport industry and nine from the army, kept awake for 28 hours. After 17 to 19 hours, between 22:30 and 01:00, some tests were as bad as at 0.05% or worse; responses were up to 50% slower.
Our reading
Someone who woke at 6:00 reaches hour 17 at 23:00. On a double shift, that is the middle of the work, not the end.
Sources: Drew Dawson & Kathryn Reid, Nature 388, 1997 (via the abstract, Tefft (2016) and Barger et al. (2006)); A. M. Williamson & A.-M. Feyer, Occupational and Environmental Medicine 57(10), 2000 (via the abstract at PubMed Central)
Neither paper could be opened in full. Dawson & Reid's figures as Tefft (2016) and Barger et al. (2006) report them; Williamson & Feyer's from their abstract. The bars show the alcohol level matched, not a risk.
The numbers
Month bymonth
Laura Barger and colleagues at Harvard followed 2,737 first-year doctors across the US in 2002–2003. Each month the interns reported their hours, their shifts of 24 hours or more, and any significant medical error. Each intern was compared with himself or herself.
Months with at least one fatigue-related significant error (2006)
0.2% → 1.6%of months with a fatigue-related error that harmed a patient, from no to 5+ long shifts
70%of months with 5+ long shifts had a report of falling asleep in lectures; 46% with none
Our reading
The errors the interns blamed on fatigue rose with the long shifts. The errors they blamed on other causes rose far less.
Source: Laura K. Barger et al., PLoS Medicine 3(12), 2006
Self-reports, 17,003 monthly surveys; the question named fatigue, which may inflate the link. Bars are shares of intern-months. Read in the full text.
The model
Three clocksin one shif t
The studies in this issue measure fatigue in three ways. Each is a clock a roster can read, and none of them is the number of hours on the timesheet.
01
Hours awake
from waking, not from clocking in; 17 to 19 hours matched 0.05% on some tests
02
Sleep in the last 24
below 7 hours, the crash rate rose step by step; 4 to 5 hours, 4.3 times
03
Long shifts in a month
1 to 4 and 5+ shifts of 24 hours: odds of a fatigue-related error 3.5 and 7.5 times
The clocks add up. A long shift raises the hours awake and cuts the sleep before the next one. The clock of the day matters too: in Williamson & Feyer, hours 17 to 19 fell between 22:30 and 01:00, and Tefft notes that the effects of lost sleep are greatest in the early morning, the hours his data left out.
Our reading
A roster that is legal on hours can still put a person at hour 20 for the hardest task of the night.
Sources: A. M. Williamson & A.-M. Feyer, Occupational and Environmental Medicine 57(10), 2000 (via the abstract at PubMed Central); Brian C. Tefft, AAA Foundation for Traffic Safety, 2016; Laura K. Barger et al., PLoS Medicine 3(12), 2006
The three clocks are the editors' grouping of the measures used by Williamson & Feyer (2000), Tefft (2016) and Barger et al. (2006). Roster rules, rest and rotation are in No. 45, burnout in No. 29.
What the research says
When the longshif ts went
In intensive care units, interns worked three-week rotations on two schedules: the traditional one, with shifts of 24 hours or more every other shift, and one that capped shifts at 16 hours. Physicians who did not know the schedule rated every incident.
Serious errors by interns per 1,000 patient-days (2004)
On the long-shift schedule, interns made 35.9% more serious errors and 5.6 times as many serious diagnostic errors. A companion study of the same programme found that, with the cap, they worked 19.5 hours a week less, slept 5.8 hours a week more, and had less than half the attentional failures on night duty.
Our reading
The same people, in the same units, made fewer errors when the schedule changed. The fix was in the roster, not in the people.
Sources: C. P. Landrigan et al., New England Journal of Medicine 351(18), 2004 (via the abstract at PubMed and Barger et al. (2006)); S. W. Lockley et al., New England Journal of Medicine 351(18), 2004 (via the abstract at PubMed and Barger et al. (2006)); Laura K. Barger et al., PLoS Medicine 3(12), 2006
Landrigan et al. and Lockley et al. (2004), from their abstracts; the NEJM full texts could not be opened. Barger et al. (2006) confirm the 36% and the doubled failures. 2,203 patient-days, 634 admissions; 20 interns.
How it is measured
Count the sleep,not only the hours
Brian Tefft of the AAA Foundation used US crash investigations of 2005–2007 that asked drivers how long they had slept in the past 24 hours. He compared 7,234 drivers in 4,571 crashes: those who caused the crash against those who did not.
Crash rate against 7+ hours of sleep in the past 24 hours (2016)
Hours awake at the end
from the usual waking time to the end of the shift, overtime included
Rest before the shift
the time between shifts, which caps the sleep that fits
Long shifts this month
doubles and 24-hour stretches, per person
Source: Brian C. Tefft, AAA Foundation for Traffic Safety, 2016
Against drivers with 7+ hours, adjusted for age, hour, location and changed sleep. Under 4 hours: 80 drivers, 95% CI 2.9–45.7. No crashes from midnight to 6:00. The three counts are the editors' proposal.
Tool of the issue
The fit-for-shif tcard
One card per shift, filled in by the shift lead before the work starts. Long shifts often begin as a gap in the plan: the capacity tool shows the gap, the overtime and the cover before the day arrives.
01Shift and teamdate, hours, who is on, who is covering a gap
02Longest daywho will have been awake longest at the end, and how long
03Short restwho comes from a double, a late finish or a night
04The hardest taskwhen it falls, and whether it can move earlier or to someone rested
05Second checkwhich steps get a second pair of eyes after midnight
06Decisionwhat changes today; what goes into the next roster
Sources: A. M. Williamson & A.-M. Feyer, Occupational and Environmental Medicine 57(10), 2000 (via the abstract at PubMed Central); Laura K. Barger et al., PLoS Medicine 3(12), 2006; Brian C. Tefft, AAA Foundation for Traffic Safety, 2016
The card is the editors' proposal, built on the three clocks of this issue; it is a planning aid, not a medical or legal test of fitness for work.
Open the tool: Shift Capacitystivencatalyst.com/tools/shift-capacity/
Sources and method
Every figurehas a source.
The figures in this issue come from the sources below. The year shows how recent each one is.
- Fatigue, alcohol and performance impairmentDrew Dawson & Kathryn Reid, Nature 388, 1997 · via the abstract, Tefft (2016) and Barger et al. (2006)https://doi.org/10.1038/40775
- Moderate sleep deprivation produces impairments in cognitive and motor performance equivalent to legally prescribed levels of alcohol intoxicationA. M. Williamson & A.-M. Feyer, Occupational and Environmental Medicine 57(10), 2000 · via the abstract at PubMed Centralhttps://doi.org/10.1136/oem.57.10.649
- Impact of Extended-Duration Shifts on Medical Errors, Adverse Events, and Attentional FailuresLaura K. Barger et al., PLoS Medicine 3(12), 2006https://doi.org/10.1371/journal.pmed.0030487
- Effect of Reducing Interns' Work Hours on Serious Medical Errors in Intensive Care UnitsC. P. Landrigan et al., New England Journal of Medicine 351(18), 2004 · via the abstract at PubMed and Barger et al. (2006)https://doi.org/10.1056/NEJMoa041406
- Effect of Reducing Interns' Weekly Work Hours on Sleep and Attentional FailuresS. W. Lockley et al., New England Journal of Medicine 351(18), 2004 · via the abstract at PubMed and Barger et al. (2006)https://doi.org/10.1056/NEJMoa041404
- Acute Sleep Deprivation and Risk of Motor Vehicle Crash InvolvementBrian C. Tefft, AAA Foundation for Traffic Safety, 2016https://aaafoundation.org/acute-sleep-deprivation-risk-motor-vehicle-crash-involvement/
Editorial method
Each figure was checked for its year, its publisher and what it measures, in the full text where it could be opened. A source read only in a summary, an abstract or excerpts is marked “via”. A figure not confirmed in what was read is marked so on its page, or left out. The editor's interpretation is marked “Our reading”.
ManagementReview
Management without theatre.
Every issue, one management question, checked against the best research.
All issues
stivencatalyst.com/magazine/management-review.html
Management Review · No. 89 · November 2026 · Stiven Catalyst
Edited by Stiven Janaqi, who answers for it; “the editors” in this publication means him. Its texts, translations, layout and the checking of figures against their sources are done in working sessions with Claude, an AI model by Anthropic.
stivencatalyst.com/how-this-is-made.html
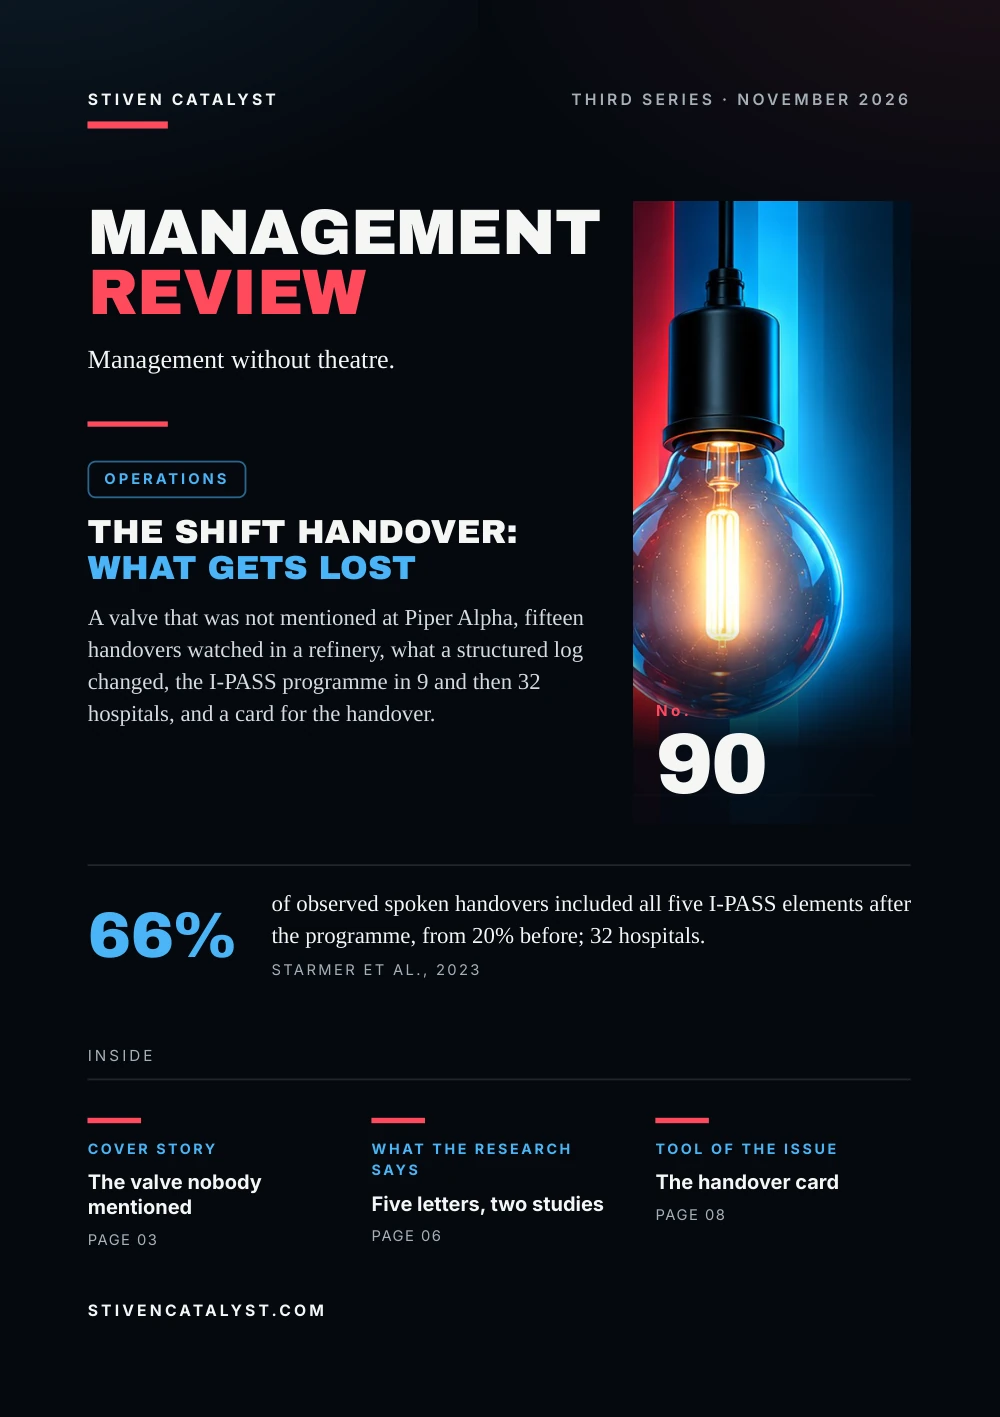 Next issue
The shift handover: what gets lost
Click or swipe a page to turn it. The arrow keys work too.
Management Review · No. 89
The figures of the issue
The charts of the printed pages, with their sources.
Neither paper could be opened in full. Dawson & Reid's figures as Tefft (2016) and Barger et al. (2006) report them; Williamson & Feyer's from their abstract. The bars show the alcohol level matched, not a risk.
Source: Drew Dawson & Kathryn Reid, Nature 388, 1997 (via the abstract, Tefft (2016) and Barger et al. (2006))
Self-reports, 17,003 monthly surveys; the question named fatigue, which may inflate the link. Bars are shares of intern-months. Read in the full text.
Source: Laura K. Barger et al., PLoS Medicine 3(12), 2006
Landrigan et al. and Lockley et al. (2004), from their abstracts; the NEJM full texts could not be opened. Barger et al. (2006) confirm the 36% and the doubled failures. 2,203 patient-days, 634 admissions; 20 interns.
Source: C. P. Landrigan et al., New England Journal of Medicine 351(18), 2004 (via the abstract at PubMed and Barger et al. (2006))
Against drivers with 7+ hours, adjusted for age, hour, location and changed sleep. Under 4 hours: 80 drivers, 95% CI 2.9–45.7. No crashes from midnight to 6:00. The three counts are the editors' proposal.
Source: Brian C. Tefft, AAA Foundation for Traffic Safety, 2016
The whole text Read the issue as text For reading on a small screen, searching or a screen reader. The same words, without the page design.
In this issue
A roster counts hours on duty. It rarely counts how long a person has been awake when the hardest task of the shift arrives. This issue asks what the research says about that second number, and how a manager can see it before the shift starts.
Two laboratory studies matched hours awake against measured doses of alcohol: around 17 hours awake looked like 0.05%, around 24 hours like 0.10%. In 2,737 US interns, fatigue-related errors were reported in 3.8% of months without 24-hour shifts and in 16% of months with five or more. A trial found 36% more serious errors on the schedule with those shifts. On the road, drivers with 4 to 5 hours' sleep had 4.3 times the crash rate. Three counts and a card close the issue.
Stiven Janaqi, Editor
Cover story
Seventeen hours awake
In 1997 Drew Dawson and Kathryn Reid in Adelaide set out to put a familiar measure on fatigue. They compared performance on a hand-eye coordination test after a long time awake with performance on the same test after drinking alcohol.
Hours awake and the blood alcohol level with similar performance (1997): 17 hours awake 0.05%, 24 hours awake 0.10%.
Williamson and Feyer repeated the comparison in 2000 with 39 people, 30 from the transport industry and nine from the army, kept awake for 28 hours. After 17 to 19 hours, between 22:30 and 01:00, some tests were as bad as at 0.05% or worse; responses were up to 50% slower.
Our reading
Someone who woke at 6:00 reaches hour 17 at 23:00. On a double shift, that is the middle of the work, not the end.
Neither paper could be opened in full. Dawson & Reid's figures as Tefft (2016) and Barger et al. (2006) report them; Williamson & Feyer's from their abstract. The bars show the alcohol level matched, not a risk.
Sources: Drew Dawson & Kathryn Reid, Nature 388, 1997 (via the abstract, Tefft (2016) and Barger et al. (2006)); A. M. Williamson & A.-M. Feyer, Occupational and Environmental Medicine 57(10), 2000 (via the abstract at PubMed Central)
The numbers
Month by month
Laura Barger and colleagues at Harvard followed 2,737 first-year doctors across the US in 2002–2003. Each month the interns reported their hours, their shifts of 24 hours or more, and any significant medical error. Each intern was compared with himself or herself.
Months with at least one fatigue-related significant error (2006): No 24-hour shifts 3.8%, 1 to 4 such shifts 9.8%, 5 or more 16%.
- 0.2% → 1.6% of months with a fatigue-related error that harmed a patient, from no to 5+ long shifts
- 70% of months with 5+ long shifts had a report of falling asleep in lectures; 46% with none
Our reading
The errors the interns blamed on fatigue rose with the long shifts. The errors they blamed on other causes rose far less.
Self-reports, 17,003 monthly surveys; the question named fatigue, which may inflate the link. Bars are shares of intern-months. Read in the full text.
Source: Laura K. Barger et al., PLoS Medicine 3(12), 2006
The model
Three clocks in one shif t
The studies in this issue measure fatigue in three ways. Each is a clock a roster can read, and none of them is the number of hours on the timesheet.
- Hours awake. from waking, not from clocking in; 17 to 19 hours matched 0.05% on some tests
- Sleep in the last 24. below 7 hours, the crash rate rose step by step; 4 to 5 hours, 4.3 times
- Long shi
f ts in a month. 1 to 4 and 5+ shifts of 24 hours: odds of a fatigue-related error 3.5 and 7.5 times
The clocks add up. A long shift raises the hours awake and cuts the sleep before the next one. The clock of the day matters too: in Williamson & Feyer, hours 17 to 19 fell between 22:30 and 01:00, and Tefft notes that the effects of lost sleep are greatest in the early morning, the hours his data left out.
Our reading
A roster that is legal on hours can still put a person at hour 20 for the hardest task of the night.
The three clocks are the editors' grouping of the measures used by Williamson & Feyer (2000), Tefft (2016) and Barger et al. (2006). Roster rules, rest and rotation are in No. 45, burnout in No. 29.
Sources: A. M. Williamson & A.-M. Feyer, Occupational and Environmental Medicine 57(10), 2000 (via the abstract at PubMed Central); Brian C. Tefft, AAA Foundation for Traffic Safety, 2016; Laura K. Barger et al., PLoS Medicine 3(12), 2006
What the research says
When the long shif ts went
In intensive care units, interns worked three-week rotations on two schedules: the traditional one, with shifts of 24 hours or more every other shift, and one that capped shifts at 16 hours. Physicians who did not know the schedule rated every incident.
Serious errors by interns per 1,000 patient-days (2004): All serious errors: 16-hour cap 100.1, 24-hour shifts 136.0; Serious medication errors: 16-hour cap 82.5, 24-hour shifts 99.7; Serious diagnostic errors: 16-hour cap 3.3, 24-hour shifts 18.6.
On the long-shift schedule, interns made 35.9% more serious errors and 5.6 times as many serious diagnostic errors. A companion study of the same programme found that, with the cap, they worked 19.5 hours a week less, slept 5.8 hours a week more, and had less than half the attentional failures on night duty.
Our reading
The same people, in the same units, made fewer errors when the schedule changed. The fix was in the roster, not in the people.
Landrigan et al. and Lockley et al. (2004), from their abstracts; the NEJM full texts could not be opened. Barger et al. (2006) confirm the 36% and the doubled failures. 2,203 patient-days, 634 admissions; 20 interns.
Sources: C. P. Landrigan et al., New England Journal of Medicine 351(18), 2004 (via the abstract at PubMed and Barger et al. (2006)); S. W. Lockley et al., New England Journal of Medicine 351(18), 2004 (via the abstract at PubMed and Barger et al. (2006)); Laura K. Barger et al., PLoS Medicine 3(12), 2006
How it is measured
Count the sleep, not only the hours
Brian Tefft of the AAA Foundation used US crash investigations of 2005–2007 that asked drivers how long they had slept in the past 24 hours. He compared 7,234 drivers in 4,571 crashes: those who caused the crash against those who did not.
Crash rate against 7+ hours of sleep in the past 24 hours (2016): 6 to 7 hours 1.3×, 5 to 6 hours 1.9×, 4 to 5 hours 4.3×, Under 4 hours 11.5×.
- Hours awake at the end. from the usual waking time to the end of the shift, overtime included
- Rest before the shi
f t. the time between shifts, which caps the sleep that fits - Long shi
f ts this month. doubles and 24-hour stretches, per person
Against drivers with 7+ hours, adjusted for age, hour, location and changed sleep. Under 4 hours: 80 drivers, 95% CI 2.9–45.7. No crashes from midnight to 6:00. The three counts are the editors' proposal.
Source: Brian C. Tefft, AAA Foundation for Traffic Safety, 2016
Tool of the issue
The fit-for-shif t card
One card per shift, filled in by the shift lead before the work starts. Long shifts often begin as a gap in the plan: the capacity tool shows the gap, the overtime and the cover before the day arrives.
- Shi
f t and team date, hours, who is on, who is covering a gap - Longest day who will have been awake longest at the end, and how long
- Sho
r t rest who comes from a double, a late finish or a night - The hardest task when it falls, and whether it can move earlier or to someone rested
- Second check which steps get a second pair of eyes after midnight
- Decision what changes today; what goes into the next roster
The card is the editors' proposal, built on the three clocks of this issue; it is a planning aid, not a medical or legal test of fitness for work.
Sources: A. M. Williamson & A.-M. Feyer, Occupational and Environmental Medicine 57(10), 2000 (via the abstract at PubMed Central); Laura K. Barger et al., PLoS Medicine 3(12), 2006; Brian C. Tefft, AAA Foundation for Traffic Safety, 2016
Open the tool: Shift Capacity
Sources and method
Every figure has a source.
The figures in this issue come from the sources below. The year shows how recent each one is.
- Drew Dawson & Kathryn Reid, Nature 388, “Fatigue, alcohol and performance impairment”, 1997 (via the abstract, Tefft (2016) and Barger et al. (2006)). https://doi.org/10.1038/40775
- A. M. Williamson & A.-M. Feyer, Occupational and Environmental Medicine 57(10), “Moderate sleep deprivation produces impairments in cognitive and motor performance equivalent to legally prescribed levels of alcohol intoxication”, 2000 (via the abstract at PubMed Central). https://doi.org/10.1136/oem.57.10.649
- Laura K. Barger et al., PLoS Medicine 3(12), “Impact of Extended-Duration Shifts on Medical Errors, Adverse Events, and Attentional Failures”, 2006. https://doi.org/10.1371/journal.pmed.0030487
- C. P. Landrigan et al., New England Journal of Medicine 351(18), “Effect of Reducing Interns' Work Hours on Serious Medical Errors in Intensive Care Units”, 2004 (via the abstract at PubMed and Barger et al. (2006)). https://doi.org/10.1056/NEJMoa041406
- S. W. Lockley et al., New England Journal of Medicine 351(18), “Effect of Reducing Interns' Weekly Work Hours on Sleep and Attentional Failures”, 2004 (via the abstract at PubMed and Barger et al. (2006)). https://doi.org/10.1056/NEJMoa041404
- Brian C. Tefft, AAA Foundation for Traffic Safety, “Acute Sleep Deprivation and Risk of Motor Vehicle Crash Involvement”, 2016. https://aaafoundation.org/acute-sleep-deprivation-risk-motor-vehicle-crash-involvement/
Edit orial me thod
Each figure was checked for its year, its publisher and what it measures, in the full text where it could be opened. A source read only in a summary, an abstract or excerpts is marked “via”. A figure not confirmed in what was read is marked so on its page, or left out. The editor's interpretation is marked “Our reading”.
Edited by Stiven Janaqi, who answers for it; “the editors” in this publication means him. Its texts, translations, layout and the checking of figures against their sources are done in working sessions with Claude, an AI model by Anthropic. How this is made
Management Review · Monthly edition