In John Sterman's Beer Game, four players run a chain from shop to factory, and customer demand steps up once. Orders and stock still swung in every trial kept, and grew with each link. Lee, Padmanabhan and Whang showed that rational managers create the same pattern through forecasts, batches, promotions and shortages. Sterman's players added a human cause: they forgot what was already on order. Croson and Donohue took the other causes away, and the swing stayed; shared stock data helped most upstream. A ratio and a card measure the swing at one link.
Management Review · Third series · November 2026 · No. 88
The bullwhip effect: small waves, big swings
A board game where demand changes once, how the swing grows link by link, four rational causes and a human one, what shared stock data does, how to measure the swing, and a card.
- No.
- 88
- Pages
- 10
- Sources
- 3
- Topics
- Strategy
- Online since
- 1 November 2026
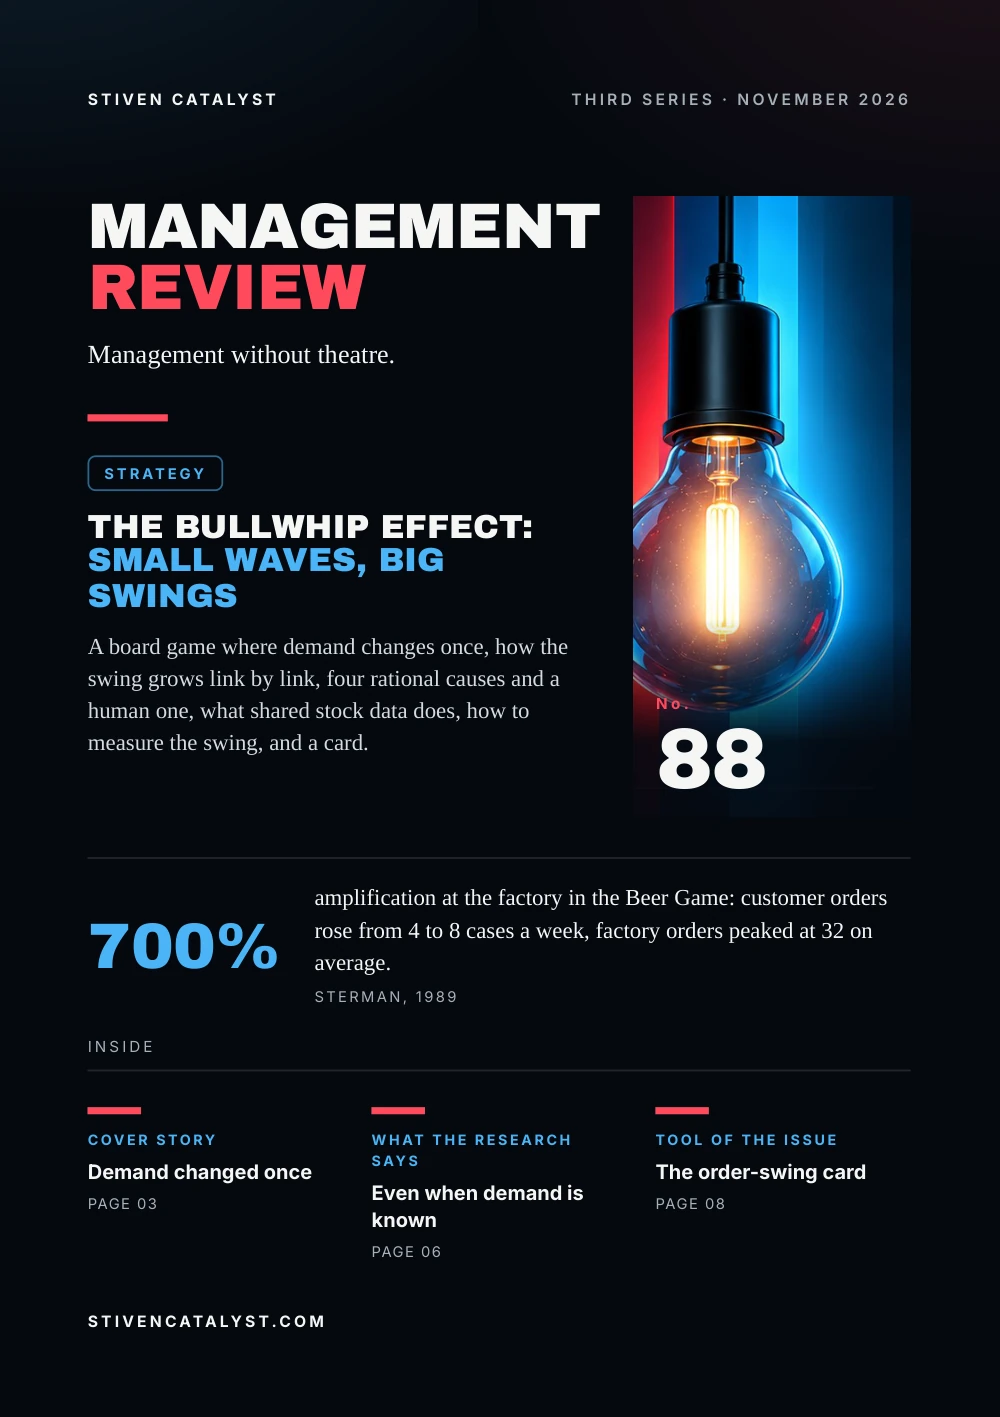
Stiven CatalystThird series · November 2026
ManagementReview
Management without theatre.
Strategy
The bullwhip effect:small waves, big swings
A board game where demand changes once, how the swing grows link by link, four rational causes and a human one, what shared stock data does, how to measure the swing, and a card.

No.88
700%
amplification at the factory in the Beer Game: customer orders rose from 4 to 8 cases a week, factory orders peaked at 32 on average.Sterman, 1989
stivencatalyst.com
No. 88 · Strategy
In this issue
A shop sells a little more, and weeks later the warehouse is short, the plant runs overtime, and then everyone sits on stock. Each link blames the one below. The pattern has a name, the bullwhip effect, and decades of research on where it comes from.
- 03Cover storyDemand changed once
- 04The numbersFurther from the customer, wilder
- 05The modelFour causes and a fifth
- 06What the research saysEven when demand is known
- 07How it is measuredOrders against demand
- 08Tool of the issueThe order-swing card
- 09SourcesSources and method
How to read this issue
Figure
Every figure has its source and year at the foot of its page.
Our reading
Where the editor interprets rather than the research, it says so.
Practice
The steps and the card are proposals to try, not research results.
Cover story
Demand changedonce
The Beer Distribution Game was developed at MIT to teach management. Four players run a retailer, a wholesaler, a distributor and a factory. Each week the only decision is how much to order, and an order takes at least four weeks to arrive. The goal is the lowest total cost for the team.
- Weeks 1–4Customers buy 4 cases a week; everyone holds 12 and orders 4.
- Week 5Demand rises to 8 and stays there. No one is told.
- Weeks 20–25The largest backlog, 35 cases on average.
- Weeks 25–30Stock peaks at 40 cases on average, and orders collapse.
Every one of the 11 trials analysed oscillated. Recovering the starting stock took 21 weeks on average, and team costs were about ten times a simulated benchmark. Asked afterwards to draw customer demand, most players drew a wave.
Our reading
The wave was made inside the chain. The players saw it outside, in the customer.
Source: John D. Sterman, Management Science 35(3), 1989
Sterman (1989): 11 trials (44 players) kept from 48 played over four years, by MIT students and executives; figures are averages of the 11. A board game, not company data.
The numbers
Fur ther fromthe cust omer, wilder
Sterman measured how the swing grew from link to link. Customer orders rose from 4 to 8 cases a week. By the time the change reached the factory, its orders peaked at 32 on average, more than twice the retailer's peak.
Peak orders, cases a week, Beer Game (1989)
The variance of orders grew the same way: 1.6 for the customer, 13 at the retailer, 72 at the factory. The peaks also came later upstream: week 16 at the retailer, week 20 at the factory.
Our reading
No one upstream sees the customer. Each link sees only the orders of the link below, and those already carry the swings of everyone in between.
Source: John D. Sterman, Management Science 35(3), 1989
Averages of the 11 trials (Sterman 1989, Table 3). Sterman's amplification compares the rise at the factory, 4 to 32, with the rise in demand, 4 to 8: 700%.
The model
Four causesand a fif th
Lee, Padmanabhan and Whang (1997) defined the effect: orders to the supplier vary more than sales to the buyer, and the distortion grows upstream. Their models show it arises even when every member orders rationally, from four causes.
Demand signal processing
A good week is read as a new forecast, and the order overshoots; long lead times make it worse.
Rationing game
When supply is short, buyers order more than they need to secure their share.
Order batching
Ordering costs and periodic reviews bunch many weeks into one order.
Price variations
Promotions bring buying forward, then a lull follows.
Sterman's players added a fifth: they underweighted the supply line, the goods ordered but not yet received. The mean weight they gave it was 0.34, where 1 would be right; only 5 of 44 counted more than two-thirds of it.
Our reading
Four causes sit in how the chain is built, the fifth in how people read it. A manager can work on both.
Sources: Hau L. Lee, V. Padmanabhan & Seungjin Whang, Management Science 43(4), 1997; John D. Sterman, Management Science 35(3), 1989
Causes as Lee et al. (1997) name them; calling Sterman's finding a fifth is the editors'. Forrester (1961) showed the effect in case studies, as Lee et al. note. S&OP is in No. 59, forecasting in No. 77.
More in the essayMistakes get lost between departments
What the research says
Even whendemand is known
Croson and Donohue (2006) removed the operational causes: no batching, no price changes, and demand known to all: any whole number from 0 to 8 cases, written on the board. 44 students played in 11 teams; 44 more saw all four stocks on screen.
Variance of orders by role, two experiments (2006)
Customer demand had a variance of 5.33; every role ordered with more. All 44 players in the first study gave less weight to goods on order than to goods in stock. With stock in view, the distributor's variance roughly halved; the retailer's hardly moved.
Our reading
Knowing demand did not stop the swing. Seeing the stock below helped the links furthest from the customer most.
Source: Rachel Croson & Karen Donohue, Management Science 52(3), 2006
Average variance of orders by role (Table 1), undergraduates in a lab, 2002. Five teams of logistics professionals showed the same pattern, less strongly.
How it is measured
Orders againstdemand
Both studies measure the effect the same way: the variance of the orders a link places, against the variance of the demand it receives. A ratio above 1 means the link amplifies.
Same weeks
Demand received and orders placed, for one item, over the same period.
Two variances
One for demand, one for orders, in the same units.
Divide
Orders over demand; repeat at each link where data exist.
Hypothetical example, one item over eight weeks
- Demand
- 36 to 44 a week, average 40, variance 8
- Orders
- 0, 40 or 80 a week, average 40, variance 1,200
- Ratio
- 1,200 ÷ 8 = 150
The same 40 a week reaches the supplier as a far noisier signal. The item and its figures are invented.
Sources: Hau L. Lee, V. Padmanabhan & Seungjin Whang, Management Science 43(4), 1997; Rachel Croson & Karen Donohue, Management Science 52(3), 2006
The steps and the example are the editors', on the definition of Lee et al. (1997) and the variances of Croson & Donohue (2006). Variances of the eight weeks, divided by 8.
Tool of the issue
The order-swingcard
One card per item and link, filled in with the person who places the orders. The inventory tool sorts items by how steady their demand is and sets reorder points from it.
01Item and linkwho orders from whom; the weeks compared
02The ratiovariance of orders ÷ variance of demand
03On order nowordered, not yet received; is it counted before the next order?
04Which causeforecast update, batching, promotion, shortage gaming, supply line ignored
05One change, and when we measure againe.g. share sales data, order smaller and more often, allocate by past sales
Sources: Hau L. Lee, V. Padmanabhan & Seungjin Whang, Management Science 43(4), 1997; John D. Sterman, Management Science 35(3), 1989
Our proposal, built on the causes and counter-measures in Lee et al. (1997) and the supply line in Sterman (1989).
Open the tool: ABC/XYZ Inventorystivencatalyst.com/tools/inventory-abc/
Sources and method
Every figurehas a source.
The figures in this issue come from the sources below. The year shows how recent each one is.
- Modeling Managerial Behavior: Misperceptions of Feedback in a Dynamic Decision Making ExperimentJohn D. Sterman, Management Science 35(3), 1989https://doi.org/10.1287/mnsc.35.3.321
- Information Distortion in a Supply Chain: The Bullwhip EffectHau L. Lee, V. Padmanabhan & Seungjin Whang, Management Science 43(4), 1997https://doi.org/10.1287/mnsc.43.4.546
- Behavioral Causes of the Bullwhip Effect and the Observed Value of Inventory InformationRachel Croson & Karen Donohue, Management Science 52(3), 2006https://doi.org/10.1287/mnsc.1050.0436
Editorial method
Each figure was checked for its year, its publisher and what it measures, in the full text where it could be opened. A source read only in a summary, an abstract or excerpts is marked “via”. A figure not confirmed in what was read is marked so on its page, or left out. The editor's interpretation is marked “Our reading”.
ManagementReview
Management without theatre.
Every issue, one management question, checked against the best research.
All issues
stivencatalyst.com/magazine/management-review.html
Management Review · No. 88 · November 2026 · Stiven Catalyst
Edited by Stiven Janaqi, who answers for it; “the editors” in this publication means him. Its texts, translations, layout and the checking of figures against their sources are done in working sessions with Claude, an AI model by Anthropic.
stivencatalyst.com/how-this-is-made.html
 Next issue
Hours awake: the tired shift
Click or swipe a page to turn it. The arrow keys work too.
Management Review · No. 88
The figures of the issue
The charts of the printed pages, with their sources.
Averages of the 11 trials (Sterman 1989, Table 3). Sterman's amplification compares the rise at the factory, 4 to 32, with the rise in demand, 4 to 8: 700%.
Source: John D. Sterman, Management Science 35(3), 1989
Average variance of orders by role (Table 1), undergraduates in a lab, 2002. Five teams of logistics professionals showed the same pattern, less strongly.
Source: Rachel Croson & Karen Donohue, Management Science 52(3), 2006
The whole text Read the issue as text For reading on a small screen, searching or a screen reader. The same words, without the page design.
In this issue
A shop sells a little more, and weeks later the warehouse is short, the plant runs overtime, and then everyone sits on stock. Each link blames the one below. The pattern has a name, the bullwhip effect, and decades of research on where it comes from.
In John Sterman's Beer Game, four players run a chain from shop to factory, and customer demand steps up once. Orders and stock still swung in every trial kept, and grew with each link. Lee, Padmanabhan and Whang showed that rational managers create the same pattern through forecasts, batches, promotions and shortages. Sterman's players added a human cause: they forgot what was already on order. Croson and Donohue took the other causes away, and the swing stayed; shared stock data helped most upstream. A ratio and a card measure the swing at one link.
Stiven Janaqi, Editor
Cover story
Demand changed once
The Beer Distribution Game was developed at MIT to teach management. Four players run a retailer, a wholesaler, a distributor and a factory. Each week the only decision is how much to order, and an order takes at least four weeks to arrive. The goal is the lowest total cost for the team.
- Weeks 1–4 Customers buy 4 cases a week; everyone holds 12 and orders 4.
- Week 5 Demand rises to 8 and stays there. No one is told.
- Weeks 20–25 The largest backlog, 35 cases on average.
- Weeks 25–30 Stock peaks at 40 cases on average, and orders collapse.
Every one of the 11 trials analysed oscillated. Recovering the starting stock took 21 weeks on average, and team costs were about ten times a simulated benchmark. Asked afterwards to draw customer demand, most players drew a wave.
Our reading
The wave was made inside the chain. The players saw it outside, in the customer.
Sterman (1989): 11 trials (44 players) kept from 48 played over four years, by MIT students and executives; figures are averages of the 11. A board game, not company data.
Source: John D. Sterman, Management Science 35(3), 1989
The numbers
Fur ther from the cust omer, wilder
Sterman measured how the swing grew from link to link. Customer orders rose from 4 to 8 cases a week. By the time the change reached the factory, its orders peaked at 32 on average, more than twice the retailer's peak.
Peak orders, cases a week, Beer Game (1989): Customer 8, Retailer 15, Wholesaler 19, Distributor 27, Factory 32.
The variance of orders grew the same way: 1.6 for the customer, 13 at the retailer, 72 at the factory. The peaks also came later upstream: week 16 at the retailer, week 20 at the factory.
Our reading
No one upstream sees the customer. Each link sees only the orders of the link below, and those already carry the swings of everyone in between.
Averages of the 11 trials (Sterman 1989, Table 3). Sterman's amplification compares the rise at the factory, 4 to 32, with the rise in demand, 4 to 8: 700%.
Source: John D. Sterman, Management Science 35(3), 1989
The model
Four causes and a fif th
Lee, Padmanabhan and Whang (1997) defined the effect: orders to the supplier vary more than sales to the buyer, and the distortion grows upstream. Their models show it arises even when every member orders rationally, from four causes.
- Demand signal processing. A good week is read as a new forecast, and the order overshoots; long lead times make it worse.
- Rationing game. When supply is short, buyers order more than they need to secure their share.
- Order ba
t ching. Ordering costs and periodic reviews bunch many weeks into one order. - Price variations. Promotions bring buying forward, then a lull follows.
Sterman's players added a fifth: they underweighted the supply line, the goods ordered but not yet received. The mean weight they gave it was 0.34, where 1 would be right; only 5 of 44 counted more than two-thirds of it.
Our reading
Four causes sit in how the chain is built, the fifth in how people read it. A manager can work on both.
Causes as Lee et al. (1997) name them; calling Sterman's finding a fifth is the editors'. Forrester (1961) showed the effect in case studies, as Lee et al. note. S&OP is in No. 59, forecasting in No. 77.
Sources: Hau L. Lee, V. Padmanabhan & Seungjin Whang, Management Science 43(4), 1997; John D. Sterman, Management Science 35(3), 1989
More in the essay: Mistakes get lost between departments
What the research says
Even when demand is known
Croson and Donohue (2006) removed the operational causes: no batching, no price changes, and demand known to all: any whole number from 0 to 8 cases, written on the board. 44 students played in 11 teams; 44 more saw all four stocks on screen.
Variance of orders by role, two experiments (2006): Retailer: Base case 10.7, Stock shown 10.1; Wholesaler: Base case 18.6, Stock shown 17.0; Distributor: Base case 47.8, Stock shown 23.2; Manufacturer: Base case 58.0, Stock shown 36.4.
Customer demand had a variance of 5.33; every role ordered with more. All 44 players in the first study gave less weight to goods on order than to goods in stock. With stock in view, the distributor's variance roughly halved; the retailer's hardly moved.
Our reading
Knowing demand did not stop the swing. Seeing the stock below helped the links furthest from the customer most.
Average variance of orders by role (Table 1), undergraduates in a lab, 2002. Five teams of logistics professionals showed the same pattern, less strongly.
Source: Rachel Croson & Karen Donohue, Management Science 52(3), 2006
How it is measured
Orders against demand
Both studies measure the effect the same way: the variance of the orders a link places, against the variance of the demand it receives. A ratio above 1 means the link amplifies.
- Same weeks. Demand received and orders placed, for one item, over the same period.
- Two variances. One for demand, one for orders, in the same units.
- Divide. Orders over demand; repeat at each link where data exist.
Hypothe tical example, one item over eight weeks
- Demand: 36 to 44 a week, average 40, variance 8
- Orders: 0, 40 or 80 a week, average 40, variance 1,200
- Ratio: 1,200 ÷ 8 = 150
The same 40 a week reaches the supplier as a far noisier signal. The item and its figures are invented.
The steps and the example are the editors', on the definition of Lee et al. (1997) and the variances of Croson & Donohue (2006). Variances of the eight weeks, divided by 8.
Sources: Hau L. Lee, V. Padmanabhan & Seungjin Whang, Management Science 43(4), 1997; Rachel Croson & Karen Donohue, Management Science 52(3), 2006
Tool of the issue
The order-swing card
One card per item and link, filled in with the person who places the orders. The inventory tool sorts items by how steady their demand is and sets reorder points from it.
- Item and link who orders from whom; the weeks compared
- The ratio variance of orders ÷ variance of demand
- On order now ordered, not yet received; is it counted before the next order?
- Which cause forecast update, batching, promotion, shortage gaming, supply line ignored
- One change, and when we measure again e.g. share sales data, order smaller and more often, allocate by past sales
Our proposal, built on the causes and counter-measures in Lee et al. (1997) and the supply line in Sterman (1989).
Sources: Hau L. Lee, V. Padmanabhan & Seungjin Whang, Management Science 43(4), 1997; John D. Sterman, Management Science 35(3), 1989
Open the tool: ABC/XYZ Inventory
Sources and method
Every figure has a source.
The figures in this issue come from the sources below. The year shows how recent each one is.
- John D. Sterman, Management Science 35(3), “Modeling Managerial Behavior: Misperceptions of Feedback in a Dynamic Decision Making Experiment”, 1989. https://doi.org/10.1287/mnsc.35.3.321
- Hau L. Lee, V. Padmanabhan & Seungjin Whang, Management Science 43(4), “Information Distortion in a Supply Chain: The Bullwhip Effect”, 1997. https://doi.org/10.1287/mnsc.43.4.546
- Rachel Croson & Karen Donohue, Management Science 52(3), “Behavioral Causes of the Bullwhip Effect and the Observed Value of Inventory Information”, 2006. https://doi.org/10.1287/mnsc.1050.0436
Edit orial me thod
Each figure was checked for its year, its publisher and what it measures, in the full text where it could be opened. A source read only in a summary, an abstract or excerpts is marked “via”. A figure not confirmed in what was read is marked so on its page, or left out. The editor's interpretation is marked “Our reading”.
Edited by Stiven Janaqi, who answers for it; “the editors” in this publication means him. Its texts, translations, layout and the checking of figures against their sources are done in working sessions with Claude, an AI model by Anthropic. How this is made
Management Review · Monthly edition