Finance chiefs' 80% ranges for the stock market held the result about 36% of the time. Psychologists separate three ways of being too sure; the one in a forecast is a range that is too narrow. Students' 90% ranges held their real score 73.1% of the time. In a forecasting tournament, volunteers were 65.4% sure and right 63.3% of the time; an hour of training and work in teams cut the gap further. A way to keep score and a card close the issue.
Management Review · Third series · November 2026 · No. 97
How sure is the manager?
Finance chiefs' 80% ranges that held a third of the time, three ways of being too sure, 90% that came true 73% of the time, forecasters who learned calibration, and a card for keeping score.
- No.
- 97
- Pages
- 10
- Sources
- 4
- Topics
- Role
- Online since
- 3 November 2026
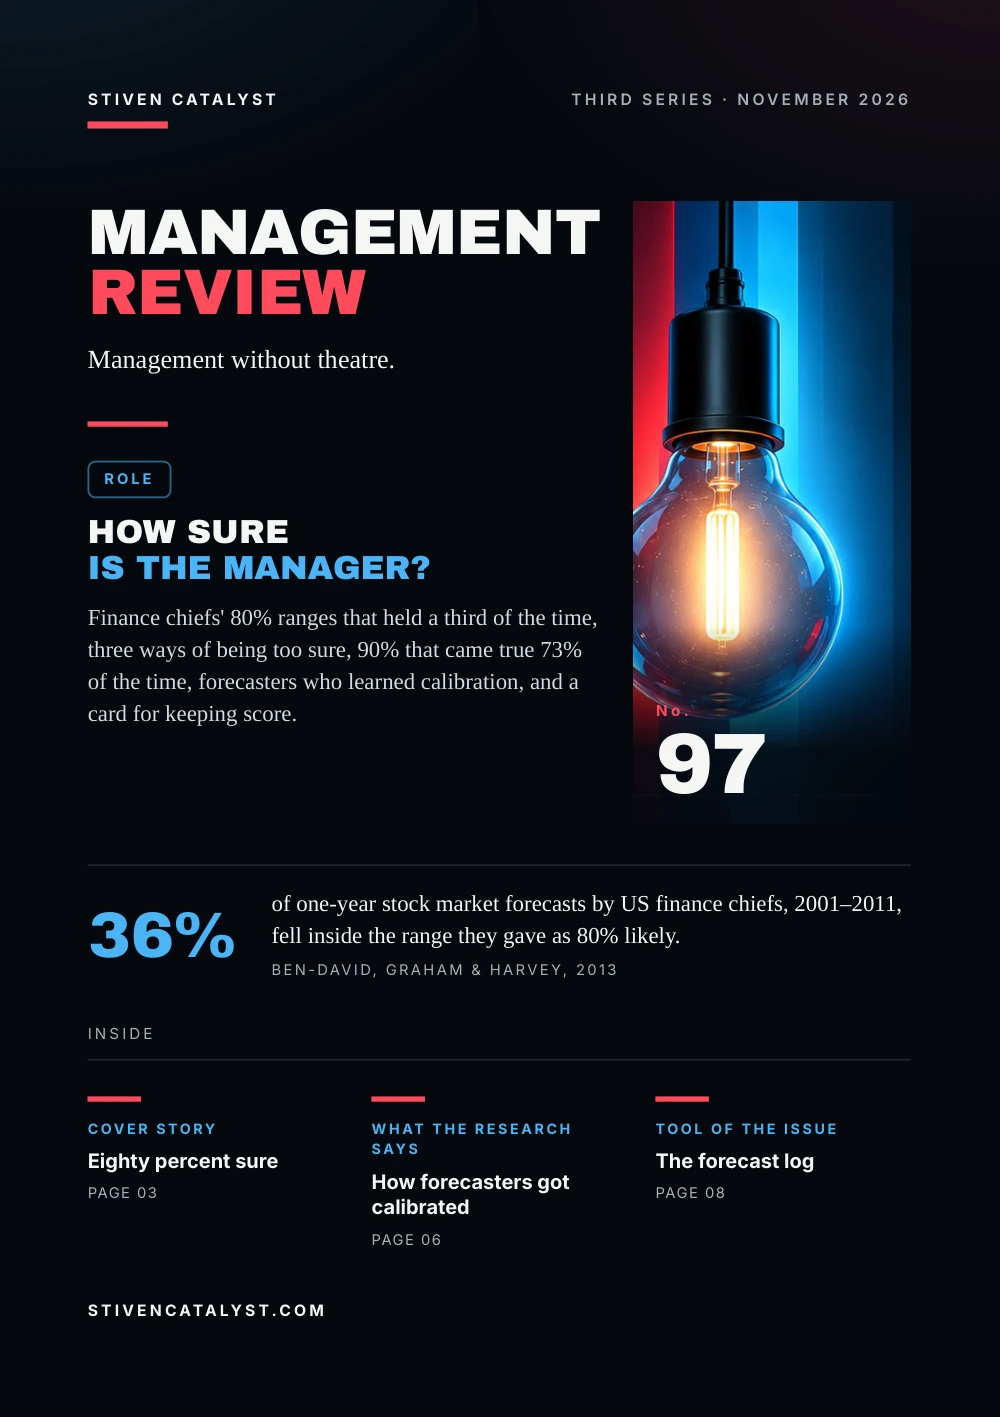
Stiven CatalystThird series · November 2026
ManagementReview
Management without theatre.
Role
How sureis the manager?
Finance chiefs' 80% ranges that held a third of the time, three ways of being too sure, 90% that came true 73% of the time, forecasters who learned calibration, and a card for keeping score.

No.97
36%
of one-year stock market forecasts by US finance chiefs, 2001–2011, fell inside the range they gave as 80% likely.Ben-David, Graham & Harvey, 2013
stivencatalyst.com
No. 97 · Role
In this issue
A manager forecasts all the time: next week's volume, when a repair will be done, whether a new hire will make it. Each forecast carries a feeling of how sure it is. This issue asks how often that feeling is right, and what made some forecasters right about it.
- 03Cover storyEighty percent sure
- 04The modelThree ways to be too sure
- 05The numbersNinety percent sure, and the score
- 06What the research saysHow forecasters got calibrated
- 07How it is measuredKeep score of your own “sure”
- 08Tool of the issueThe forecast log
- 09SourcesSources and method
How to read this issue
Figure
Every figure has its source and year at the foot of its page.
Our reading
Where the editor interprets rather than the research, it says so.
Practice
The steps and the card are proposals to try, not research results.
Cover story
Eight y percentsure
From 2001 to 2011, Duke University asked US financial executives, most of them CFOs, every quarter for next year's S&P 500 return, with a low figure it had a 1-in-10 chance of falling below and a high one it had a 1-in-10 chance of beating. A well-calibrated range would hold the result 80% of the time.
One-year forecasts whose 80% range held the actual return, 2001–2011
The ranges were far too narrow. On average they spanned 14.5 percentage points; from 1950 to 2011, the middle 80% of one-year returns spanned 42.2. The forecasts in the middle of the ranges did not predict the market either.
Our reading
When the market was most uncertain, the ranges widened, but not enough: the gap was largest exactly when caution mattered.
Source: Itzhak Ben-David, John R. Graham & Campbell R. Harvey, National Bureau of Economic Research, 2013
13,346 one-year forecasts from 40 quarterly surveys; 5–8% of those asked answered. The paper gives 36.3% and 36.6% in different sections, its abstract 36%. High uncertainty: quarters with the VIX above its median. NBER working paper, revised 2013.
The model
Three wayst o be t oo sure
Don Moore and Paul Healy found that research had used one word, overconfidence, for three different errors, and that they often point in opposite directions. Their count of studies in 2008 shows how each was studied.
64%
Overestimation
thinking you did, or will do, better than you actually do
5%
Overplacement
thinking you are better than others when you are not
31%
Overprecision
being too sure you know the answer: a range drawn too narrow
On hard tasks people overestimate their score but believe they did worse than others; on easy tasks the reverse. Overprecision, Moore and Healy write, is the most persistent of the three.
Our reading
A manager's forecast can be right in the middle and still too sure: the third error lives in the width of the range.
Source: Don A. Moore & Paul J. Healy, Psychological Review 115(2), 2008
Shares of the empirical studies found by a database search for overconfidence (365 hits, 72% empirical), as Moore and Healy counted them in 2008; the three shares add to 100. The manager's reading is the editors'.
The numbers
Nine t y percentsure, and the score
82 students at Carnegie Mellon took 18 ten-question quizzes and, each time, spread 100% of probability over the scores they might get. Moore and Healy took from each spread the range closest to 90% and checked how often it held the real score.
How often the 90% ranges held the real score (2008)
Earlier studies, they note, found that 90% ranges held the answer 30% to 50% of the time. After hard quizzes the students put their own score 0.79 points too high, after easy ones 0.22 too low, and over 18 rounds these errors did not shrink.
Our reading
Knowing more narrowed the gap but did not close it. Being sure is not the same as being informed.
Source: Don A. Moore & Paul J. Healy, Psychological Review 115(2), 2008
“Stated” is above 90% because 20% of estimates were given as 100% sure. Students paid by a scoring rule that rewards honest estimates; one experiment, which the authors call illustrative.
What the research says
How forecastersgot calibrated
From 2011, a US intelligence research agency ran a tournament on world events. In the Good Judgment Project, 2,860 volunteers made 494,552 forecasts on 344 questions over three years, scored by the Brier rule. On average they were 65.4% sure and right 63.3% of the time.
Overconfidence: confidence minus hit rate, in points, three years
The training took under an hour. In all four tournament years trained forecasters scored 6% to 12% better than untrained ones; of the principles taught, thinking in comparison classes was the one most linked to accuracy. More years in the tournament alone did not improve calibration.
Our reading
The authors compare them to weather forecasters, long the model of calibration. What both had was a clear score and prompt feedback.
Sources: Don A. Moore, Samuel A. Swift, Angela Minster, Barbara Mellers, Lyle Ungar, Philip Tetlock, Heather H. J. Yang & Elizabeth R. Tenney, Management Science (Articles in Advance), 2016; Welton Chang, Eva Chen, Barbara Mellers & Philip Tetlock, Judgment and Decision Making 11(5), 2016
Moore et al. (2016), three years, Table 1; the questions were chosen to be hard. Training gains by Brier score, years 1–4, Chang et al. (2016). Forecasters were self-selected volunteers, mostly men with degrees.
How it is measured
Keep scoreof your own “sure”
The tournament's forecasters were calibrated where they were scored. A manager can score himself: write each forecast as a probability, or as a range with a low and a high, before the outcome is known, then count.
Invented example, one quarter's log
- Hit rate
- 20 forecasts made at 90%; 14 came true: 70%, 20 points too sure
- Brier, one forecast
- 90%, did not happen: (0.9 − 0)² = 0.81; did happen: (0.9 − 1)² = 0.01
The log and its figures are invented by the editors to show the counting. Lower Brier scores are better.
Before, in writing
with the date the question will be settled
A number, not a word
“70%”, not “probably”; a low and a high for quantities
Count by level
the 90% forecasts together, the 70% ones together
Sources: Welton Chang, Eva Chen, Barbara Mellers & Philip Tetlock, Judgment and Decision Making 11(5), 2016; Don A. Moore, Samuel A. Swift, Angela Minster, Barbara Mellers, Lyle Ungar, Philip Tetlock, Heather H. J. Yang & Elizabeth R. Tenney, Management Science (Articles in Advance), 2016
The log is the editors' proposal; a hit rate means little until there are many forecasts at one level. The simple Brier square is for one outcome; the tournament used the original version, from 0 to 2. The outside view is in No. 74, independent estimates in No. 83.
Tool of the issue
The forecastlog
One line per forecast, kept for a quarter and scored when each question is settled. Before setting a range for a rate, the Sigma & Control Chart tool shows how widely it has actually varied: a range much narrower than that is likely too sure.
01The questionwhat exactly will happen, and the date it is settled
02Comparison classhow often something like this happened before
03My forecasta probability, or a low and a high with 1 in 10 beyond each
04What would change itthe news that would move the number, and which way
05Outcomewhat happened; inside the range or not
06Scorehit or miss, and the Brier square
Sources: Welton Chang, Eva Chen, Barbara Mellers & Philip Tetlock, Judgment and Decision Making 11(5), 2016; Don A. Moore, Samuel A. Swift, Angela Minster, Barbara Mellers, Lyle Ungar, Philip Tetlock, Heather H. J. Yang & Elizabeth R. Tenney, Management Science (Articles in Advance), 2016
The log is the editors' proposal, built on the tournament's scoring and its comparison classes; the essay linked below tells of days when demand outran the forecast.
More in the essayHigh-volume days: the standard under pressure
Open the tool: Sigma & Control Chartstivencatalyst.com/tools/sigma-control-chart/
Sources and method
Every figurehas a source.
The figures in this issue come from the sources below. The year shows how recent each one is.
- Managerial Miscalibration (NBER Working Paper 16215, revised September 2013)Itzhak Ben-David, John R. Graham & Campbell R. Harvey, National Bureau of Economic Research, 2013https://www.nber.org/system/files/working_papers/w16215/w16215.pdf
- The Trouble With OverconfidenceDon A. Moore & Paul J. Healy, Psychological Review 115(2), 2008https://doi.org/10.1037/0033-295X.115.2.502
- Confidence Calibration in a Multiyear Geopolitical Forecasting CompetitionDon A. Moore, Samuel A. Swift, Angela Minster, Barbara Mellers, Lyle Ungar, Philip Tetlock, Heather H. J. Yang & Elizabeth R. Tenney, Management Science (Articles in Advance), 2016https://doi.org/10.1287/mnsc.2016.2525
- Developing expert political judgment: The impact of training and practice on judgmental accuracy in geopolitical forecasting tournamentsWelton Chang, Eva Chen, Barbara Mellers & Philip Tetlock, Judgment and Decision Making 11(5), 2016https://journal.sjdm.org/16/16511/jdm16511.pdf
Editorial method
Each figure was checked for its year, its publisher and what it measures, in the full text where it could be opened. A source read only in a summary, an abstract or excerpts is marked “via”. A figure not confirmed in what was read is marked so on its page, or left out. The editor's interpretation is marked “Our reading”.
ManagementReview
Management without theatre.
Every issue, one management question, checked against the best research.
All issues
stivencatalyst.com/magazine/management-review.html
Management Review · No. 97 · November 2026 · Stiven Catalyst
Edited by Stiven Janaqi, who answers for it; “the editors” in this publication means him. Its texts, translations, layout and the checking of figures against their sources are done in working sessions with Claude, an AI model by Anthropic.
stivencatalyst.com/how-this-is-made.html
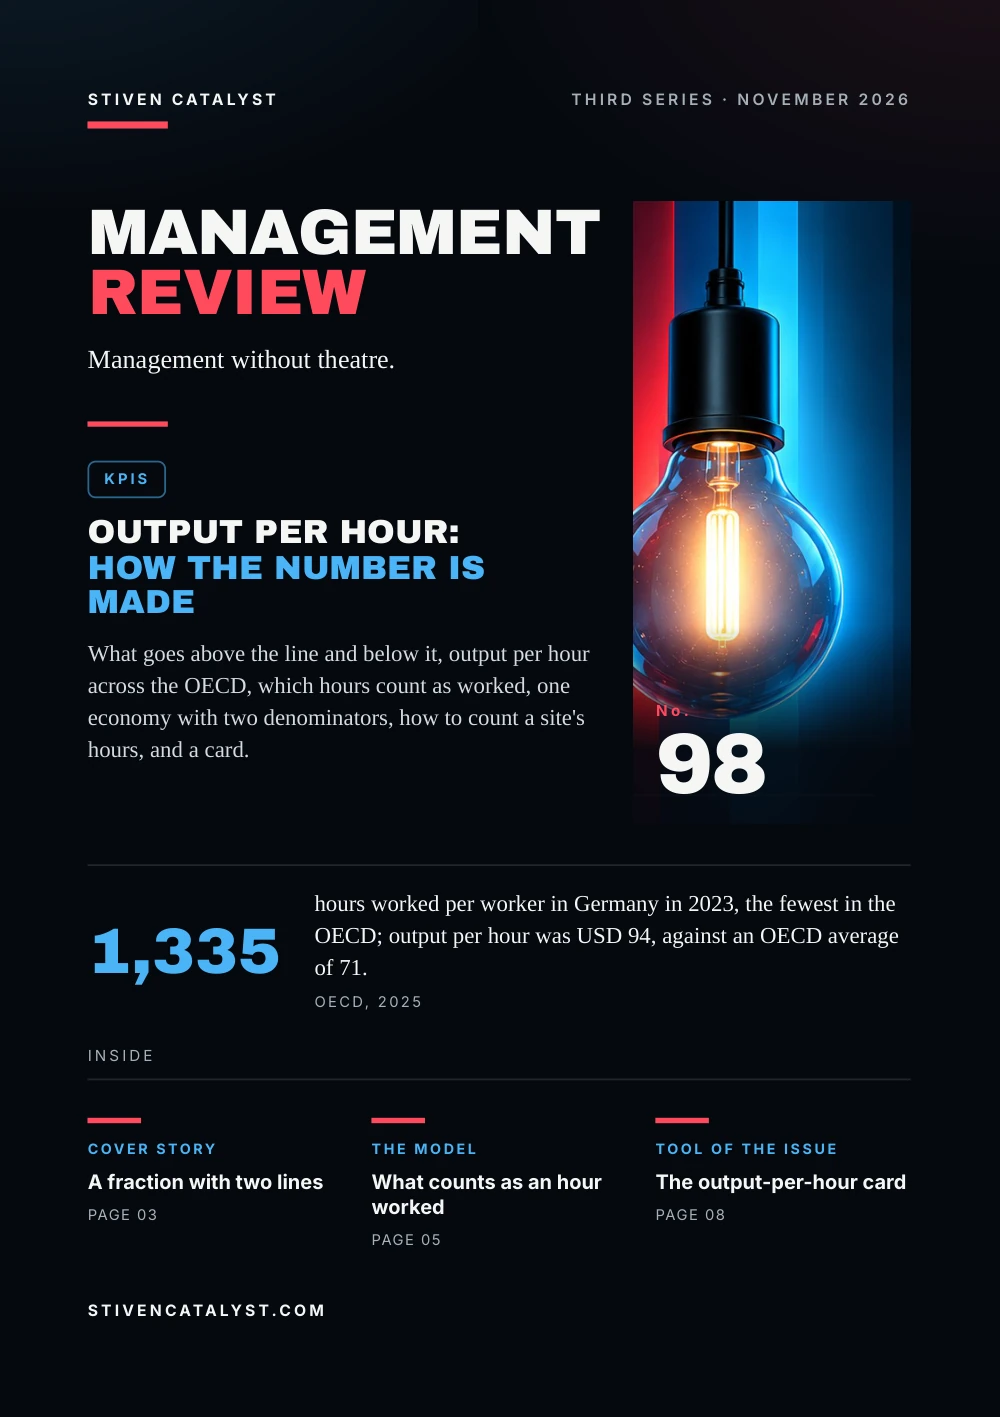 Next issue
Output per hour: how the number is made
Click or swipe a page to turn it. The arrow keys work too.
Management Review · No. 97
The figures of the issue
The charts of the printed pages, with their sources.
13,346 one-year forecasts from 40 quarterly surveys; 5–8% of those asked answered. The paper gives 36.3% and 36.6% in different sections, its abstract 36%. High uncertainty: quarters with the VIX above its median. NBER working paper, revised 2013.
Source: Itzhak Ben-David, John R. Graham & Campbell R. Harvey, National Bureau of Economic Research, 2013
“Stated” is above 90% because 20% of estimates were given as 100% sure. Students paid by a scoring rule that rewards honest estimates; one experiment, which the authors call illustrative.
Source: Don A. Moore & Paul J. Healy, Psychological Review 115(2), 2008
Moore et al. (2016), three years, Table 1; the questions were chosen to be hard. Training gains by Brier score, years 1–4, Chang et al. (2016). Forecasters were self-selected volunteers, mostly men with degrees.
Source: Don A. Moore, Samuel A. Swift, Angela Minster, Barbara Mellers, Lyle Ungar, Philip Tetlock, Heather H. J. Yang & Elizabeth R. Tenney, Management Science (Articles in Advance), 2016
The whole text Read the issue as text For reading on a small screen, searching or a screen reader. The same words, without the page design.
In this issue
A manager forecasts all the time: next week's volume, when a repair will be done, whether a new hire will make it. Each forecast carries a feeling of how sure it is. This issue asks how often that feeling is right, and what made some forecasters right about it.
Finance chiefs' 80% ranges for the stock market held the result about 36% of the time. Psychologists separate three ways of being too sure; the one in a forecast is a range that is too narrow. Students' 90% ranges held their real score 73.1% of the time. In a forecasting tournament, volunteers were 65.4% sure and right 63.3% of the time; an hour of training and work in teams cut the gap further. A way to keep score and a card close the issue.
Stiven Janaqi, Editor
Cover story
Eight y percent sure
From 2001 to 2011, Duke University asked US financial executives, most of them CFOs, every quarter for next year's S&P 500 return, with a low figure it had a 1-in-10 chance of falling below and a high one it had a 1-in-10 chance of beating. A well-calibrated range would hold the result 80% of the time.
One-year forecasts whose 80% range held the actual return, 2001–2011: What a calibrated range would reach 80%, All quarters 36%, Quarters with high market uncertainty 24.1%.
The ranges were far too narrow. On average they spanned 14.5 percentage points; from 1950 to 2011, the middle 80% of one-year returns spanned 42.2. The forecasts in the middle of the ranges did not predict the market either.
Our reading
When the market was most uncertain, the ranges widened, but not enough: the gap was largest exactly when caution mattered.
13,346 one-year forecasts from 40 quarterly surveys; 5–8% of those asked answered. The paper gives 36.3% and 36.6% in different sections, its abstract 36%. High uncertainty: quarters with the VIX above its median. NBER working paper, revised 2013.
Source: Itzhak Ben-David, John R. Graham & Campbell R. Harvey, National Bureau of Economic Research, 2013
The model
Three ways t o be t oo sure
Don Moore and Paul Healy found that research had used one word, overconfidence, for three different errors, and that they often point in opposite directions. Their count of studies in 2008 shows how each was studied.
- 64%: Overestimation. thinking you did, or will do, better than you actually do
- 5%: Overplacement. thinking you are better than others when you are not
- 31%: Overprecision. being too sure you know the answer: a range drawn too narrow
On hard tasks people overestimate their score but believe they did worse than others; on easy tasks the reverse. Overprecision, Moore and Healy write, is the most persistent of the three.
Our reading
A manager's forecast can be right in the middle and still too sure: the third error lives in the width of the range.
Shares of the empirical studies found by a database search for overconfidence (365 hits, 72% empirical), as Moore and Healy counted them in 2008; the three shares add to 100. The manager's reading is the editors'.
Source: Don A. Moore & Paul J. Healy, Psychological Review 115(2), 2008
The numbers
Nine t y percent sure, and the score
82 students at Carnegie Mellon took 18 ten-question quizzes and, each time, spread 100% of probability over the scores they might get. Moore and Healy took from each spread the range closest to 90% and checked how often it held the real score.
How often the 90% ranges held the real score (2008): Stated 90.5%, All 73.1%, Before the quiz 55.1%, Just after it 85.6%.
Earlier studies, they note, found that 90% ranges held the answer 30% to 50% of the time. After hard quizzes the students put their own score 0.79 points too high, after easy ones 0.22 too low, and over 18 rounds these errors did not shrink.
Our reading
Knowing more narrowed the gap but did not close it. Being sure is not the same as being informed.
“Stated” is above 90% because 20% of estimates were given as 100% sure. Students paid by a scoring rule that rewards honest estimates; one experiment, which the authors call illustrative.
Source: Don A. Moore & Paul J. Healy, Psychological Review 115(2), 2008
What the research says
How forecasters got calibrated
From 2011, a US intelligence research agency ran a tournament on world events. In the Good Judgment Project, 2,860 volunteers made 494,552 forecasts on 344 questions over three years, scored by the Brier rule. On average they were 65.4% sure and right 63.3% of the time.
Overconfidence: confidence minus hit rate, in points, three years: Alone, no training 4.3, In a team, no training 2.8, Alone, trained 2.0, In a team, trained 0.7.
The training took under an hour. In all four tournament years trained forecasters scored 6% to 12% better than untrained ones; of the principles taught, thinking in comparison classes was the one most linked to accuracy. More years in the tournament alone did not improve calibration.
Our reading
The authors compare them to weather forecasters, long the model of calibration. What both had was a clear score and prompt feedback.
Moore et al. (2016), three years, Table 1; the questions were chosen to be hard. Training gains by Brier score, years 1–4, Chang et al. (2016). Forecasters were self-selected volunteers, mostly men with degrees.
Sources: Don A. Moore, Samuel A. Swift, Angela Minster, Barbara Mellers, Lyle Ungar, Philip Tetlock, Heather H. J. Yang & Elizabeth R. Tenney, Management Science (Articles in Advance), 2016; Welton Chang, Eva Chen, Barbara Mellers & Philip Tetlock, Judgment and Decision Making 11(5), 2016
How it is measured
Keep score of your own “sure”
The tournament's forecasters were calibrated where they were scored. A manager can score himself: write each forecast as a probability, or as a range with a low and a high, before the outcome is known, then count.
Invented example, one quar ter's log
- Hit rate: 20 forecasts made at 90%; 14 came true: 70%, 20 points too sure
- Brier, one forecast: 90%, did not happen: (0.9 − 0)² = 0.81; did happen: (0.9 − 1)² = 0.01
The log and its figures are invented by the editors to show the counting. Lower Brier scores are better.
- Before, in writing. with the date the question will be settled
- A number, not a word. “70%”, not “probably”; a low and a high for quantities
- Count by level. the 90% forecasts together, the 70% ones together
The log is the editors' proposal; a hit rate means little until there are many forecasts at one level. The simple Brier square is for one outcome; the tournament used the original version, from 0 to 2. The outside view is in No. 74, independent estimates in No. 83.
Sources: Welton Chang, Eva Chen, Barbara Mellers & Philip Tetlock, Judgment and Decision Making 11(5), 2016; Don A. Moore, Samuel A. Swift, Angela Minster, Barbara Mellers, Lyle Ungar, Philip Tetlock, Heather H. J. Yang & Elizabeth R. Tenney, Management Science (Articles in Advance), 2016
Tool of the issue
The forecast log
One line per forecast, kept for a quarter and scored when each question is settled. Before setting a range for a rate, the Sigma & Control Chart tool shows how widely it has actually varied: a range much narrower than that is likely too sure.
- The question what exactly will happen, and the date it is settled
- Comparison class how often something like this happened before
- My forecast a probability, or a low and a high with 1 in 10 beyond each
- What would change it the news that would move the number, and which way
- Ou
t come what happened; inside the range or not - Score hit or miss, and the Brier square
The log is the editors' proposal, built on the tournament's scoring and its comparison classes; the essay linked below tells of days when demand outran the forecast.
Sources: Welton Chang, Eva Chen, Barbara Mellers & Philip Tetlock, Judgment and Decision Making 11(5), 2016; Don A. Moore, Samuel A. Swift, Angela Minster, Barbara Mellers, Lyle Ungar, Philip Tetlock, Heather H. J. Yang & Elizabeth R. Tenney, Management Science (Articles in Advance), 2016
More in the essay: High-volume days: the standard under pressure
Open the tool: Sigma & Control Chart
Sources and method
Every figure has a source.
The figures in this issue come from the sources below. The year shows how recent each one is.
- Itzhak Ben-David, John R. Graham & Campbell R. Harvey, National Bureau of Economic Research, “Managerial Miscalibration (NBER Working Paper 16215, revised September 2013)”, 2013. https://www.nber.org/system/files/working_papers/w16215/w16215.pdf
- Don A. Moore & Paul J. Healy, Psychological Review 115(2), “The Trouble With Overconfidence”, 2008. https://doi.org/10.1037/0033-295X.115.2.502
- Don A. Moore, Samuel A. Swift, Angela Minster, Barbara Mellers, Lyle Ungar, Philip Tetlock, Heather H. J. Yang & Elizabeth R. Tenney, Management Science (Articles in Advance), “Confidence Calibration in a Multiyear Geopolitical Forecasting Competition”, 2016. https://doi.org/10.1287/mnsc.2016.2525
- Welton Chang, Eva Chen, Barbara Mellers & Philip Tetlock, Judgment and Decision Making 11(5), “Developing expert political judgment: The impact of training and practice on judgmental accuracy in geopolitical forecasting tournaments”, 2016. https://journal.sjdm.org/16/16511/jdm16511.pdf
Edit orial me thod
Each figure was checked for its year, its publisher and what it measures, in the full text where it could be opened. A source read only in a summary, an abstract or excerpts is marked “via”. A figure not confirmed in what was read is marked so on its page, or left out. The editor's interpretation is marked “Our reading”.
Edited by Stiven Janaqi, who answers for it; “the editors” in this publication means him. Its texts, translations, layout and the checking of figures against their sources are done in working sessions with Claude, an AI model by Anthropic. How this is made
Management Review · Monthly edition