For the OECD, labour productivity is GDP divided by hours actually worked, not hours paid or contracted. In 2023 the OECD average was about USD 70 an hour; Germany, with the fewest hours per worker, produced 94. The ILO counts waiting at a broken machine as hours worked, and notes that working time does not reflect the intensity of work. In Germany output per person and per hour moved differently in each year from 2022 to 2025. A way to count a site's hours and a card close the issue.
Management Review · Third series · November 2026 · No. 98
Output per hour: how the number is made
What goes above the line and below it, output per hour across the OECD, which hours count as worked, one economy with two denominators, how to count a site's hours, and a card.
- No.
- 98
- Pages
- 10
- Sources
- 3
- Topics
- KPIs
- Online since
- 3 November 2026
Stiven CatalystThird series · November 2026
ManagementReview
Management without theatre.
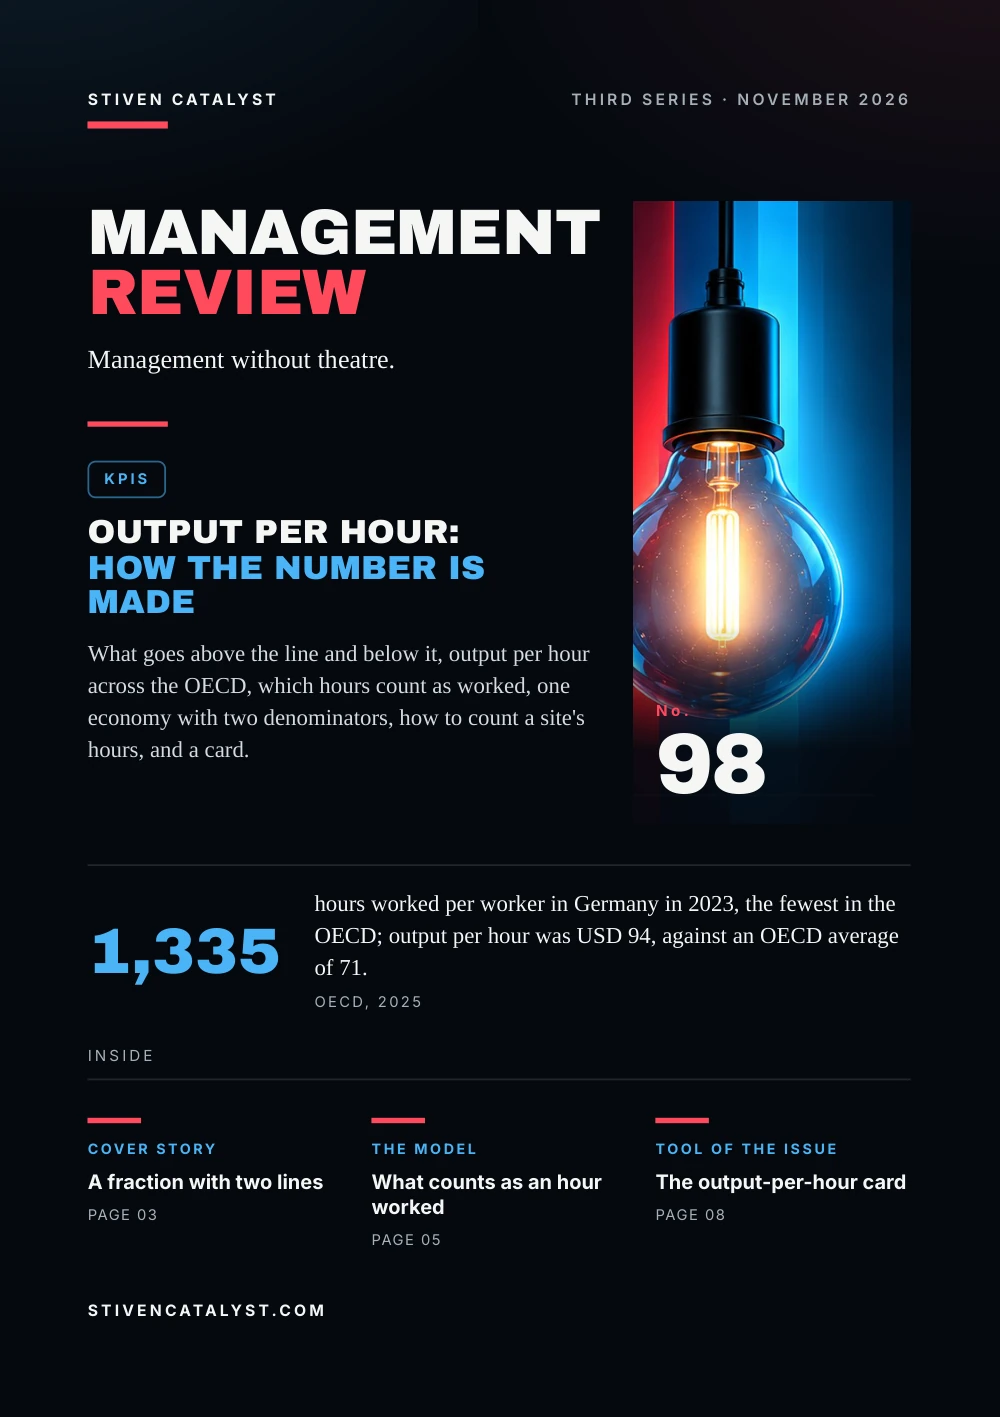
KPIs
Output per hour:how the number is made
What goes above the line and below it, output per hour across the OECD, which hours count as worked, one economy with two denominators, how to count a site's hours, and a card.

No.98
1,335
hours worked per worker in Germany in 2023, the fewest in the OECD; output per hour was USD 94, against an OECD average of 71.OECD, 2025
stivencatalyst.com
No. 98 · KPIs
In this issue
Output per hour is quoted for countries, sectors and sites, often as proof that people work hard or do not. It measures neither effort nor how busy anyone looked. This issue asks what the number divides by what, and how a site can make it honestly.
- 03Cover storyA fraction with two lines
- 04The numbersFewer hours, more per hour
- 05The modelWhat counts as an hour worked
- 06What the research saysOne economy, two denominators
- 07How it is measuredOutput per hour on a site
- 08Tool of the issueThe output-per-hour card
- 09SourcesSources and method
How to read this issue
Figure
Every figure has its source and year at the foot of its page.
Our reading
Where the editor interprets rather than the research, it says so.
Practice
The steps and the card are proposals to try, not research results.
Cover story
A fractionwith two lines
The OECD calls labour productivity the most frequently computed productivity indicator: the volume of output per unit of labour input. In its Compendium the output is GDP and the labour input is hours worked, or the number employed where hours are not known.
Above the line: output
- Value added: production minus what was bought in to make it
- In volume, without the effect of prices
- Across countries, converted at purchasing power parities
Below the line: labour
- Hours actually worked, paid or not
- Not hours paid, contracted or usual
- Each hour the same: skills and experience are not counted
Leave, public holidays, sickness and strikes are taken out of the hours. Where the number employed stands in for hours, part-time work and shorter working weeks make countries and years hard to compare.
Our reading
The number moves when output changes, and also when the hours do. Read both lines before reading the ratio.
Source: OECD Publishing, Paris, 2025
Definitions as the OECD Compendium of Productivity Indicators 2025 gives them, chapter 4. The OECD notes that hours worked ignore the quality of the workforce and so likely understate labour's effective contribution.
The numbers
Fewer hours,more per hour
In 2023 an average hour worked in the OECD produced about USD 70 of GDP, at purchasing power parities. The economies where each worker puts in the most hours are not those that produce most in each hour.
GDP per hour worked, USD at current PPPs, 2023
Hours per worker in 2023: Mexico 2,207, the United States 1,751, Japan 1,611, Germany 1,335. Multiplied out, a US worker produced about 170,000 dollars a year and a German one about 125,000: per person a third apart, per hour 97 against 94.
Our reading
Ireland's lead sits partly in the numerator: output of multinationals recorded there. For such cases the OECD finds income-based measures more accurate.
Source: OECD Publishing, Paris, 2025
OECD Productivity Database, from the data files of the Compendium's Figures 4.5 and 4.6, rounded; the OECD average is 70.5. Output per worker is the editors' product of the two OECD figures. Hours for some countries are OECD estimates.
The model
What counts asan hour worked
In 2008 the International Conference of Labour Statisticians set out what goes into hours actually worked, the figure productivity divides by. It is the time spent in a job on activities that contribute to producing goods or services.
Counted as worked
- Direct hours: the tasks of the job
- Related hours: cleaning, preparing tools, changing clothes, required training
- Down time: a breakdown, no supplies, no power, still available
- Short rest: a tea or coffee break
Not counted
- Annual leave, public holidays, sick leave
- Commuting between home and work
- Longer meal breaks, even when paid
The resolution adds one sentence that matters for any manager reading the ratio: working time “does not reflect the quality, intensity or efficiency of work”.
Our reading
An hour standing at a stopped machine weighs as much below the line as a hard-working one. Busy is not in the formula; waiting lowers the result.
Source: International Labour Organization, 2008
ILO, Resolution concerning the measurement of working time (2008), paragraphs 9 and 11, for work within the national accounts' production boundary; the lists are shortened by the editors.
What the research says
One economy,two denominat ors
Destatis publishes German output both per person employed and per hour worked, each price-adjusted. In 2025, 46.0 million people worked in Germany, about as many as a year before. The two measures did not agree once from 2022 to 2025.
Price-adjusted GDP, change on the year before, Germany
Countries count hours in two ways, the OECD explains: by asking workers in surveys, or by starting from paid or contractual hours and adjusting for absence and overtime. Self-reported hours tend to come out higher, so levels compare less well across countries than growth does.
Our reading
When hours per person fall, output per person looks worse than output per hour. Ask which denominator a figure uses before you call it a trend.
Sources: Statistisches Bundesamt (Destatis), 2026; OECD Publishing, Paris, 2025
Destatis, first annual results, press release of 15 January 2026; earlier years are revised figures and may change again. The differences are small in absolute terms. Methods of counting hours: OECD Compendium 2025, chapter 4.
How it is measured
Output per houron a site
The ILO gives a site the arithmetic for the denominator: hours actually worked are hours paid for, plus unpaid overtime, minus paid absence. Above the line goes what left the site to standard in the same period, counted by the same people.
Invented example, one week on a site
- Hours
- 1,000 paid + 20 unpaid overtime − 80 paid leave and sickness = 940 worked
- Output
- 12,000 units to standard: 12.8 per hour worked, 12.0 per hour paid
Site and figures are invented by the editors. If 60 of the 940 hours were spent waiting for trucks, they stay below the line.
One unit, one definition
what counts as done, and rework counted once
Same period, same people
agency and borrowed staff in the hours if their output is in
Down time noted, not removed
it explains a low week; taking it out hides it
Source: International Labour Organization, 2008
The formula is the ILO's (2008, paragraph 26); the checks are the editors' proposal. Machine losses are in No. 48 (OEE), the cost of a minute in No. 73, rates per 200,000 hours in No. 87.
More in the essayWhat last mile taught me about running real operations
Tool of the issue
The output-per-hourcard
One card per process and week, filled from the time records and the output count. The Shift Capacity tool takes the result as a rate in units per productive hour and turns the next forecast volume into heads per shift.
01Process and weekand who is in it: own staff, agency, borrowed
02Outputunits done to standard; the definition of done
03Hours paidfrom the time records
04+ unpaid overtime − paid absenceleave, holidays, sickness out
05= Hours worked, and output per hourand the same for last week
06Down time inside the hourshours and causes: waiting, breakdowns, no material
Sources: International Labour Organization, 2008; OECD Publishing, Paris, 2025
The card is the editors' proposal, built on the ILO's definition of hours worked and the OECD's ratio; the essay linked on page 7 tells why pressure should not turn into people trying to look busy.
Open the tool: Shift Capacitystivencatalyst.com/tools/shift-capacity/
Sources and method
Every figurehas a source.
The figures in this issue come from the sources below. The year shows how recent each one is.
- OECD Compendium of Productivity Indicators 2025OECD Publishing, Paris, 2025https://doi.org/10.1787/b024d9e1-en
- Resolution concerning the measurement of working time (18th International Conference of Labour Statisticians)International Labour Organization, 2008https://www.ilo.org/sites/default/files/wcmsp5/groups/public/@dgreports/@stat/documents/normativeinstrument/wcms_112455.pdf
- Bruttoinlandsprodukt im Jahr 2025 um 0,2 % gewachsen (Pressemitteilung Nr. 017)Statistisches Bundesamt (Destatis), 2026https://www.destatis.de/DE/Presse/Pressemitteilungen/2026/01/PD26_017_811.html
Editorial method
Each figure was checked for its year, its publisher and what it measures, in the full text where it could be opened. A source read only in a summary, an abstract or excerpts is marked “via”. A figure not confirmed in what was read is marked so on its page, or left out. The editor's interpretation is marked “Our reading”.
ManagementReview
Management without theatre.
Every issue, one management question, checked against the best research.
All issues
stivencatalyst.com/magazine/management-review.html
Management Review · No. 98 · November 2026 · Stiven Catalyst
Edited by Stiven Janaqi, who answers for it; “the editors” in this publication means him. Its texts, translations, layout and the checking of figures against their sources are done in working sessions with Claude, an AI model by Anthropic.
stivencatalyst.com/how-this-is-made.html
 Next issue
Lifting and the back: technique is not enough
Click or swipe a page to turn it. The arrow keys work too.
Management Review · No. 98
The figures of the issue
The charts of the printed pages, with their sources.
OECD Productivity Database, from the data files of the Compendium's Figures 4.5 and 4.6, rounded; the OECD average is 70.5. Output per worker is the editors' product of the two OECD figures. Hours for some countries are OECD estimates.
Source: OECD Publishing, Paris, 2025
Destatis, first annual results, press release of 15 January 2026; earlier years are revised figures and may change again. The differences are small in absolute terms. Methods of counting hours: OECD Compendium 2025, chapter 4.
Source: Statistisches Bundesamt (Destatis), 2026
The whole text Read the issue as text For reading on a small screen, searching or a screen reader. The same words, without the page design.
In this issue
Output per hour is quoted for countries, sectors and sites, often as proof that people work hard or do not. It measures neither effort nor how busy anyone looked. This issue asks what the number divides by what, and how a site can make it honestly.
For the OECD, labour productivity is GDP divided by hours actually worked, not hours paid or contracted. In 2023 the OECD average was about USD 70 an hour; Germany, with the fewest hours per worker, produced 94. The ILO counts waiting at a broken machine as hours worked, and notes that working time does not reflect the intensity of work. In Germany output per person and per hour moved differently in each year from 2022 to 2025. A way to count a site's hours and a card close the issue.
Stiven Janaqi, Editor
Cover story
A fraction with two lines
The OECD calls labour productivity the most frequently computed productivity indicator: the volume of output per unit of labour input. In its Compendium the output is GDP and the labour input is hours worked, or the number employed where hours are not known.
Above the line: output
- Value added: production minus what was bought in to make it
- In volume, without the effect of prices
- Across countries, converted at purchasing power parities
Below the line: labour
- Hours actually worked, paid or not
- Not hours paid, contracted or usual
- Each hour the same: skills and experience are not counted
Leave, public holidays, sickness and strikes are taken out of the hours. Where the number employed stands in for hours, part-time work and shorter working weeks make countries and years hard to compare.
Our reading
The number moves when output changes, and also when the hours do. Read both lines before reading the ratio.
Definitions as the OECD Compendium of Productivity Indicators 2025 gives them, chapter 4. The OECD notes that hours worked ignore the quality of the workforce and so likely understate labour's effective contribution.
Source: OECD Publishing, Paris, 2025
The numbers
Fewer hours, more per hour
In 2023 an average hour worked in the OECD produced about USD 70 of GDP, at purchasing power parities. The economies where each worker puts in the most hours are not those that produce most in each hour.
GDP per hour worked, USD at current PPPs, 2023: Ireland 151, United States 97, Germany 94, OECD average 71, Japan 56, Mexico 25.
Hours per worker in 2023: Mexico 2,207, the United States 1,751, Japan 1,611, Germany 1,335. Multiplied out, a US worker produced about 170,000 dollars a year and a German one about 125,000: per person a third apart, per hour 97 against 94.
Our reading
Ireland's lead sits partly in the numerator: output of multinationals recorded there. For such cases the OECD finds income-based measures more accurate.
OECD Productivity Database, from the data files of the Compendium's Figures 4.5 and 4.6, rounded; the OECD average is 70.5. Output per worker is the editors' product of the two OECD figures. Hours for some countries are OECD estimates.
Source: OECD Publishing, Paris, 2025
The model
What counts as an hour worked
In 2008 the International Conference of Labour Statisticians set out what goes into hours actually worked, the figure productivity divides by. It is the time spent in a job on activities that contribute to producing goods or services.
Counted as worked
- Direct hours: the tasks of the job
- Related hours: cleaning, preparing tools, changing clothes, required training
- Down time: a breakdown, no supplies, no power, still available
- Short rest: a tea or coffee break
Not counted
- Annual leave, public holidays, sick leave
- Commuting between home and work
- Longer meal breaks, even when paid
The resolution adds one sentence that matters for any manager reading the ratio: working time “does not reflect the quality, intensity or efficiency of work”.
Our reading
An hour standing at a stopped machine weighs as much below the line as a hard-working one. Busy is not in the formula; waiting lowers the result.
ILO, Resolution concerning the measurement of working time (2008), paragraphs 9 and 11, for work within the national accounts' production boundary; the lists are shortened by the editors.
Source: International Labour Organization, 2008
What the research says
One economy, two denominat ors
Destatis publishes German output both per person employed and per hour worked, each price-adjusted. In 2025, 46.0 million people worked in Germany, about as many as a year before. The two measures did not agree once from 2022 to 2025.
Price-adjusted GDP, change on the year before, Germany: 2022: Per person +0.5%, Per hour +0.3%; 2023: Per person −1.5%, Per hour −1.2%; 2024: Per person −0.6%, Per hour −0.3%; 2025: Per person +0.2%, Per hour +0.4%.
Countries count hours in two ways, the OECD explains: by asking workers in surveys, or by starting from paid or contractual hours and adjusting for absence and overtime. Self-reported hours tend to come out higher, so levels compare less well across countries than growth does.
Our reading
When hours per person fall, output per person looks worse than output per hour. Ask which denominator a figure uses before you call it a trend.
Destatis, first annual results, press release of 15 January 2026; earlier years are revised figures and may change again. The differences are small in absolute terms. Methods of counting hours: OECD Compendium 2025, chapter 4.
Sources: Statistisches Bundesamt (Destatis), 2026; OECD Publishing, Paris, 2025
How it is measured
Output per hour on a site
The ILO gives a site the arithmetic for the denominator: hours actually worked are hours paid for, plus unpaid overtime, minus paid absence. Above the line goes what left the site to standard in the same period, counted by the same people.
Invented example, one week on a site
- Hours: 1,000 paid + 20 unpaid overtime − 80 paid leave and sickness = 940 worked
- Output: 12,000 units to standard: 12.8 per hour worked, 12.0 per hour paid
Site and figures are invented by the editors. If 60 of the 940 hours were spent waiting for trucks, they stay below the line.
- One unit, one definition. what counts as done, and rework counted once
- Same period, same people. agency and borrowed staff in the hours if their output is in
- Down time noted, not removed. it explains a low week; taking it out hides it
The formula is the ILO's (2008, paragraph 26); the checks are the editors' proposal. Machine losses are in No. 48 (OEE), the cost of a minute in No. 73, rates per 200,000 hours in No. 87.
Source: International Labour Organization, 2008
More in the essay: What last mile taught me about running real operations
Tool of the issue
The output-per-hour card
One card per process and week, filled from the time records and the output count. The Shift Capacity tool takes the result as a rate in units per productive hour and turns the next forecast volume into heads per shift.
- Process and week and who is in it: own staff, agency, borrowed
- Output units done to standard; the definition of done
- Hours paid from the time records
- + unpaid ove
r time − paid absence leave, holidays, sickness out - = Hours worked, and output per hour and the same for last week
- Down time inside the hours hours and causes: waiting, breakdowns, no material
The card is the editors' proposal, built on the ILO's definition of hours worked and the OECD's ratio; the essay linked on page 7 tells why pressure should not turn into people trying to look busy.
Sources: International Labour Organization, 2008; OECD Publishing, Paris, 2025
Open the tool: Shift Capacity
Sources and method
Every figure has a source.
The figures in this issue come from the sources below. The year shows how recent each one is.
- OECD Publishing, Paris, “OECD Compendium of Productivity Indicators 2025”, 2025. https://doi.org/10.1787/b024d9e1-en
- International Labour Organization, “Resolution concerning the measurement of working time (18th International Conference of Labour Statisticians)”, 2008. https://www.ilo.org/sites/default/files/wcmsp5/groups/public/@dgreports/@stat/documents/normativeinstrument/wcms_112455.pdf
- Statistisches Bundesamt (Destatis), “Bruttoinlandsprodukt im Jahr 2025 um 0,2 % gewachsen (Pressemitteilung Nr. 017)”, 2026. https://www.destatis.de/DE/Presse/Pressemitteilungen/2026/01/PD26_017_811.html
Edit orial me thod
Each figure was checked for its year, its publisher and what it measures, in the full text where it could be opened. A source read only in a summary, an abstract or excerpts is marked “via”. A figure not confirmed in what was read is marked so on its page, or left out. The editor's interpretation is marked “Our reading”.
Edited by Stiven Janaqi, who answers for it; “the editors” in this publication means him. Its texts, translations, layout and the checking of figures against their sources are done in working sessions with Claude, an AI model by Anthropic. How this is made
Management Review · Monthly edition