In the US the rate is cases times 200,000, divided by hours worked: cases per 100 full-time workers. OSHA's rule decides what is a case, and the line runs through the treatment. In 2024 the rate was 2.3 for all private industry and 8.0 for couriers. The ILO's frequency rate counts per million hours, Eurostat per 100,000 people employed, and Eurostat warns that very low national rates may reflect under-reporting. On a small site a single case can double the rate. A card helps read the number with its base.
Management Review · Third series · November 2026 · No. 87
Injury rates: how a safe t y number is made
Why 200,000 hours, what OSHA counts as a case, US rates by industry for 2024, why a small site's rate jumps, what Europe's rates and a survey of health practitioners say the number hides, and a card.
- No.
- 87
- Pages
- 10
- Sources
- 6
- Topics
- KPIs
- Online since
- 1 November 2026
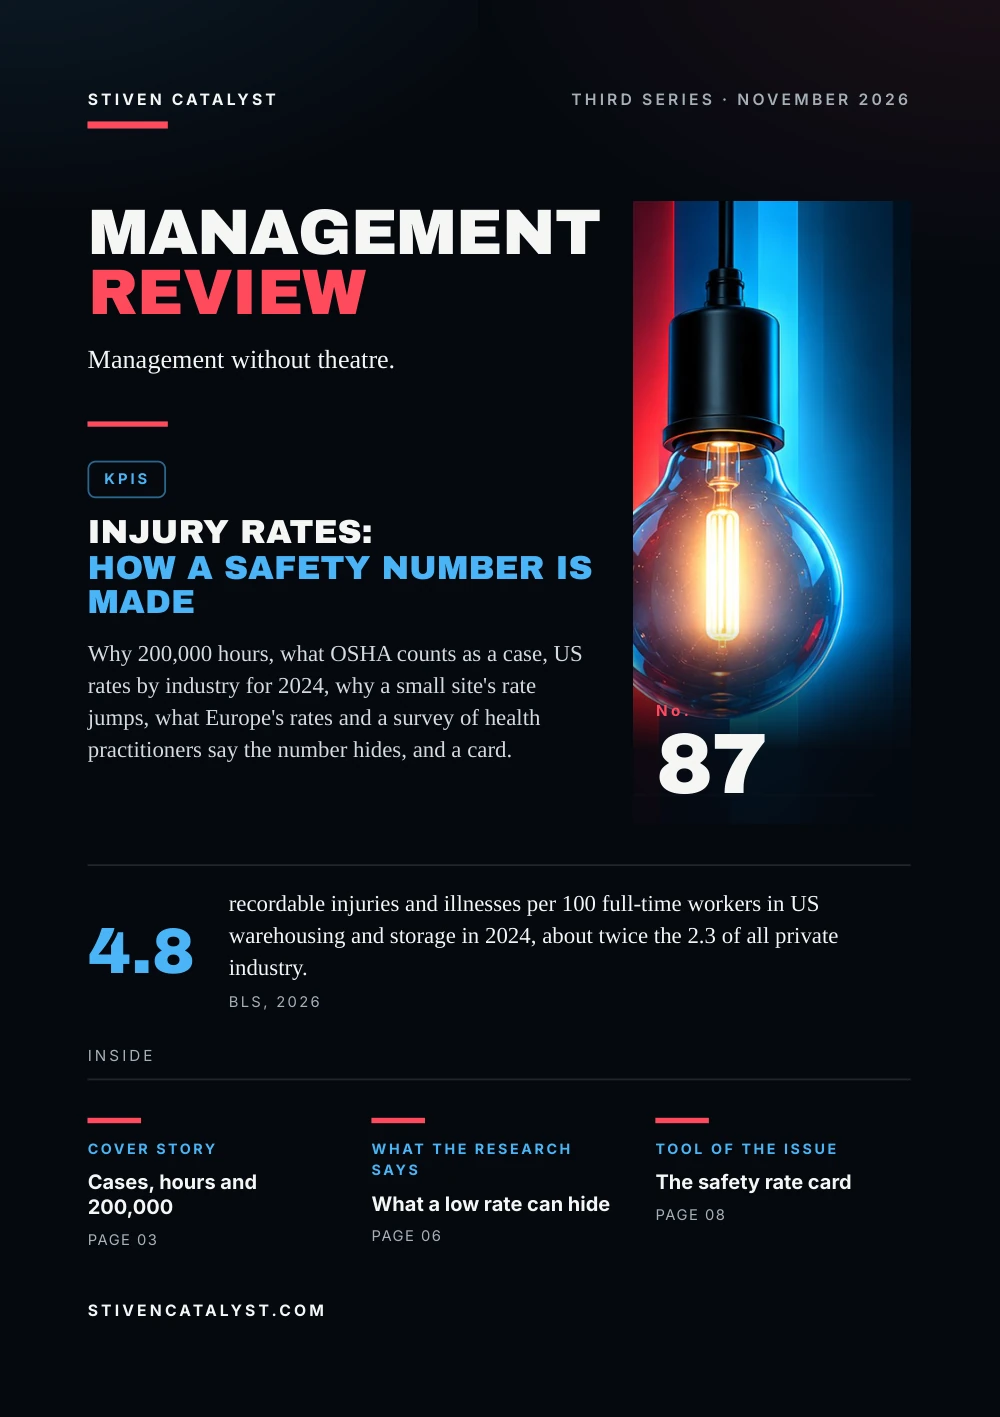
Stiven CatalystThird series · November 2026
ManagementReview
Management without theatre.
KPIs
Injury rates:how a safety number is made
Why 200,000 hours, what OSHA counts as a case, US rates by industry for 2024, why a small site's rate jumps, what Europe's rates and a survey of health practitioners say the number hides, and a card.

No.87
4.8
recordable injuries and illnesses per 100 full-time workers in US warehousing and storage in 2024, about twice the 2.3 of all private industry.BLS, 2026
stivencatalyst.com
No. 87 · KPIs
In this issue
Almost every site reports a safety rate, and the rate often decides whether a month counts as good. Few people who read it know how it is made: what counts as a case, which hours go below the line, and why the same site can show three different numbers.
- 03Cover storyCases, hours and 200,000
- 04The numbersSame formula, different work
- 05The modelWhat counts as a case
- 06What the research saysWhat a low rate can hide
- 07How it is measuredOne case, a new rate
- 08Tool of the issueThe safety rate card
- 09SourcesSources and method
How to read this issue
Figure
Every figure has its source and year at the foot of its page.
Our reading
Where the editor interprets rather than the research, it says so.
Practice
The steps and the card are proposals to try, not research results.
Cover story
Cases, hoursand 200,000
The US Bureau of Labor Statistics gives the formula in one line: recordable injuries and illnesses, times 200,000, divided by the hours all employees worked. The 200,000 is 100 employees working 40 hours a week for 50 weeks, so the rate reads as cases per 100 full-time workers in a year.
The BLS worked example, a fictitious manufacturer
- Employees
- 200, who worked 400,000 hours in the year
- All recordable cases
- 7: 7 × 200,000 ÷ 400,000 = 3.5
- Days away, restriction or transfer
- 3 of them: 3 × 200,000 ÷ 400,000 = 1.5
The company is the BLS's own invention, to show the method.
Hours worked means hours actually worked: paid vacation, sick leave and holidays are left out. Where the hours are not recorded, the BLS allows an estimate from scheduled hours or from 8 hours per working day.
Our reading
The rate is a fraction. It moves when the cases change, and also when the hours do.
Source: US Bureau of Labor Statistics, 2025
Formula, constant, example and the rule for hours as the BLS gives them (page last modified March 2025). The cases come from OSHA's log, Form 300, or its summary, Form 300A.
The numbers
Same formula,different work
In 2024 the rate for all US private industry was 2.3 recordable cases per 100 full-time workers. Behind the average, the same formula gives very different numbers from one kind of work to the next.
Recordable cases per 100 full-time workers, US, 2024
The kind of case differs too. In warehousing, 4.1 of the 4.8 involved days away, restricted work or transfer, most of them restriction or transfer (2.6). Among couriers, days away led (4.2 of 8.0).
Our reading
A rate below the national average says little. Compare it with your own industry, and look at which kind of case makes up the number.
Source: US Bureau of Labor Statistics, 2026
Cases per 100 full-time equivalent workers, as employers reported them under OSHA's rules; BLS survey for 2024, Table 1, released January 2026.
The model
What countsas a case
OSHA's rule, 29 CFR 1904.7, records a work-related injury or illness that leads to death, days away from work, restricted work or transfer, medical treatment beyond first aid, or loss of consciousness, or that a doctor or other licensed professional diagnoses as significant.
First aid: not a case
- Non-prescription medicine at normal strength
- A tetanus shot
- Cleaning a wound, plasters, butterfly strips
- Hot or cold packs, elastic bandages
- Massage; fluids for heat stress
Medical treatment: a case
- The same medicine at prescription strength
- Other vaccines, such as rabies
- Stitches or staples
- A rigid splint to immobilise
- Physical therapy or chiropractic
The rule calls its list of 14 first-aid treatments complete. A note at the head of the rule adds that recording a case does not mean that the employer or the worker was at fault, or that a rule was broken.
Our reading
The line runs through the treatment, not the injury. The same cut is first aid with butterfly strips and a recordable case with stitches.
Source: Occupational Safety and Health Administration, Code of Federal Regulations, annual edition, 2024
Shortened from 29 CFR 1904.7, Code of Federal Regulations, annual edition 2024. Each side lists 5 examples. Leading and lagging indicators are in No. 2.
What the research says
What a low ratecan hide
Eurostat counts accidents at work that cause at least four full calendar days of absence. In 2024 the EU had 1,359 per 100,000 people employed. Romania reported 65, France 2,622.
Non-fatal accidents at work per 100,000 employed, 2024
Eurostat warns that very low rates may reflect under-reporting, and that well-established reporting systems may often explain high ones. In 2009 the US GAO surveyed occupational health practitioners: 67% had seen workers fear discipline for reporting, and over a third had been asked for treatment that kept a case off the log but was not enough to treat it.
Our reading
A low rate can mean safe work, or work where cases are not reported. The number alone cannot tell the two apart.
Sources: Eurostat, Statistics Explained, 2026; US Government Accountability Office, 2009
Eurostat: simple rates, not adjusted for the mix of industries; data extracted September 2026. GAO: 504 of 1,131 practitioners answered (45%), about the workplaces where they treated workers in 2008.
How it is measured
One case,a new rate
The hours are the denominator. A small site has few of them, so one case moves its rate a long way. The base matters too: the ILO standard counts per million hours, five times the US base.
Hypothetical example, two sites in one year
- Small site
- 25 people, 50,000 hours: 1 case = 4.0, 2 cases = 8.0
- Large site
- 1,000 people, 2,000,000 hours: one more case adds 0.1
- Per million hours
- the small site's 4.0 becomes 20
One more case doubles the small site's rate and barely shows at the large one. The sites and figures are invented.
Show the count and the hours
Next to the rate, so a reader sees how many cases make it.
Use twelve months
A rolling year gives a small site enough hours to read.
Name the base
200,000 hours, a million hours, or people employed.
Our reading
A small site with a second case has not become twice as dangerous overnight. Read the count before the rate.
Sources: US Bureau of Labor Statistics, 2025; Sixteenth International Conference of Labour Statisticians, International Labour Organization, 1998
The example and the three checks are the editors'. 2,000 hours a year is the BLS base per worker; the ILO frequency rate is from its 1998 resolution.
More in the essayA bad day or a problem?
Tool of the issue
The safe t yrate card
One card per site and month, filled in before the number goes into a report. The safety cross logs each event by day and works out the rates from the hours.
01Site and periodthe month, and the twelve months to date
02Casesdays away, restriction or transfer, other recordable; first-aid cases apart
03Hours workedhours actually worked, without paid leave; where they come from
04Rate and basecases × 200,000 ÷ hours, or × 1,000,000; write which
05Compared withour last twelve months; our industry, with its year
06What the rate does not shownear misses, first-aid cases, reports still open, any sign that people hold back
Sources: US Bureau of Labor Statistics, 2025; Occupational Safety and Health Administration, Code of Federal Regulations, annual edition, 2024; Sixteenth International Conference of Labour Statisticians, International Labour Organization, 1998
Our proposal, built on the BLS formula, OSHA's recording criteria and the ILO frequency rate. Near misses are in No. 63.
Open the tool: Safety Crossstivencatalyst.com/tools/safety-cross/
Sources and method
Every figurehas a source.
The figures in this issue come from the sources below. The year shows how recent each one is.
- How To Compute Your Firm's Incidence Rate for Safety ManagementUS Bureau of Labor Statistics, 2025https://www.bls.gov/iif/overview/compute-nonfatal-incidence-rates.htm
- Incidence rates of nonfatal occupational injuries and illnesses by industry and case types, 2024 (Survey of Occupational Injuries and Illnesses, Table 1)US Bureau of Labor Statistics, 2026https://www.bls.gov/web/osh/table-1-industry-rates-national.htm
- 29 CFR Part 1904: Recording and Reporting Occupational Injuries and IllnessesOccupational Safety and Health Administration, Code of Federal Regulations, annual edition, 2024https://www.govinfo.gov/content/pkg/CFR-2024-title29-vol5/pdf/CFR-2024-title29-vol5-part1904.pdf
- Resolution concerning statistics of occupational injuries (resulting from occupational accidents)Sixteenth International Conference of Labour Statisticians, International Labour Organization, 1998https://www.ilo.org/sites/default/files/wcmsp5/groups/public/@dgreports/@stat/documents/normativeinstrument/wcms_087528.pdf
- Accidents at work statisticsEurostat, Statistics Explained, 2026https://ec.europa.eu/eurostat/statistics-explained/index.php?title=Accidents_at_work_statistics
- Workplace Safety and Health: Enhancing OSHA's Records Audit Process Could Improve the Accuracy of Worker Injury and Illness Data (GAO-10-10)US Government Accountability Office, 2009https://www.gao.gov/assets/gao-10-10.pdf
Editorial method
Each figure was checked for its year, its publisher and what it measures, in the full text where it could be opened. A source read only in a summary, an abstract or excerpts is marked “via”. A figure not confirmed in what was read is marked so on its page, or left out. The editor's interpretation is marked “Our reading”.
ManagementReview
Management without theatre.
Every issue, one management question, checked against the best research.
All issues
stivencatalyst.com/magazine/management-review.html
Management Review · No. 87 · November 2026 · Stiven Catalyst
Edited by Stiven Janaqi, who answers for it; “the editors” in this publication means him. Its texts, translations, layout and the checking of figures against their sources are done in working sessions with Claude, an AI model by Anthropic.
stivencatalyst.com/how-this-is-made.html
 Next issue
The bullwhip effect: small waves, big swings
Click or swipe a page to turn it. The arrow keys work too.
Management Review · No. 87
The figures of the issue
The charts of the printed pages, with their sources.
Cases per 100 full-time equivalent workers, as employers reported them under OSHA's rules; BLS survey for 2024, Table 1, released January 2026.
Source: US Bureau of Labor Statistics, 2026
Eurostat: simple rates, not adjusted for the mix of industries; data extracted September 2026. GAO: 504 of 1,131 practitioners answered (45%), about the workplaces where they treated workers in 2008.
Source: Eurostat, Statistics Explained, 2026
The whole text Read the issue as text For reading on a small screen, searching or a screen reader. The same words, without the page design.
In this issue
Almost every site reports a safety rate, and the rate often decides whether a month counts as good. Few people who read it know how it is made: what counts as a case, which hours go below the line, and why the same site can show three different numbers.
In the US the rate is cases times 200,000, divided by hours worked: cases per 100 full-time workers. OSHA's rule decides what is a case, and the line runs through the treatment. In 2024 the rate was 2.3 for all private industry and 8.0 for couriers. The ILO's frequency rate counts per million hours, Eurostat per 100,000 people employed, and Eurostat warns that very low national rates may reflect under-reporting. On a small site a single case can double the rate. A card helps read the number with its base.
Stiven Janaqi, Editor
Cover story
Cases, hours and 200,000
The US Bureau of Labor Statistics gives the formula in one line: recordable injuries and illnesses, times 200,000, divided by the hours all employees worked. The 200,000 is 100 employees working 40 hours a week for 50 weeks, so the rate reads as cases per 100 full-time workers in a year.
The BLS worked example, a fictitious manufacturer
- Employees: 200, who worked 400,000 hours in the year
- All recordable cases: 7: 7 × 200,000 ÷ 400,000 = 3.5
- Days away, restriction or transfer: 3 of them: 3 × 200,000 ÷ 400,000 = 1.5
The company is the BLS's own invention, to show the method.
Hours worked means hours actually worked: paid vacation, sick leave and holidays are left out. Where the hours are not recorded, the BLS allows an estimate from scheduled hours or from 8 hours per working day.
Our reading
The rate is a fraction. It moves when the cases change, and also when the hours do.
Formula, constant, example and the rule for hours as the BLS gives them (page last modified March 2025). The cases come from OSHA's log, Form 300, or its summary, Form 300A.
Source: US Bureau of Labor Statistics, 2025
The numbers
Same formula, different work
In 2024 the rate for all US private industry was 2.3 recordable cases per 100 full-time workers. Behind the average, the same formula gives very different numbers from one kind of work to the next.
Recordable cases per 100 full-time workers, US, 2024: Couriers and messengers 8.0, Nursing and residential care 5.5, Warehousing and storage 4.8, Manufacturing 2.7, All private industry 2.3, Construction 2.2, Finance and insurance 0.3.
The kind of case differs too. In warehousing, 4.1 of the 4.8 involved days away, restricted work or transfer, most of them restriction or transfer (2.6). Among couriers, days away led (4.2 of 8.0).
Our reading
A rate below the national average says little. Compare it with your own industry, and look at which kind of case makes up the number.
Cases per 100 full-time equivalent workers, as employers reported them under OSHA's rules; BLS survey for 2024, Table 1, released January 2026.
Source: US Bureau of Labor Statistics, 2026
The model
What counts as a case
OSHA's rule, 29 CFR 1904.7, records a work-related injury or illness that leads to death, days away from work, restricted work or transfer, medical treatment beyond first aid, or loss of consciousness, or that a doctor or other licensed professional diagnoses as significant.
First aid: not a case
- Non-prescription medicine at normal strength
- A tetanus shot
- Cleaning a wound, plasters, butterfly strips
- Hot or cold packs, elastic bandages
- Massage; fluids for heat stress
Medical treatment: a case
- The same medicine at prescription strength
- Other vaccines, such as rabies
- Stitches or staples
- A rigid splint to immobilise
- Physical therapy or chiropractic
The rule calls its list of 14 first-aid treatments complete. A note at the head of the rule adds that recording a case does not mean that the employer or the worker was at fault, or that a rule was broken.
Our reading
The line runs through the treatment, not the injury. The same cut is first aid with butterfly strips and a recordable case with stitches.
Shortened from 29 CFR 1904.7, Code of Federal Regulations, annual edition 2024. Each side lists 5 examples. Leading and lagging indicators are in No. 2.
Source: Occupational Safety and Health Administration, Code of Federal Regulations, annual edition, 2024
What the research says
What a low rate can hide
Eurostat counts accidents at work that cause at least four full calendar days of absence. In 2024 the EU had 1,359 per 100,000 people employed. Romania reported 65, France 2,622.
Non-fatal accidents at work per 100,000 employed, 2024: France 2,622, Portugal 2,489, EU 1,359, Bulgaria 87, Romania 65.
Eurostat warns that very low rates may reflect under-reporting, and that well-established reporting systems may often explain high ones. In 2009 the US GAO surveyed occupational health practitioners: 67% had seen workers fear discipline for reporting, and over a third had been asked for treatment that kept a case off the log but was not enough to treat it.
Our reading
A low rate can mean safe work, or work where cases are not reported. The number alone cannot tell the two apart.
Eurostat: simple rates, not adjusted for the mix of industries; data extracted September 2026. GAO: 504 of 1,131 practitioners answered (45%), about the workplaces where they treated workers in 2008.
Sources: Eurostat, Statistics Explained, 2026; US Government Accountability Office, 2009
How it is measured
One case, a new rate
The hours are the denominator. A small site has few of them, so one case moves its rate a long way. The base matters too: the ILO standard counts per million hours, five times the US base.
Hypothe tical example, two sites in one year
- Small site: 25 people, 50,000 hours: 1 case = 4.0, 2 cases = 8.0
- Large site: 1,000 people, 2,000,000 hours: one more case adds 0.1
- Per million hours: the small site's 4.0 becomes 20
One more case doubles the small site's rate and barely shows at the large one. The sites and figures are invented.
- Show the count and the hours. Next to the rate, so a reader sees how many cases make it.
- Use twelve months. A rolling year gives a small site enough hours to read.
- Name the base. 200,000 hours, a million hours, or people employed.
Our reading
A small site with a second case has not become twice as dangerous overnight. Read the count before the rate.
The example and the three checks are the editors'. 2,000 hours a year is the BLS base per worker; the ILO frequency rate is from its 1998 resolution.
Sources: US Bureau of Labor Statistics, 2025; Sixteenth International Conference of Labour Statisticians, International Labour Organization, 1998
More in the essay: A bad day or a problem?
Tool of the issue
The safe t y rate card
One card per site and month, filled in before the number goes into a report. The safety cross logs each event by day and works out the rates from the hours.
- Site and period the month, and the twelve months to date
- Cases days away, restriction or transfer, other recordable; first-aid cases apart
- Hours worked hours actually worked, without paid leave; where they come from
- Rate and base cases × 200,000 ÷ hours, or × 1,000,000; write which
- Compared with our last twelve months; our industry, with its year
- What the rate does not show near misses, first-aid cases, reports still open, any sign that people hold back
Our proposal, built on the BLS formula, OSHA's recording criteria and the ILO frequency rate. Near misses are in No. 63.
Sources: US Bureau of Labor Statistics, 2025; Occupational Safety and Health Administration, Code of Federal Regulations, annual edition, 2024; Sixteenth International Conference of Labour Statisticians, International Labour Organization, 1998
Open the tool: Safety Cross
Sources and method
Every figure has a source.
The figures in this issue come from the sources below. The year shows how recent each one is.
- US Bureau of Labor Statistics, “How To Compute Your Firm's Incidence Rate for Safety Management”, 2025. https://www.bls.gov/iif/overview/compute-nonfatal-incidence-rates.htm
- US Bureau of Labor Statistics, “Incidence rates of nonfatal occupational injuries and illnesses by industry and case types, 2024 (Survey of Occupational Injuries and Illnesses, Table 1)”, 2026. https://www.bls.gov/web/osh/table-1-industry-rates-national.htm
- Occupational Safety and Health Administration, Code of Federal Regulations, annual edition, “29 CFR Part 1904: Recording and Reporting Occupational Injuries and Illnesses”, 2024. https://www.govinfo.gov/content/pkg/CFR-2024-title29-vol5/pdf/CFR-2024-title29-vol5-part1904.pdf
- Sixteenth International Conference of Labour Statisticians, International Labour Organization, “Resolution concerning statistics of occupational injuries (resulting from occupational accidents)”, 1998. https://www.ilo.org/sites/default/files/wcmsp5/groups/public/@dgreports/@stat/documents/normativeinstrument/wcms_087528.pdf
- Eurostat, Statistics Explained, “Accidents at work statistics”, 2026. https://ec.europa.eu/eurostat/statistics-explained/index.php?title=Accidents_at_work_statistics
- US Government Accountability Office, “Workplace Safety and Health: Enhancing OSHA's Records Audit Process Could Improve the Accuracy of Worker Injury and Illness Data (GAO-10-10)”, 2009. https://www.gao.gov/assets/gao-10-10.pdf
Edit orial me thod
Each figure was checked for its year, its publisher and what it measures, in the full text where it could be opened. A source read only in a summary, an abstract or excerpts is marked “via”. A figure not confirmed in what was read is marked so on its page, or left out. The editor's interpretation is marked “Our reading”.
Edited by Stiven Janaqi, who answers for it; “the editors” in this publication means him. Its texts, translations, layout and the checking of figures against their sources are done in working sessions with Claude, an AI model by Anthropic. How this is made
Management Review · Monthly edition