In 2009 a 19-item WHO checklist was followed by fewer complications and deaths in eight hospitals. In Ontario, 101 hospitals adopted checklists under public reporting, and neither deaths nor complications changed significantly. In six Dutch hospitals one list gave six different results, and patients whose list was filled in more fully had fewer complications. NASA's research on cockpit checklists and the WHO manual show what makes a list usable, and a card helps review one.
Management Review · Third series · November 2026 · No. 85
Checklists: one list, two results
Nineteen items that came with fewer complications in eight hospitals, the same idea with no measurable effect in 101 others, six hospitals with one list and six results, how a list is built for use, and a card to review one.
- No.
- 85
- Pages
- 10
- Sources
- 5
- Topics
- Operations
- Online since
- 1 November 2026
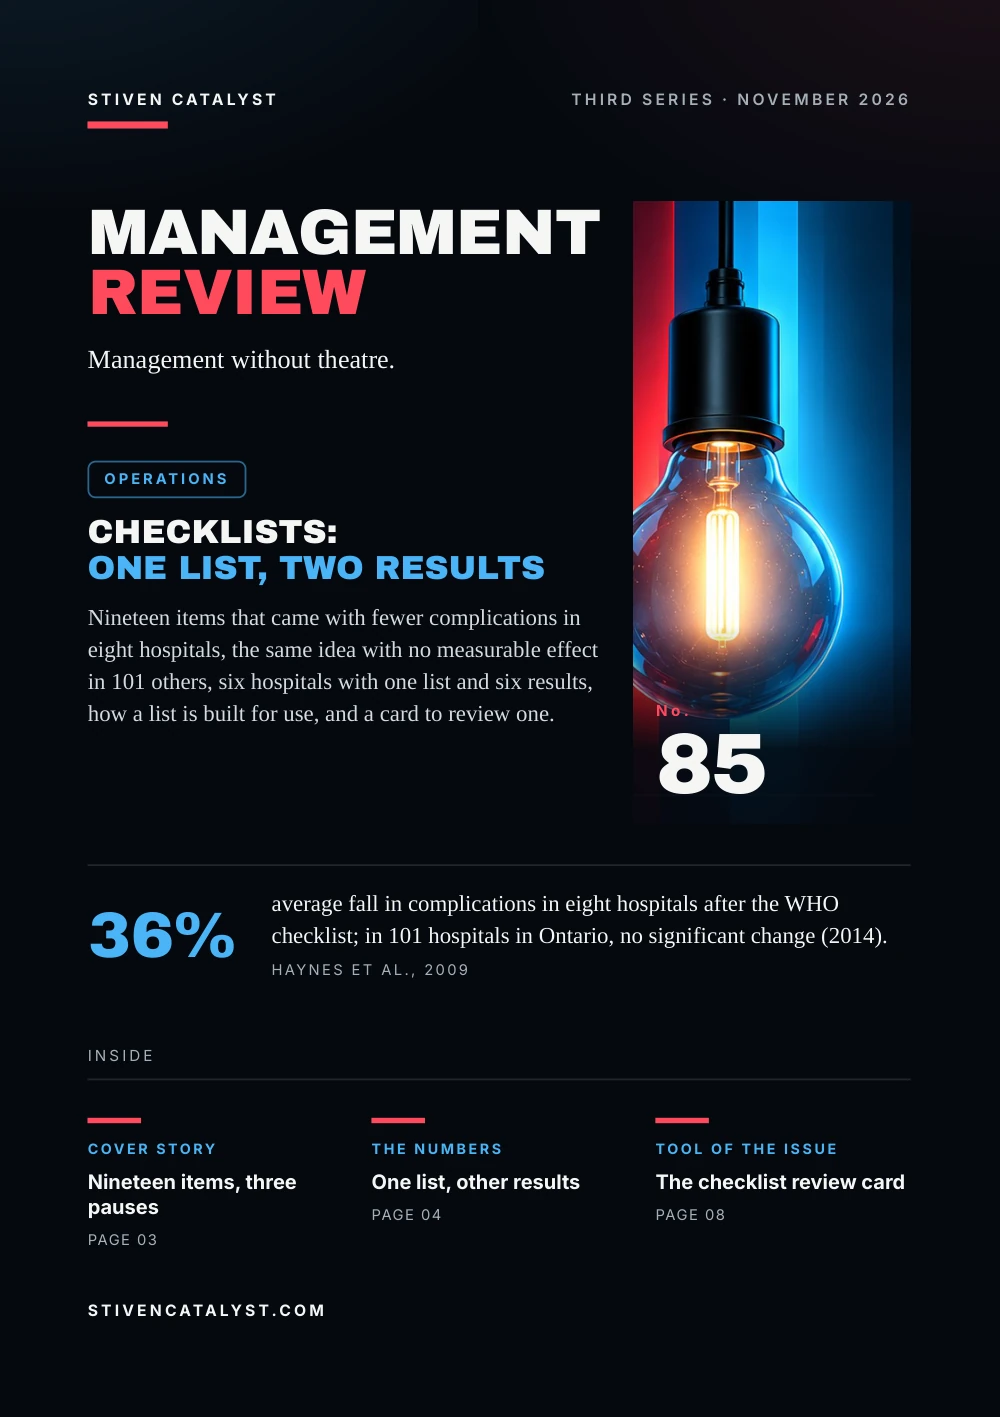
Stiven CatalystThird series · November 2026
ManagementReview
Management without theatre.
Operations
Checklists:one list, two results
Nineteen items that came with fewer complications in eight hospitals, the same idea with no measurable effect in 101 others, six hospitals with one list and six results, how a list is built for use, and a card to review one.

No.85
36%
average fall in complications in eight hospitals after the WHO checklist; in 101 hospitals in Ontario, no significant change (2014).Haynes et al., 2009
stivencatalyst.com
No. 85 · Operations
In this issue
Checklists are cheap, short and easy to copy, so they spread fast. The same list has come with fewer deaths in one study and with no measurable change in another. This issue asks what made the difference, and what a manager can check before adding one more list to a shift.
- 03Cover storyNineteen items, three pauses
- 04The numbersOne list, other results
- 05What the research saysSix hospitals, six results
- 06The modelA list built for the shift
- 07How it is measuredTicked or used?
- 08Tool of the issueThe checklist review card
- 09SourcesSources and method
How to read this issue
Figure
Every figure has its source and year at the foot of its page.
Our reading
Where the editor interprets rather than the research, it says so.
Practice
The steps and the card are proposals to try, not research results.
Cover story
Nine teen items,three pauses
Between October 2007 and September 2008, eight hospitals in Toronto, New Delhi, Amman, Auckland, Manila, Ifakara, London and Seattle introduced the WHO Surgical Safety Checklist: 19 items, confirmed aloud by the team at three moments of an operation.
Sign in
Before anaesthesia: identity, site, consent, pulse oximeter, allergy, airway, risk of blood loss.
Time out
Before the incision: everyone named, patient and site confirmed, critical steps reviewed, antibiotics given.
Sign out
Before the patient leaves: the procedure, the counts, the specimen labels, equipment problems, concerns for recovery.
11.0 → 7.0%of patients had a complication, before and after
1.5 → 0.8%died in hospital, before and after
The authors do not claim to know exactly why. All six safety steps they measured were done for 34.2% of patients before and 56.7% after; antibiotics on time rose from 56% to 83%. Teams also had to pause, introduce themselves and brief one another. Being observed may have played a part; the study could not fully separate it.
Our reading
The list brought no new medicine. It made the team say aloud, every time, steps most of them already knew and often skipped.
Source: Alex B. Haynes et al., New England Journal of Medicine 360(5), 2009
Before-and-after study without a control group; 3,733 and 3,955 patients, complications counted in hospital up to 30 days. The three pauses are shortened from the study's Table 1.
The numbers
One list,other results
From July 2010, Ontario's Ministry of Health required hospitals to report publicly how often they used a surgical checklist. David Urbach and colleagues compared 109,341 operations in three months before each hospital's checklist with 106,370 in three months after, in 101 hospitals.
Deaths after surgery before and after a checklist, three studies
Ontario's hospitals reported compliance of 98% or more after June 2010. No formal team training was required, and implementation was not standardised. Adjusted complications went from 3.86% to 3.82%; like the change in deaths, not significant. Six hospitals had significantly fewer complications, three significantly more.
Our reading
A compliance rate of 98% counts ticks. It says nothing about whether anyone stopped to check.
Sources: Alex B. Haynes et al., New England Journal of Medicine 360(5), 2009; Eefje N. de Vries et al., New England Journal of Medicine 363(20), 2010 (via the authors' version in E. N. de Vries's thesis (University of Amsterdam, 2010)); David R. Urbach et al., New England Journal of Medicine 370(11), 2014
Deaths in hospital up to 30 days (WHO), in hospital (SURPASS), in hospital or within 30 days, adjusted (Ontario): compare direction, not level. Ontario used administrative data, the other two staff on site. SURPASS covered the whole hospital stay.
What the research says
Six hospitals,six results
The Dutch SURPASS checklist follows the surgical patient from admission to discharge, not only in the operating room. Six hospitals with high standards of care introduced it over nine months; five similar hospitals did not, and served as controls.
Complications per 100 patients in the six SURPASS hospitals
In the control hospitals, complications went from 30.4 to 31.2 per 100 patients. In a sample of 1,146 lists, a median of 80% of items was filled in. Patients whose list was filled in above that median had 7.1 complications per 100; those below it, 18.8.
Our reading
One list, six results. The authors point to how fully each hospital used it and how far it had become part of the work.
Source: Eefje N. de Vries et al., New England Journal of Medicine 363(20), 2010 (via the authors' version in E. N. de Vries's thesis (University of Amsterdam, 2010))
Hospitals in the authors' random order; 5 and 6 are academic, with sicker patients and larger operations. Completeness was checked in about 26% of procedures; patients with fuller lists may differ in other ways too.
The model
A list builtfor the shif t
For NASA, Asaf Degani and Earl Wiener observed 42 airline crews on 72 flights and read the reports of checklist failures; their report appeared in 1990. In 2009 the WHO set its own rules for adapting the surgical list. The two agree on more than they differ.
Short
Five to nine items per section, under a minute each (WHO). At an airline with 81 items for start, taxi and take-off, pilots worried about poor discipline.
Critical items first
Interruptions come late in a list; what must not be missed goes near the top.
Say the value
“Flaps 15”, not “checked”: a reply that states the setting can be heard to be wrong.
Spoken by the team
Used only as a written form, the WHO expects the list to be far less effective.
Not a dumping site
An item added after every incident makes the list longer and its use weaker.
Tested before rollout
One team, one day; change it and try again (WHO).
Our reading
Every item added to a list takes a little attention from the items already on it.
Sources: Asaf Degani & Earl L. Wiener, NASA Contractor Report 177549, 1990; World Health Organization, 2009
Rules shortened by the editors from Degani & Wiener's Appendix A (1990) and the WHO manual (2009). The aviation report covers airliners' normal checklist. Designing out the need to remember is No. 46, poka-yoke.
How it is measured
Tickedor used?
After the crash of Delta flight 1141, which took off without flaps, investigators timed the checklist on the voice recorder: less than a second between “flaps” and “fifteen, fifteen, green light”. Pilots told Degani and Wiener the list can become a “sing-song”, recited from memory.
Watched, not only reported
Someone sees the list in use a few times a month; a compliance figure alone counts ticks.
Values spoken
Replies give the reading, so a wrong one can be heard.
Time per section
Near a minute; far less may mean it is recited, far more that it is too long.
Stops that happen
How often the list held the work: an item missing, a step repeated.
Changed by its users
The last change came from the people who run it, and was tried before it spread.
Our reading
A list is in use when it can stop the work. If it never has, it is probably being recited.
Sources: Asaf Degani & Earl L. Wiener, NASA Contractor Report 177549, 1990; World Health Organization, 2009; David R. Urbach et al., New England Journal of Medicine 370(11), 2014
The marks are the editors', drawn from Degani & Wiener (1990), the WHO manual (2009) and the Ontario study (2014). The NTSB timing is as Degani & Wiener report it. Standard work, the base a list checks, is No. 35.
More in the essayA good SOP is not a document
Tool of the issue
The checklistreview card
One card per list, filled in with the people who use it. Start with one team: in the WHO pilot, sites that began in many operating rooms at once met the most resistance. Leader Standard Work puts watching the list on a leader's daily round.
01The list and its momentwhich work, which pause: before the start, before the step that cannot be undone, at the end
02Itemshow many per section; which ones stopped the work last month
03Critical itemsthe two or three that must never be missed; are they near the top?
04The repliesdoes each reply state a value or a fact, not “checked”?
05Observed usewatched how often, by whom; time per section; what was skipped
06Changewhat to remove, what to add; where it is tried first; next review date
Sources: Asaf Degani & Earl L. Wiener, NASA Contractor Report 177549, 1990; World Health Organization, 2009; Eefje N. de Vries et al., New England Journal of Medicine 363(20), 2010 (via the authors' version in E. N. de Vries's thesis (University of Amsterdam, 2010))
The card is the editors' proposal, built on Degani & Wiener's guidelines (1990), the WHO manual (2009) and the SURPASS data on completeness (de Vries et al., 2010).
Open the tool: Leader Standard Workstivencatalyst.com/tools/leader-standard-work/
Sources and method
Every figurehas a source.
The figures in this issue come from the sources below. The year shows how recent each one is.
- A Surgical Safety Checklist to Reduce Morbidity and Mortality in a Global PopulationAlex B. Haynes et al., New England Journal of Medicine 360(5), 2009https://doi.org/10.1056/NEJMsa0810119
- Introduction of Surgical Safety Checklists in Ontario, CanadaDavid R. Urbach et al., New England Journal of Medicine 370(11), 2014https://doi.org/10.1056/NEJMsa1308261
- Effect of a Comprehensive Surgical Safety System on Patient OutcomesEefje N. de Vries et al., New England Journal of Medicine 363(20), 2010 · via the authors' version in E. N. de Vries's thesis (University of Amsterdam, 2010)https://doi.org/10.1056/NEJMsa0911535
- Human Factors of Flight-Deck Checklists: The Normal ChecklistAsaf Degani & Earl L. Wiener, NASA Contractor Report 177549, 1990https://ntrs.nasa.gov/citations/19910017830
- Implementation Manual: WHO Surgical Safety Checklist 2009World Health Organization, 2009https://www.who.int/publications/i/item/9789241598590
Editorial method
Each figure was checked for its year, its publisher and what it measures, in the full text where it could be opened. A source read only in a summary, an abstract or excerpts is marked “via”. A figure not confirmed in what was read is marked so on its page, or left out. The editor's interpretation is marked “Our reading”.
ManagementReview
Management without theatre.
Every issue, one management question, checked against the best research.
All issues
stivencatalyst.com/magazine/management-review.html
Management Review · No. 85 · November 2026 · Stiven Catalyst
Edited by Stiven Janaqi, who answers for it; “the editors” in this publication means him. Its texts, translations, layout and the checking of figures against their sources are done in working sessions with Claude, an AI model by Anthropic.
stivencatalyst.com/how-this-is-made.html
 Next issue
Using AI without losing the skill
Click or swipe a page to turn it. The arrow keys work too.
Management Review · No. 85
The figures of the issue
The charts of the printed pages, with their sources.
Deaths in hospital up to 30 days (WHO), in hospital (SURPASS), in hospital or within 30 days, adjusted (Ontario): compare direction, not level. Ontario used administrative data, the other two staff on site. SURPASS covered the whole hospital stay.
Sources: Alex B. Haynes et al., New England Journal of Medicine 360(5), 2009; Eefje N. de Vries et al., New England Journal of Medicine 363(20), 2010 (via the authors' version in E. N. de Vries's thesis (University of Amsterdam, 2010)); David R. Urbach et al., New England Journal of Medicine 370(11), 2014
Hospitals in the authors' random order; 5 and 6 are academic, with sicker patients and larger operations. Completeness was checked in about 26% of procedures; patients with fuller lists may differ in other ways too.
Source: Eefje N. de Vries et al., New England Journal of Medicine 363(20), 2010 (via the authors' version in E. N. de Vries's thesis (University of Amsterdam, 2010))
The whole text Read the issue as text For reading on a small screen, searching or a screen reader. The same words, without the page design.
In this issue
Checklists are cheap, short and easy to copy, so they spread fast. The same list has come with fewer deaths in one study and with no measurable change in another. This issue asks what made the difference, and what a manager can check before adding one more list to a shift.
In 2009 a 19-item WHO checklist was followed by fewer complications and deaths in eight hospitals. In Ontario, 101 hospitals adopted checklists under public reporting, and neither deaths nor complications changed significantly. In six Dutch hospitals one list gave six different results, and patients whose list was filled in more fully had fewer complications. NASA's research on cockpit checklists and the WHO manual show what makes a list usable, and a card helps review one.
Stiven Janaqi, Editor
Cover story
Nine teen items, three pauses
Between October 2007 and September 2008, eight hospitals in Toronto, New Delhi, Amman, Auckland, Manila, Ifakara, London and Seattle introduced the WHO Surgical Safety Checklist: 19 items, confirmed aloud by the team at three moments of an operation.
- Sign in. Before anaesthesia: identity, site, consent, pulse oximeter, allergy, airway, risk of blood loss.
- Time out. Before the incision: everyone named, patient and site confirmed, critical steps reviewed, antibiotics given.
- Sign out. Before the patient leaves: the procedure, the counts, the specimen labels, equipment problems, concerns for recovery.
- 11.0 → 7.0% of patients had a complication, before and after
- 1.5 → 0.8% died in hospital, before and after
The authors do not claim to know exactly why. All six safety steps they measured were done for 34.2% of patients before and 56.7% after; antibiotics on time rose from 56% to 83%. Teams also had to pause, introduce themselves and brief one another. Being observed may have played a part; the study could not fully separate it.
Our reading
The list brought no new medicine. It made the team say aloud, every time, steps most of them already knew and often skipped.
Before-and-after study without a control group; 3,733 and 3,955 patients, complications counted in hospital up to 30 days. The three pauses are shortened from the study's Table 1.
Source: Alex B. Haynes et al., New England Journal of Medicine 360(5), 2009
The numbers
One list, other results
From July 2010, Ontario's Ministry of Health required hospitals to report publicly how often they used a surgical checklist. David Urbach and colleagues compared 109,341 operations in three months before each hospital's checklist with 106,370 in three months after, in 101 hospitals.
Deaths after surgery before and after a checklist, three studies: WHO 2009: Before 1.5%, After 0.8%; SURPASS 2010: Before 1.5%, After 0.8%; Ontario 2014: Before 0.71%, After 0.65%.
Ontario's hospitals reported compliance of 98% or more after June 2010. No formal team training was required, and implementation was not standardised. Adjusted complications went from 3.86% to 3.82%; like the change in deaths, not significant. Six hospitals had significantly fewer complications, three significantly more.
Our reading
A compliance rate of 98% counts ticks. It says nothing about whether anyone stopped to check.
Deaths in hospital up to 30 days (WHO), in hospital (SURPASS), in hospital or within 30 days, adjusted (Ontario): compare direction, not level. Ontario used administrative data, the other two staff on site. SURPASS covered the whole hospital stay.
Sources: Alex B. Haynes et al., New England Journal of Medicine 360(5), 2009; Eefje N. de Vries et al., New England Journal of Medicine 363(20), 2010 (via the authors' version in E. N. de Vries's thesis (University of Amsterdam, 2010)); David R. Urbach et al., New England Journal of Medicine 370(11), 2014
What the research says
Six hospitals, six results
The Dutch SURPASS checklist follows the surgical patient from admission to discharge, not only in the operating room. Six hospitals with high standards of care introduced it over nine months; five similar hospitals did not, and served as controls.
Complications per 100 patients in the six SURPASS hospitals: Hospital 1: Before 22.5, After 5.3; Hospital 2: Before 24.9, After 14.0; Hospital 3: Before 16.0, After 12.1; Hospital 4: Before 9.6, After 8.2; Hospital 5: Before 45.7, After 45.4; Hospital 6: Before 37.6, After 18.1.
In the control hospitals, complications went from 30.4 to 31.2 per 100 patients. In a sample of 1,146 lists, a median of 80% of items was filled in. Patients whose list was filled in above that median had 7.1 complications per 100; those below it, 18.8.
Our reading
One list, six results. The authors point to how fully each hospital used it and how far it had become part of the work.
Hospitals in the authors' random order; 5 and 6 are academic, with sicker patients and larger operations. Completeness was checked in about 26% of procedures; patients with fuller lists may differ in other ways too.
Source: Eefje N. de Vries et al., New England Journal of Medicine 363(20), 2010 (via the authors' version in E. N. de Vries's thesis (University of Amsterdam, 2010))
The model
A list built for the shif t
For NASA, Asaf Degani and Earl Wiener observed 42 airline crews on 72 flights and read the reports of checklist failures; their report appeared in 1990. In 2009 the WHO set its own rules for adapting the surgical list. The two agree on more than they differ.
- Sho
r t. Five to nine items per section, under a minute each (WHO). At an airline with 81 items for start, taxi and take-off, pilots worried about poor discipline. - Critical items first. Interruptions come late in a list; what must not be missed goes near the top.
- Say the value. “Flaps 15”, not “checked”: a reply that states the setting can be heard to be wrong.
- Spoken by the team. Used only as a written form, the WHO expects the list to be far less effective.
- Not a dumping site. An item added after every incident makes the list longer and its use weaker.
- Tested before rollout. One team, one day; change it and try again (WHO).
Our reading
Every item added to a list takes a little attention from the items already on it.
Rules shortened by the editors from Degani & Wiener's Appendix A (1990) and the WHO manual (2009). The aviation report covers airliners' normal checklist. Designing out the need to remember is No. 46, poka-yoke.
Sources: Asaf Degani & Earl L. Wiener, NASA Contractor Report 177549, 1990; World Health Organization, 2009
How it is measured
Ticked or used?
After the crash of Delta flight 1141, which took off without flaps, investigators timed the checklist on the voice recorder: less than a second between “flaps” and “fifteen, fifteen, green light”. Pilots told Degani and Wiener the list can become a “sing-song”, recited from memory.
- Wa
t ched, not only repor ted. Someone sees the list in use a few times a month; a compliance figure alone counts ticks. - Values spoken. Replies give the reading, so a wrong one can be heard.
- Time per section. Near a minute; far less may mean it is recited, far more that it is too long.
- S
t ops that happen. How often the list held the work: an item missing, a step repeated. - Changed by its users. The last change came from the people who run it, and was tried before it spread.
Our reading
A list is in use when it can stop the work. If it never has, it is probably being recited.
The marks are the editors', drawn from Degani & Wiener (1990), the WHO manual (2009) and the Ontario study (2014). The NTSB timing is as Degani & Wiener report it. Standard work, the base a list checks, is No. 35.
Sources: Asaf Degani & Earl L. Wiener, NASA Contractor Report 177549, 1990; World Health Organization, 2009; David R. Urbach et al., New England Journal of Medicine 370(11), 2014
More in the essay: A good SOP is not a document
Tool of the issue
The checklist review card
One card per list, filled in with the people who use it. Start with one team: in the WHO pilot, sites that began in many operating rooms at once met the most resistance. Leader Standard Work puts watching the list on a leader's daily round.
- The list and its moment which work, which pause: before the start, before the step that cannot be undone, at the end
- Items how many per section; which ones stopped the work last month
- Critical items the two or three that must never be missed; are they near the top?
- The replies does each reply state a value or a fact, not “checked”?
- Observed use watched how often, by whom; time per section; what was skipped
- Change what to remove, what to add; where it is tried first; next review date
The card is the editors' proposal, built on Degani & Wiener's guidelines (1990), the WHO manual (2009) and the SURPASS data on completeness (de Vries et al., 2010).
Sources: Asaf Degani & Earl L. Wiener, NASA Contractor Report 177549, 1990; World Health Organization, 2009; Eefje N. de Vries et al., New England Journal of Medicine 363(20), 2010 (via the authors' version in E. N. de Vries's thesis (University of Amsterdam, 2010))
Open the tool: Leader Standard Work
Sources and method
Every figure has a source.
The figures in this issue come from the sources below. The year shows how recent each one is.
- Alex B. Haynes et al., New England Journal of Medicine 360(5), “A Surgical Safety Checklist to Reduce Morbidity and Mortality in a Global Population”, 2009. https://doi.org/10.1056/NEJMsa0810119
- David R. Urbach et al., New England Journal of Medicine 370(11), “Introduction of Surgical Safety Checklists in Ontario, Canada”, 2014. https://doi.org/10.1056/NEJMsa1308261
- Eefje N. de Vries et al., New England Journal of Medicine 363(20), “Effect of a Comprehensive Surgical Safety System on Patient Outcomes”, 2010 (via the authors' version in E. N. de Vries's thesis (University of Amsterdam, 2010)). https://doi.org/10.1056/NEJMsa0911535
- Asaf Degani & Earl L. Wiener, NASA Contractor Report 177549, “Human Factors of Flight-Deck Checklists: The Normal Checklist”, 1990. https://ntrs.nasa.gov/citations/19910017830
- World Health Organization, “Implementation Manual: WHO Surgical Safety Checklist 2009”, 2009. https://www.who.int/publications/i/item/9789241598590
Edit orial me thod
Each figure was checked for its year, its publisher and what it measures, in the full text where it could be opened. A source read only in a summary, an abstract or excerpts is marked “via”. A figure not confirmed in what was read is marked so on its page, or left out. The editor's interpretation is marked “Our reading”.
Edited by Stiven Janaqi, who answers for it; “the editors” in this publication means him. Its texts, translations, layout and the checking of figures against their sources are done in working sessions with Claude, an AI model by Anthropic. How this is made
Management Review · Monthly edition