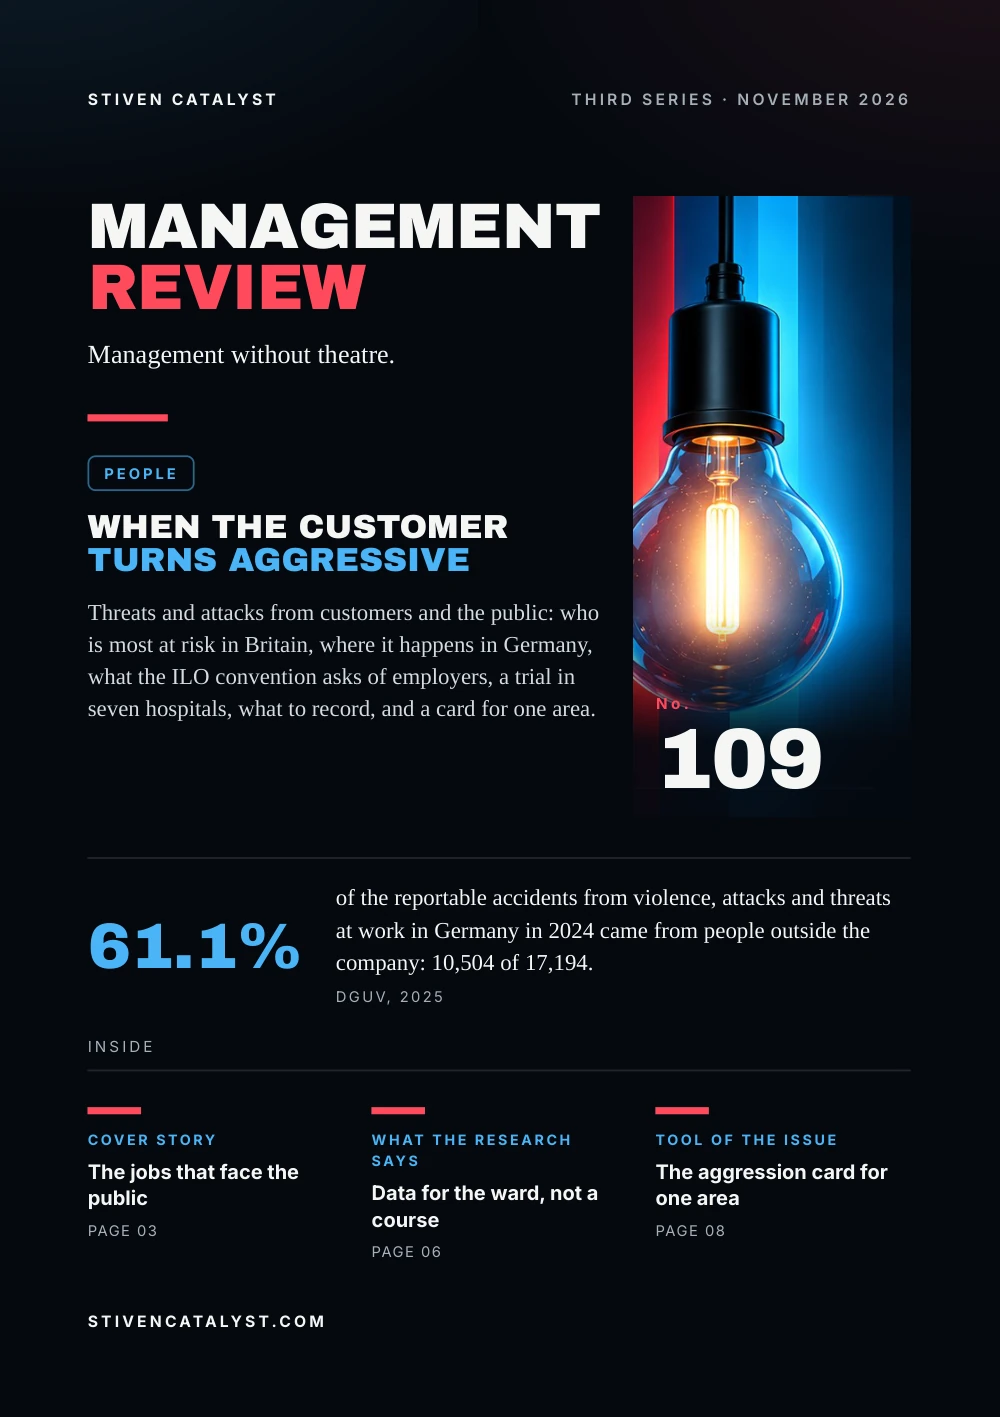
In a baggage hall, complaints stopped once the walk was longer and nobody watched others leave first. In a bank, short waits were overestimated most. Maister's eight propositions and Larson's fair queue explain why. A newsboard made the wait more interesting; a wait clock made it more accurate. In an emergency unit, feeling forgotten made the wait feel longer, whatever the minutes. A wait check at the desk closes the issue.
Management Review · Third series · November 2026 · No. 110
The wait the cust omer feels
A baggage hall where a longer walk ended the complaints, bank customers timed on video, eight propositions on how waits feel, a newsboard and a wait clock, a waiting room where people felt forgotten, and a check at the desk.
- No.
- 110
- Pages
- 10
- Sources
- 5
- Topics
- Operations
- Online since
- 7 November 2026
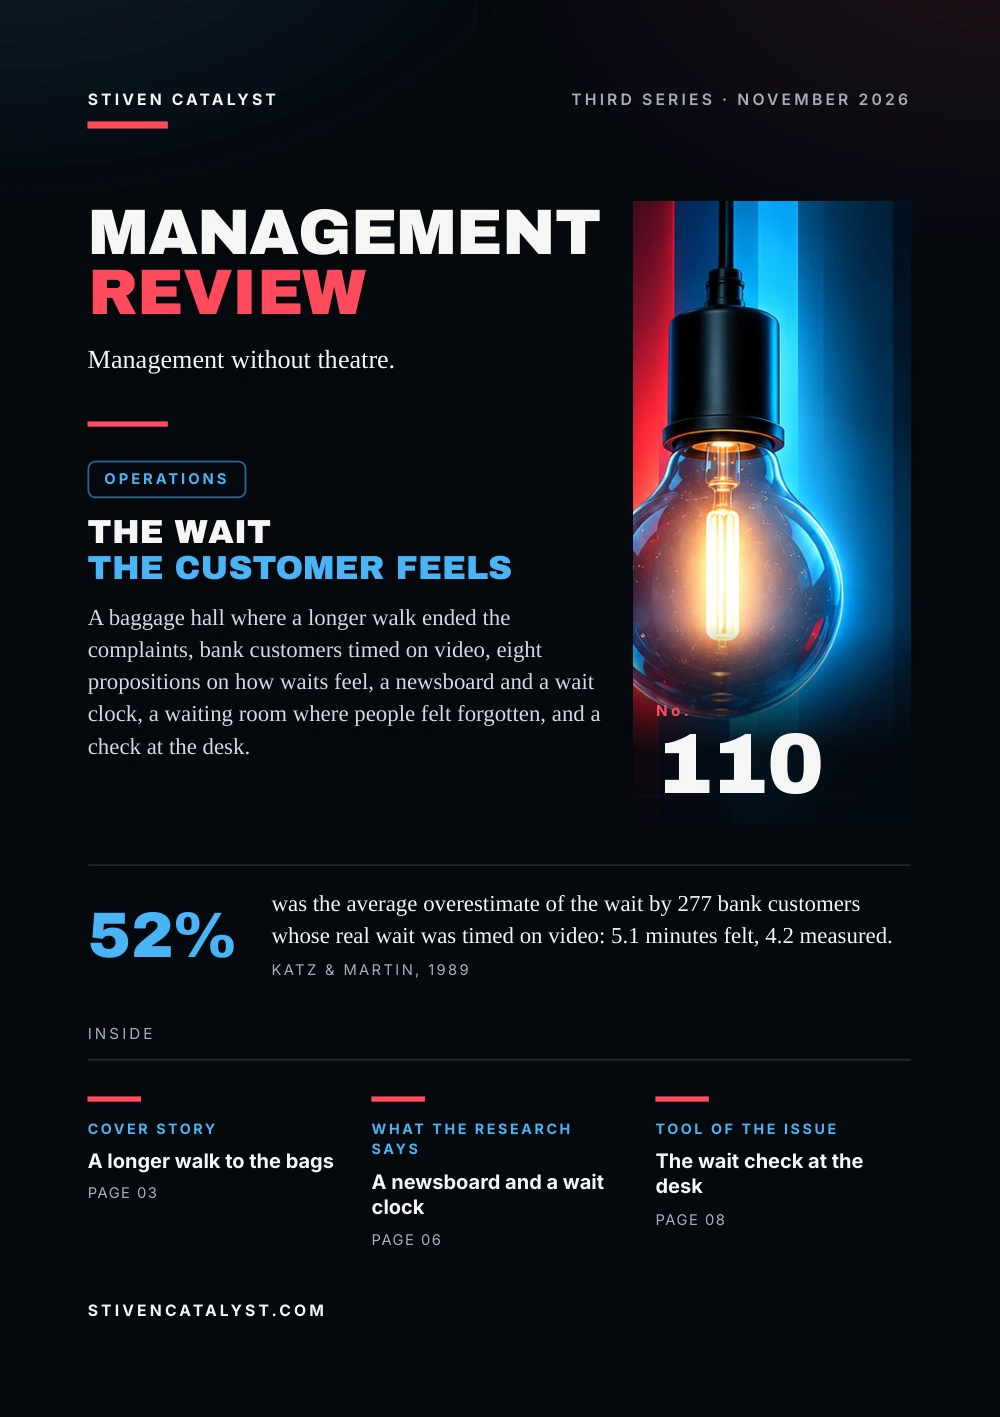
Stiven CatalystThird series · November 2026
ManagementReview
Management without theatre.
Operations
The waitthe customer feels
A baggage hall where a longer walk ended the complaints, bank customers timed on video, eight propositions on how waits feel, a newsboard and a wait clock, a waiting room where people felt forgotten, and a check at the desk.

No.110
52%
was the average overestimate of the wait by 277 bank customers whose real wait was timed on video: 5.1 minutes felt, 4.2 measured.Katz & Martin, 1989
stivencatalyst.com
No. 110 · Operations
In this issue
Operations measure the wait with a clock. The customer measures it with a mood: two minutes can feel like nothing or like forever. This issue is about the second measure, and about what changes it when the first cannot be shortened at once.
- 03Cover storyA longer walk to the bags
- 04The numbersMeasured and felt
- 05The modelEight propositions on how waits feel
- 06What the research saysA newsboard and a wait clock
- 07How it is measuredThe clock and the feeling of being forgotten
- 08Tool of the issueThe wait check at the desk
- 09SourcesSources and method
How to read this issue
Figure
Every figure has its source and year at the foot of its page.
Our reading
Where the editor interprets rather than the research, it says so.
Practice
The steps and the card are proposals to try, not research results.
Cover story
A longer walkt o the bags
Richard Larson of MIT retells a case from Houston. Passengers from the early morning flights complained about waiting for their bags. The airline hired more handlers until no bag took longer than eight minutes, the industry standard. The complaints went on.
1 + 7minutes: the walk to the carousel, then the wait at it
6minutes of walking after the change: arrival further out, the farthest carousel
Observers found that passengers with only hand luggage went straight to the taxis. Those at the carousel spent seven minutes watching people who had left the plane after them start their day first. Once the walk was longer, complaints fell to nearly zero.
Our reading
The clock was within standard. What hurt was the order: seven minutes of being overtaken. Larson calls it a slip.
Source: Richard C. Larson, Operations Research 35(6), 1987
Larson (1987), Operations Research, an essay he calls speculative; the case is Martin's (1983), which the editors did not read, from the 1980s and without a later wait at the carousel. Larson defines a slip as being served after someone who joined later.
The numbers
Measuredand felt
In 1989 Karen Katz and Blaire Martin, two of Larson's students, filmed the entry and exit of the teller line in a busy Boston bank branch and asked every third customer how long they had waited. Each answer was matched to that customer on the tape: 277 pairs of a felt and a measured wait.
Average wait in the teller line, minutes, by phase of the study (1989)
Waits under a minute were mostly not felt as waits. Answers clustered at five and ten minutes: 25% said exactly five. In the usual line, waits under four minutes were overestimated by 98% on average, those of four to twelve by 18%. A reasonable wait, customers said, was 5.9 minutes.
Our reading
The shortest waits are felt as the most inflated. A target set in minutes is met on the clock and can still be missed in the customer's head.
Source: Karen L. Katz & Blaire R. Martin, master's thesis, MIT Sloan School of Management, 1989
Katz & Martin (1989), MIT master's thesis; one branch, three phases of three days each, February–March 1989; customers who did not wait were not asked. Measured waits differed between phases. Overestimates are the average of each customer's own. Utilisation and queue length are in Volume 5 of the treatise, Little's law in No. 58.
The model
Eight propositionson how waits feel
David Maister starts from a formula: satisfaction equals perception minus expectation. Both can be managed. He then sets out eight propositions on what makes the same minutes feel longer, meant to be tested rather than taken as proven.
Empty time
feels longer than occupied time, best occupied with something tied to the service
Before it starts
the wait feels longer than once service has begun
Anxious, uncertain, unexplained
waits feel longer than calm, known, explained ones
Unfair
waits feel longer than equitable ones: someone cutting in
Value and company
people wait longer for what they value; alone feels longer than in a group
Waiting in ignorance, Maister adds, breeds irritation and rudeness towards staff. HSE describes a housing department that took down its protective screens and gave people comfortable waiting areas and better information on delays; tension and violent incidents fell.
Sources: David H. Maister, in J. A. Czepiel, M. R. Solomon & C. F. Surprenant (eds.), The Service Encounter, Lexington Books, 1985; Health and Safety Executive, 2006
Maister (1985), in The Service Encounter; the eight propositions shortened and grouped into five rows by the editors. They rest on examples, not measurements. HSE's housing department is a case in INDG69 (2006), with no figures. Aggression from customers is in No. 109.
What the research says
A newsboardand a wait clock
Katz and Martin tested two of Maister's propositions in the same branch. In the second phase, two electronic boards above the tellers showed news and weather. In the third, a sign at the entrance to the line gave the expected wait, updated every few seconds.
How interesting the wait was, 1 (boring) to 10, by measured wait (1989)
The board did not change how long the wait seemed, but it made it more interesting; satisfaction moved up, not significantly. The clock cut the felt wait for those who waited four to twelve minutes from 7.7 to 6.7, closer to the measured 6.9, but satisfaction did not rise, and more people seemed to look in and leave.
Our reading
Filling the time and announcing it do different jobs. One makes the wait easier to bear, the other makes it easier to judge, and an exact number invites a race against the clock.
Source: Karen L. Katz & Blaire R. Martin, master's thesis, MIT Sloan School of Management, 1989
Katz & Martin (1989); only customers who noticed the board (89) or the clock (72) are counted. The interest gains had p = 0.086 and 0.021; the clock effects were borderline. A new light system ran in all phases, which the authors call their main source of error. Satisfaction was near the top of the scale (9.1 of 10).
How it is measured
The clock andthe feeling of being forgot ten
In Geneva's outpatient emergency unit, Hervé Spechbach and colleagues took the time each of 509 patients saw a doctor from the hospital system and set it beside a questionnaire. The measured wait averaged 78 minutes; patients called 65 minutes the longest reasonable wait.
53.2%said the nurses had given them no waiting time
23%had felt forgotten; those who had not had three times the odds of calling the wait very short
Two stamps
arrival and first contact, from the system, per customer
The felt wait
“How long did you wait?” in minutes, beside the stamps
Told, forgotten
were you given a wait; did you feel forgotten
Source: Hervé Spechbach, Jessica Rochat, Jean-Michel Gaspoz, Christian Lovis & Frederic Ehrler, BMC Emergency Medicine 19, 2019
Spechbach et al. (2019), BMC Emergency Medicine; December 2015 to March 2016, French-speaking patients only, an untested questionnaire, no response rate. The odds ratio of 3.0 compares patients who disagreed that they felt forgotten with those who were neutral. The rows are the editors' proposal.
Tool of the issue
The wait checkat the desk
A short check whenever a line forms at the desk, by the person who runs the shift. The Guest Complaints tool has a category for the check-in wait; complaints logged there show when lines form and how they end.
01The linestart time, how many, why: a flight, a group, one long case
02Everyone seeneach person greeted, so no one waits unnoticed
03An honest estimatea time and a reason, never “in a moment”
04One fair orderone line where possible; any priority said aloud
05Time with a usewhat the guest can do now: a form, a question answered
06Work in viewevery open position serving; side tasks out of the guests' sight
Sources: David H. Maister, in J. A. Czepiel, M. R. Solomon & C. F. Surprenant (eds.), The Service Encounter, Lexington Books, 1985; Richard C. Larson, Operations Research 35(6), 1987; Karen L. Katz & Blaire R. Martin, master's thesis, MIT Sloan School of Management, 1989
The card is the editors' proposal, built on Maister (1985), Larson (1987) and the suggestions of Katz & Martin (1989), who saw customers annoyed by unstaffed windows. It has not been tested. Wait clocks are left out: in the bank, an exact number did not raise satisfaction.
Open the tool: Guest Complaintsstivencatalyst.com/tools/guest-complaints/
Sources and method
Every figurehas a source.
The figures in this issue come from the sources below. The year shows how recent each one is.
- Perspectives on Queues: Social Justice and the Psychology of QueueingRichard C. Larson, Operations Research 35(6), 1987https://doi.org/10.1287/opre.35.6.895
- Improving customer satisfaction through the management of perceptions of waitingKaren L. Katz & Blaire R. Martin, master's thesis, MIT Sloan School of Management, 1989https://hdl.handle.net/1721.1/37703
- The Psychology of Waiting LinesDavid H. Maister, in J. A. Czepiel, M. R. Solomon & C. F. Surprenant (eds.), The Service Encounter, Lexington Books, 1985https://davidmaister.com/articles/the-psychology-of-waiting-lines/
- Violence at work: a guide for employers (INDG69, rev)Health and Safety Executive, 2006https://www.hse.gov.uk/pubns/indg69.pdf
- Patients' time perception in the waiting room of an ambulatory emergency unit: a cross-sectional studyHervé Spechbach, Jessica Rochat, Jean-Michel Gaspoz, Christian Lovis & Frederic Ehrler, BMC Emergency Medicine 19, 2019https://doi.org/10.1186/s12873-019-0254-1
Editorial method
Each figure was checked for its year, its publisher and what it measures, in the full text where it could be opened. A source read only in a summary, an abstract or excerpts is marked “via”. A figure not confirmed in what was read is marked so on its page, or left out. The editor's interpretation is marked “Our reading”.
ManagementReview
Management without theatre.
Every issue, one management question, checked against the best research.
All issues
stivencatalyst.com/magazine/management-review.html
Management Review · No. 110 · November 2026 · Stiven Catalyst
Edited by Stiven Janaqi, who answers for it; “the editors” in this publication means him. Its texts, translations, layout and the checking of figures against their sources are done in working sessions with Claude, an AI model by Anthropic.
stivencatalyst.com/how-this-is-made.html
 Next publication · From the Floor
The manager in the middle
Click or swipe a page to turn it. The arrow keys work too.
Management Review · No. 110
The figures of the issue
The charts of the printed pages, with their sources.
Katz & Martin (1989), MIT master's thesis; one branch, three phases of three days each, February–March 1989; customers who did not wait were not asked. Measured waits differed between phases. Overestimates are the average of each customer's own. Utilisation and queue length are in Volume 5 of the treatise, Little's law in No. 58.
Source: Karen L. Katz & Blaire R. Martin, master's thesis, MIT Sloan School of Management, 1989
Katz & Martin (1989); only customers who noticed the board (89) or the clock (72) are counted. The interest gains had p = 0.086 and 0.021; the clock effects were borderline. A new light system ran in all phases, which the authors call their main source of error. Satisfaction was near the top of the scale (9.1 of 10).
Source: Karen L. Katz & Blaire R. Martin, master's thesis, MIT Sloan School of Management, 1989
The whole text Read the issue as text For reading on a small screen, searching or a screen reader. The same words, without the page design.
In this issue
Operations measure the wait with a clock. The customer measures it with a mood: two minutes can feel like nothing or like forever. This issue is about the second measure, and about what changes it when the first cannot be shortened at once.
In a baggage hall, complaints stopped once the walk was longer and nobody watched others leave first. In a bank, short waits were overestimated most. Maister's eight propositions and Larson's fair queue explain why. A newsboard made the wait more interesting; a wait clock made it more accurate. In an emergency unit, feeling forgotten made the wait feel longer, whatever the minutes. A wait check at the desk closes the issue.
Stiven Janaqi, Editor
Cover story
A longer walk t o the bags
Richard Larson of MIT retells a case from Houston. Passengers from the early morning flights complained about waiting for their bags. The airline hired more handlers until no bag took longer than eight minutes, the industry standard. The complaints went on.
- 1 + 7 minutes: the walk to the carousel, then the wait at it
- 6 minutes of walking after the change: arrival further out, the farthest carousel
Observers found that passengers with only hand luggage went straight to the taxis. Those at the carousel spent seven minutes watching people who had left the plane after them start their day first. Once the walk was longer, complaints fell to nearly zero.
Our reading
The clock was within standard. What hurt was the order: seven minutes of being overtaken. Larson calls it a slip.
Larson (1987), Operations Research, an essay he calls speculative; the case is Martin's (1983), which the editors did not read, from the 1980s and without a later wait at the carousel. Larson defines a slip as being served after someone who joined later.
Source: Richard C. Larson, Operations Research 35(6), 1987
The numbers
Measured and felt
In 1989 Karen Katz and Blaire Martin, two of Larson's students, filmed the entry and exit of the teller line in a busy Boston bank branch and asked every third customer how long they had waited. Each answer was matched to that customer on the tape: 277 pairs of a felt and a measured wait.
Average wait in the teller line, minutes, by phase of the study (1989): Usual line: Measured 3.6, Felt 4.7; Newsboard: Measured 4.8, Felt 6.0; Wait clock: Measured 4.3, Felt 4.6.
Waits under a minute were mostly not felt as waits. Answers clustered at five and ten minutes: 25% said exactly five. In the usual line, waits under four minutes were overestimated by 98% on average, those of four to twelve by 18%. A reasonable wait, customers said, was 5.9 minutes.
Our reading
The shortest waits are felt as the most inflated. A target set in minutes is met on the clock and can still be missed in the customer's head.
Katz & Martin (1989), MIT master's thesis; one branch, three phases of three days each, February–March 1989; customers who did not wait were not asked. Measured waits differed between phases. Overestimates are the average of each customer's own. Utilisation and queue length are in Volume 5 of the treatise, Little's law in No. 58.
Source: Karen L. Katz & Blaire R. Martin, master's thesis, MIT Sloan School of Management, 1989
The model
Eight propositions on how waits feel
David Maister starts from a formula: satisfaction equals perception minus expectation. Both can be managed. He then sets out eight propositions on what makes the same minutes feel longer, meant to be tested rather than taken as proven.
- Em
p t y time. feels longer than occupied time, best occupied with something tied to the service - Before it sta
r ts. the wait feels longer than once service has begun - Anxious, unce
r tain, unexplained. waits feel longer than calm, known, explained ones - Unfair. waits feel longer than equitable ones: someone cutting in
- Value and company. people wait longer for what they value; alone feels longer than in a group
Waiting in ignorance, Maister adds, breeds irritation and rudeness towards staff. HSE describes a housing department that took down its protective screens and gave people comfortable waiting areas and better information on delays; tension and violent incidents fell.
Maister (1985), in The Service Encounter; the eight propositions shortened and grouped into five rows by the editors. They rest on examples, not measurements. HSE's housing department is a case in INDG69 (2006), with no figures. Aggression from customers is in No. 109.
Sources: David H. Maister, in J. A. Czepiel, M. R. Solomon & C. F. Surprenant (eds.), The Service Encounter, Lexington Books, 1985; Health and Safety Executive, 2006
What the research says
A newsboard and a wait clock
Katz and Martin tested two of Maister's propositions in the same branch. In the second phase, two electronic boards above the tellers showed news and weather. In the third, a sign at the entrance to the line gave the expected wait, updated every few seconds.
How interesting the wait was, 1 (boring) to 10, by measured wait (1989): Under 4 minutes: Usual line 3.9, With the newsboard 5.0; 4 to 12 minutes: Usual line 3.8, With the newsboard 5.6.
The board did not change how long the wait seemed, but it made it more interesting; satisfaction moved up, not significantly. The clock cut the felt wait for those who waited four to twelve minutes from 7.7 to 6.7, closer to the measured 6.9, but satisfaction did not rise, and more people seemed to look in and leave.
Our reading
Filling the time and announcing it do different jobs. One makes the wait easier to bear, the other makes it easier to judge, and an exact number invites a race against the clock.
Katz & Martin (1989); only customers who noticed the board (89) or the clock (72) are counted. The interest gains had p = 0.086 and 0.021; the clock effects were borderline. A new light system ran in all phases, which the authors call their main source of error. Satisfaction was near the top of the scale (9.1 of 10).
Source: Karen L. Katz & Blaire R. Martin, master's thesis, MIT Sloan School of Management, 1989
How it is measured
The clock and the feeling of being forgot ten
In Geneva's outpatient emergency unit, Hervé Spechbach and colleagues took the time each of 509 patients saw a doctor from the hospital system and set it beside a questionnaire. The measured wait averaged 78 minutes; patients called 65 minutes the longest reasonable wait.
- 53.2% said the nurses had given them no waiting time
- 23% had felt forgotten; those who had not had three times the odds of calling the wait very short
- Two stamps. arrival and first contact, from the system, per customer
- The felt wait. “How long did you wait?” in minutes, beside the stamps
T old, forgot ten. were you given a wait; did you feel forgotten
Spechbach et al. (2019), BMC Emergency Medicine; December 2015 to March 2016, French-speaking patients only, an untested questionnaire, no response rate. The odds ratio of 3.0 compares patients who disagreed that they felt forgotten with those who were neutral. The rows are the editors' proposal.
Source: Hervé Spechbach, Jessica Rochat, Jean-Michel Gaspoz, Christian Lovis & Frederic Ehrler, BMC Emergency Medicine 19, 2019
Tool of the issue
The wait check at the desk
A short check whenever a line forms at the desk, by the person who runs the shift. The Guest Complaints tool has a category for the check-in wait; complaints logged there show when lines form and how they end.
- The line start time, how many, why: a flight, a group, one long case
- Everyone seen each person greeted, so no one waits unnoticed
- An honest estimate a time and a reason, never “in a moment”
- One fair order one line where possible; any priority said aloud
- Time with a use what the guest can do now: a form, a question answered
- Work in view every open position serving; side tasks out of the guests' sight
The card is the editors' proposal, built on Maister (1985), Larson (1987) and the suggestions of Katz & Martin (1989), who saw customers annoyed by unstaffed windows. It has not been tested. Wait clocks are left out: in the bank, an exact number did not raise satisfaction.
Sources: David H. Maister, in J. A. Czepiel, M. R. Solomon & C. F. Surprenant (eds.), The Service Encounter, Lexington Books, 1985; Richard C. Larson, Operations Research 35(6), 1987; Karen L. Katz & Blaire R. Martin, master's thesis, MIT Sloan School of Management, 1989
Open the tool: Guest Complaints
Sources and method
Every figure has a source.
The figures in this issue come from the sources below. The year shows how recent each one is.
- Richard C. Larson, Operations Research 35(6), “Perspectives on Queues: Social Justice and the Psychology of Queueing”, 1987. https://doi.org/10.1287/opre.35.6.895
- Karen L. Katz & Blaire R. Martin, master's thesis, MIT Sloan School of Management, “Improving customer satisfaction through the management of perceptions of waiting”, 1989. https://hdl.handle.net/1721.1/37703
- David H. Maister, in J. A. Czepiel, M. R. Solomon & C. F. Surprenant (eds.), The Service Encounter, Lexington Books, “The Psychology of Waiting Lines”, 1985. https://davidmaister.com/articles/the-psychology-of-waiting-lines/
- Health and Safety Executive, “Violence at work: a guide for employers (INDG69, rev)”, 2006. https://www.hse.gov.uk/pubns/indg69.pdf
- Hervé Spechbach, Jessica Rochat, Jean-Michel Gaspoz, Christian Lovis & Frederic Ehrler, BMC Emergency Medicine 19, “Patients' time perception in the waiting room of an ambulatory emergency unit: a cross-sectional study”, 2019. https://doi.org/10.1186/s12873-019-0254-1
Edit orial me thod
Each figure was checked for its year, its publisher and what it measures, in the full text where it could be opened. A source read only in a summary, an abstract or excerpts is marked “via”. A figure not confirmed in what was read is marked so on its page, or left out. The editor's interpretation is marked “Our reading”.
Edited by Stiven Janaqi, who answers for it; “the editors” in this publication means him. Its texts, translations, layout and the checking of figures against their sources are done in working sessions with Claude, an AI model by Anthropic. How this is made
Management Review · Monthly edition