Wright's rule of 1936 ties the fall in labour to doublings of the quantity made. A test on 62 technologies found it forecast best of six such laws. In a car plant, defects fell by about 70 percent in eight weeks, and the second shift began below the first. An airliner shows the other side: experience fades. A card closes the issue.
Management Review · Third series · November 2026 · No. 103
The learning curve: every repe tition counts
Wright's 80 percent, a car plant whose defects fell from about 70 to 20 a car in eight weeks, why the curve follows doublings and not the calendar, the second shift that did not start from zero, what an organisation forgets, and a card.
- No.
- 103
- Pages
- 10
- Sources
- 4
- Topics
- Strategy
- Online since
- 7 November 2026
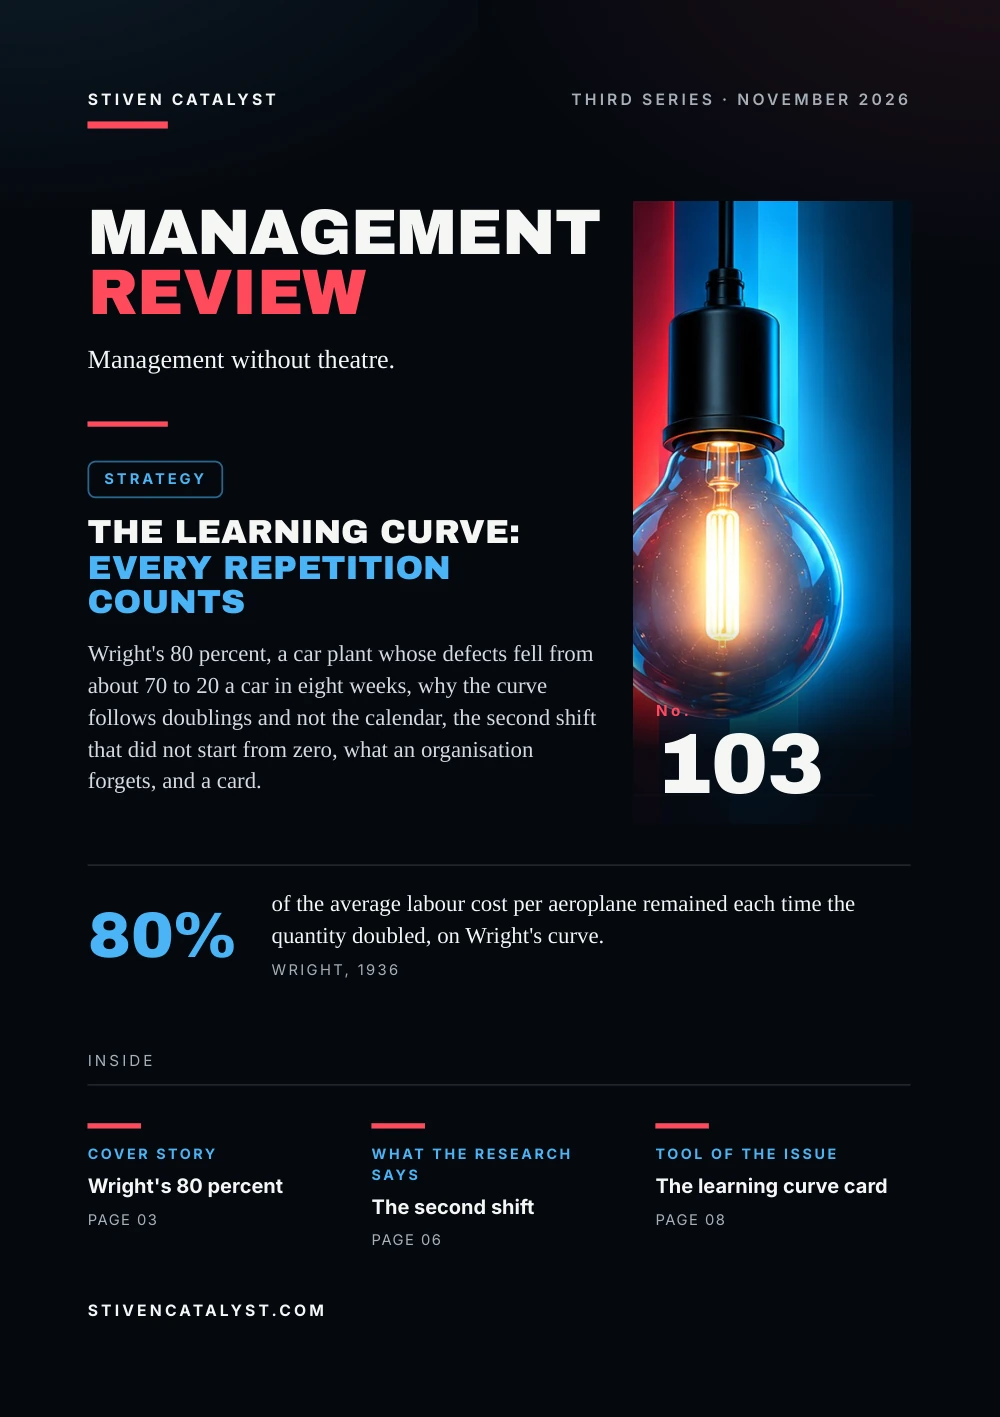
Stiven CatalystThird series · November 2026
ManagementReview
Management without theatre.
Strategy
The learning curve:every repetition counts
Wright's 80 percent, a car plant whose defects fell from about 70 to 20 a car in eight weeks, why the curve follows doublings and not the calendar, the second shift that did not start from zero, what an organisation forgets, and a card.

No.103
80%
of the average labour cost per aeroplane remained each time the quantity doubled, on Wright's curve.Wright, 1936
stivencatalyst.com
No. 103 · Strategy
In this issue
A new process, a new site, a new person: the first weeks are slow, and every plan has to guess how fast they will speed up. The guess decides staffing, targets and the patience a manager shows. This issue asks what is known about that speed, and where the learning is kept once it is made.
- 03Cover storyWright's 80 percent
- 04The numbersSeventy defects, then twenty
- 05The modelDoublings, not the calendar
- 06What the research saysThe second shift
- 07How it is measuredWhat an organisation forgets
- 08Tool of the issueThe learning curve card
- 09SourcesSources and method
How to read this issue
Figure
Every figure has its source and year at the foot of its page.
Our reading
Where the editor interprets rather than the research, it says so.
Practice
The steps and the card are proposals to try, not research results.
Cover story
Wright's80 percent
T. P. Wright began to study how cost varies with quantity in 1922, from the two or three points his firm's production of one model allowed. The curve was corrected for years as new orders came in. In February 1936 he published it in the Journal of the Aeronautical Sciences.
What remains of the cost at each doubling of the quantity, Wright's curves (1936)
On log-log paper the labour curve is a straight line. Its 80 percent is the factor by which the average labour cost for a quantity is multiplied to give the average for twice that quantity. Wright named where the fall comes from:
Practice
Workers grow more skilled with repetition, more so with time studies.
Fewer changes
Larger runs bring fewer changes to disturb the work.
Tools and set-ups
Set-up time is spread over more units, and more tooling pays.
Our reading
The rule counts units made, not weeks passed. A slow month teaches little; a busy one teaches more.
Source: T. P. Wright, Curtiss-Wright Corporation, Journal of the Aeronautical Sciences 3, 1936
Wright (1936), read in full. The bars are his factors per doubling; a lower bar means a steeper fall; the whole aeroplane's curve later flattens to 90%. Rows: his list for labour, shortened. Averages from one firm's estimating curves of the 1920s and 1930s, not measurements of today's work.
The numbers
Sevent y defects,then twent y
Steven Levitt, John List and Chad Syverson followed nearly 200,000 cars through one assembly plant of a major carmaker over a model year. The model had just been redesigned and the line reorganised into teams, so the plant was, in effect, starting over.
Average defects per car, one assembly plant, one model year (2012)
−0.3learning rate: ten times the cars, about half the defects
>80%of defects came from the fifth of stations with the most
Our reading
Most of the fall came early and from a few places. A ramp-up plan can say where to look first.
Source: Steven D. Levitt, John A. List & Chad Syverson, National Bureau of Economic Research, 2012
Levitt, List & Syverson (2012), NBER working paper, read in full; the plant and years are not named. Columns are rounded figures from their text; weeks with fewer than 100 cars are left out. The study counts defects, not cost, because line speed moved with demand.
The model
Doublings,not the calendar
Béla Nagy, Doyne Farmer, Quan Bui and Jessika Trancik tested six proposed laws of falling cost on 62 technologies, each followed for 10 to 39 years, by forecasting the past from earlier data. Wright's law, cost tied to cumulative production, gave the best forecasts; Moore's law, cost tied to time, was not far behind.
An 80% curve: average labour per unit, first unit = 100, by units made (editors' arithmetic)
Each step needs as many units as all before it, so gains look fast at first and slow later, though the rate is the same. The authors found production tends to grow exponentially; then Wright's and Moore's laws become hard to tell apart.
Our reading
A team that has done a task 500 times needs 500 more for the next step. Expecting the early pace later is the mistake.
Sources: T. P. Wright, Curtiss-Wright Corporation, Journal of the Aeronautical Sciences 3, 1936; Béla Nagy, J. Doyne Farmer, Quan M. Bui & Jessika E. Trancik, PLOS ONE 8(2), 2013
The line is the editors' arithmetic from Wright's definition (exponent 0.322), not data. Nagy et al. (2013), PLOS ONE, read in full: unit cost after inflation; forecast errors grew with the horizon for every law. The first weeks of a new process are also the subject of pilots (No. 69).
What the research says
The secondshif t
Seven weeks after the start, the plant added a second shift of new workers, trained by watching the stations for a week. It did not start at 70 defects a car. From the outset its rate was below the first shift's that same week, and over the year about 5 to 10 percent lower.
Defects per car in the last 12 weeks of the year, by model variant (2012)
A new variant did restart the learning, and while Model 3 ramped up, defects on its closest cousin rose by almost 30 percent. Absences of workers raised defects too, but only a little. The authors conclude that much of what was learned sat in the plant's physical and organisational capital rather than in particular workers.
Our reading
A new person can start near the team's level if the learning is in the station. A new product starts the curve again.
Source: Steven D. Levitt, John A. List & Chad Syverson, National Bureau of Economic Research, 2012
Levitt, List & Syverson (2012), one plant, one year. They cannot rule out that the first shift passed its knowledge on in the week of watching. The linked essay is the author's question whether results last once the manager leaves. How to teach a task is No. 42.
More in the essayWhen improvement fades
How it is measured
What an organisationforge ts
Lockheed built 250 L-1011 TriStars from 1970 to 1984, in four models, at 4 to 42 a year. Labour fell along a classic curve to unit 112, in the fifth year, at about one sixth of the first plane's hours. Then it rose. Lanier Benkard measured why.
61%of the firm's stock of experience survived one year (0.96 a month)
up to 10positions could change when one job opened, under the seniority rules
Benkard links the loss to layoffs when output fell, to rehiring new people when it rose again, and to turnover. Wright had warned of the same in 1936: a repeat order after a break costs more, because of new set-ups and labour turnover between orders.
Our reading
Count repetitions and gaps together. A task done once a month is not on the curve of a task done daily.
Sources: C. Lanier Benkard, National Bureau of Economic Research, 1999; T. P. Wright, Curtiss-Wright Corporation, Journal of the Aeronautical Sciences 3, 1936
Benkard (1999), NBER working paper, read in full; one aircraft, one firm. The 61% is his estimate for the firm's stock, not an individual's skill, and he links it partly to rarely repeated tasks. Wright estimated a repeat order between the cost for new plus 0.8 of the old quantity and that of the new order alone.
Tool of the issue
The learningcurve card
One card for each new process, site or person on a task. The Time Study tool records a task cycle after cycle; write down the times of the 1st, 2nd, 4th, 8th and 16th repetition and the curve shows itself.
01The task and its unitone repetition counted the same way each time: an order, a room, a pallet
02Times at 1, 2, 4, 8, 16or errors per unit; the same measure every time
03What remains per doublingtime at 8 divided by time at 4; near 0.8 is Wright's curve, near 1 is a plateau
04Where the learning is keptin a fixture, a layout, a written method, or only in one person
05Breaks and changesweeks without the task, a new variant, new people: expect a step back
06The target and whenthe time expected, at which repetition, set from the curve, not from the first day
Sources: T. P. Wright, Curtiss-Wright Corporation, Journal of the Aeronautical Sciences 3, 1936; Steven D. Levitt, John A. List & Chad Syverson, National Bureau of Economic Research, 2012; C. Lanier Benkard, National Bureau of Economic Research, 1999
The card is the editors' proposal, built on Wright's doublings, the plant study and Benkard's forgetting; it is not a tested instrument. How to write the method down is in No. 35; why watching is not yet being ready, in treatise volume 8.
Open the tool: Time Studystivencatalyst.com/tools/time-study/
Sources and method
Every figurehas a source.
The figures in this issue come from the sources below. The year shows how recent each one is.
- Factors Affecting the Cost of AirplanesT. P. Wright, Curtiss-Wright Corporation, Journal of the Aeronautical Sciences 3, 1936https://doi.org/10.2514/8.155
- Statistical Basis for Predicting Technological ProgressBéla Nagy, J. Doyne Farmer, Quan M. Bui & Jessika E. Trancik, PLOS ONE 8(2), 2013https://doi.org/10.1371/journal.pone.0052669
- Toward an Understanding of Learning by Doing: Evidence from an Automobile Assembly Plant (NBER Working Paper 18017)Steven D. Levitt, John A. List & Chad Syverson, National Bureau of Economic Research, 2012https://www.nber.org/papers/w18017
- Learning and Forgetting: The Dynamics of Aircraft Production (NBER Working Paper 7127)C. Lanier Benkard, National Bureau of Economic Research, 1999https://www.nber.org/papers/w7127
Editorial method
Each figure was checked for its year, its publisher and what it measures, in the full text where it could be opened. A source read only in a summary, an abstract or excerpts is marked “via”. A figure not confirmed in what was read is marked so on its page, or left out. The editor's interpretation is marked “Our reading”.
ManagementReview
Management without theatre.
Every issue, one management question, checked against the best research.
All issues
stivencatalyst.com/magazine/management-review.html
Management Review · No. 103 · November 2026 · Stiven Catalyst
Edited by Stiven Janaqi, who answers for it; “the editors” in this publication means him. Its texts, translations, layout and the checking of figures against their sources are done in working sessions with Claude, an AI model by Anthropic.
stivencatalyst.com/how-this-is-made.html
 Next issue
Someone to talk to: connection at work
Click or swipe a page to turn it. The arrow keys work too.
Management Review · No. 103
The figures of the issue
The charts of the printed pages, with their sources.
Wright (1936), read in full. The bars are his factors per doubling; a lower bar means a steeper fall; the whole aeroplane's curve later flattens to 90%. Rows: his list for labour, shortened. Averages from one firm's estimating curves of the 1920s and 1930s, not measurements of today's work.
Source: T. P. Wright, Curtiss-Wright Corporation, Journal of the Aeronautical Sciences 3, 1936
Levitt, List & Syverson (2012), NBER working paper, read in full; the plant and years are not named. Columns are rounded figures from their text; weeks with fewer than 100 cars are left out. The study counts defects, not cost, because line speed moved with demand.
Source: Steven D. Levitt, John A. List & Chad Syverson, National Bureau of Economic Research, 2012
The line is the editors' arithmetic from Wright's definition (exponent 0.322), not data. Nagy et al. (2013), PLOS ONE, read in full: unit cost after inflation; forecast errors grew with the horizon for every law. The first weeks of a new process are also the subject of pilots (No. 69).
Source: T. P. Wright, Curtiss-Wright Corporation, Journal of the Aeronautical Sciences 3, 1936
Levitt, List & Syverson (2012), one plant, one year. They cannot rule out that the first shift passed its knowledge on in the week of watching. The linked essay is the author's question whether results last once the manager leaves. How to teach a task is No. 42.
Source: Steven D. Levitt, John A. List & Chad Syverson, National Bureau of Economic Research, 2012
The whole text Read the issue as text For reading on a small screen, searching or a screen reader. The same words, without the page design.
In this issue
A new process, a new site, a new person: the first weeks are slow, and every plan has to guess how fast they will speed up. The guess decides staffing, targets and the patience a manager shows. This issue asks what is known about that speed, and where the learning is kept once it is made.
Wright's rule of 1936 ties the fall in labour to doublings of the quantity made. A test on 62 technologies found it forecast best of six such laws. In a car plant, defects fell by about 70 percent in eight weeks, and the second shift began below the first. An airliner shows the other side: experience fades. A card closes the issue.
Stiven Janaqi, Editor
Cover story
Wright's 80 percent
T. P. Wright began to study how cost varies with quantity in 1922, from the two or three points his firm's production of one model allowed. The curve was corrected for years as new orders came in. In February 1936 he published it in the Journal of the Aeronautical Sciences.
What remains of the cost at each doubling of the quantity, Wright's curves (1936): Labour 80%, Whole aeroplane, at first 83%, Purchased material 88%, Raw material 95%.
On log-log paper the labour curve is a straight line. Its 80 percent is the factor by which the average labour cost for a quantity is multiplied to give the average for twice that quantity. Wright named where the fall comes from:
- Practice. Workers grow more skilled with repetition, more so with time studies.
- Fewer changes. Larger runs bring fewer changes to disturb the work.
T ools and se t-ups. Set-up time is spread over more units, and more tooling pays.
Our reading
The rule counts units made, not weeks passed. A slow month teaches little; a busy one teaches more.
Wright (1936), read in full. The bars are his factors per doubling; a lower bar means a steeper fall; the whole aeroplane's curve later flattens to 90%. Rows: his list for labour, shortened. Averages from one firm's estimating curves of the 1920s and 1930s, not measurements of today's work.
Source: T. P. Wright, Curtiss-Wright Corporation, Journal of the Aeronautical Sciences 3, 1936
The numbers
Sevent y defects, then twent y
Steven Levitt, John List and Chad Syverson followed nearly 200,000 cars through one assembly plant of a major carmaker over a model year. The model had just been redesigned and the line reorganised into teams, so the plant was, in effect, starting over.
Average defects per car, one assembly plant, one model year (2012): Start about 70, 8 weeks on about 20, End of year about 10.
- −0.3 learning rate: ten times the cars, about half the defects
- >80% of defects came from the fifth of stations with the most
Our reading
Most of the fall came early and from a few places. A ramp-up plan can say where to look first.
Levitt, List & Syverson (2012), NBER working paper, read in full; the plant and years are not named. Columns are rounded figures from their text; weeks with fewer than 100 cars are left out. The study counts defects, not cost, because line speed moved with demand.
Source: Steven D. Levitt, John A. List & Chad Syverson, National Bureau of Economic Research, 2012
The model
Doublings, not the calendar
Béla Nagy, Doyne Farmer, Quan Bui and Jessika Trancik tested six proposed laws of falling cost on 62 technologies, each followed for 10 to 39 years, by forecasting the past from earlier data. Wright's law, cost tied to cumulative production, gave the best forecasts; Moore's law, cost tied to time, was not far behind.
An 80% curve: average labour per unit, first unit = 100, by units made (editors' arithmetic): 1 100, 2 80, 4 64, 8 51, 16 41, 32 33.
Each step needs as many units as all before it, so gains look fast at first and slow later, though the rate is the same. The authors found production tends to grow exponentially; then Wright's and Moore's laws become hard to tell apart.
Our reading
A team that has done a task 500 times needs 500 more for the next step. Expecting the early pace later is the mistake.
The line is the editors' arithmetic from Wright's definition (exponent 0.322), not data. Nagy et al. (2013), PLOS ONE, read in full: unit cost after inflation; forecast errors grew with the horizon for every law. The first weeks of a new process are also the subject of pilots (No. 69).
Sources: T. P. Wright, Curtiss-Wright Corporation, Journal of the Aeronautical Sciences 3, 1936; Béla Nagy, J. Doyne Farmer, Quan M. Bui & Jessika E. Trancik, PLOS ONE 8(2), 2013
What the research says
The second shif t
Seven weeks after the start, the plant added a second shift of new workers, trained by watching the stations for a week. It did not start at 70 defects a car. From the outset its rate was below the first shift's that same week, and over the year about 5 to 10 percent lower.
Defects per car in the last 12 weeks of the year, by model variant (2012): Models 1 and 2 about 8, Model 3, started last about 16.
A new variant did restart the learning, and while Model 3 ramped up, defects on its closest cousin rose by almost 30 percent. Absences of workers raised defects too, but only a little. The authors conclude that much of what was learned sat in the plant's physical and organisational capital rather than in particular workers.
Our reading
A new person can start near the team's level if the learning is in the station. A new product starts the curve again.
Levitt, List & Syverson (2012), one plant, one year. They cannot rule out that the first shift passed its knowledge on in the week of watching. The linked essay is the author's question whether results last once the manager leaves. How to teach a task is No. 42.
Source: Steven D. Levitt, John A. List & Chad Syverson, National Bureau of Economic Research, 2012
More in the essay: When improvement fades
How it is measured
What an organisation forge ts
Lockheed built 250 L-1011 TriStars from 1970 to 1984, in four models, at 4 to 42 a year. Labour fell along a classic curve to unit 112, in the fifth year, at about one sixth of the first plane's hours. Then it rose. Lanier Benkard measured why.
- 61% of the firm's stock of experience survived one year (0.96 a month)
- up
t o 10 positions could change when one job opened, under the seniority rules
Benkard links the loss to layoffs when output fell, to rehiring new people when it rose again, and to turnover. Wright had warned of the same in 1936: a repeat order after a break costs more, because of new set-ups and labour turnover between orders.
Our reading
Count repetitions and gaps together. A task done once a month is not on the curve of a task done daily.
Benkard (1999), NBER working paper, read in full; one aircraft, one firm. The 61% is his estimate for the firm's stock, not an individual's skill, and he links it partly to rarely repeated tasks. Wright estimated a repeat order between the cost for new plus 0.8 of the old quantity and that of the new order alone.
Sources: C. Lanier Benkard, National Bureau of Economic Research, 1999; T. P. Wright, Curtiss-Wright Corporation, Journal of the Aeronautical Sciences 3, 1936
Tool of the issue
The learning curve card
One card for each new process, site or person on a task. The Time Study tool records a task cycle after cycle; write down the times of the 1st, 2nd, 4th, 8th and 16th repetition and the curve shows itself.
- The task and its unit one repetition counted the same way each time: an order, a room, a pallet
- Times at 1, 2, 4, 8, 16 or errors per unit; the same measure every time
- What remains per doubling time at 8 divided by time at 4; near 0.8 is Wright's curve, near 1 is a plateau
- Where the learning is ke
p t in a fixture, a layout, a written method, or only in one person - Breaks and changes weeks without the task, a new variant, new people: expect a step back
- The targ
e t and when the time expected, at which repetition, set from the curve, not from the first day
The card is the editors' proposal, built on Wright's doublings, the plant study and Benkard's forgetting; it is not a tested instrument. How to write the method down is in No. 35; why watching is not yet being ready, in treatise volume 8.
Sources: T. P. Wright, Curtiss-Wright Corporation, Journal of the Aeronautical Sciences 3, 1936; Steven D. Levitt, John A. List & Chad Syverson, National Bureau of Economic Research, 2012; C. Lanier Benkard, National Bureau of Economic Research, 1999
Open the tool: Time Study
Sources and method
Every figure has a source.
The figures in this issue come from the sources below. The year shows how recent each one is.
- T. P. Wright, Curtiss-Wright Corporation, Journal of the Aeronautical Sciences 3, “Factors Affecting the Cost of Airplanes”, 1936. https://doi.org/10.2514/8.155
- Béla Nagy, J. Doyne Farmer, Quan M. Bui & Jessika E. Trancik, PLOS ONE 8(2), “Statistical Basis for Predicting Technological Progress”, 2013. https://doi.org/10.1371/journal.pone.0052669
- Steven D. Levitt, John A. List & Chad Syverson, National Bureau of Economic Research, “Toward an Understanding of Learning by Doing: Evidence from an Automobile Assembly Plant (NBER Working Paper 18017)”, 2012. https://www.nber.org/papers/w18017
- C. Lanier Benkard, National Bureau of Economic Research, “Learning and Forgetting: The Dynamics of Aircraft Production (NBER Working Paper 7127)”, 1999. https://www.nber.org/papers/w7127
Edit orial me thod
Each figure was checked for its year, its publisher and what it measures, in the full text where it could be opened. A source read only in a summary, an abstract or excerpts is marked “via”. A figure not confirmed in what was read is marked so on its page, or left out. The editor's interpretation is marked “Our reading”.
Edited by Stiven Janaqi, who answers for it; “the editors” in this publication means him. Its texts, translations, layout and the checking of figures against their sources are done in working sessions with Claude, an AI model by Anthropic. How this is made
Management Review · Monthly edition