In Great Britain slips, trips and falls on the level cause 30% of reported injuries but 46% of the specified ones, which are mostly fractures. In Germany they were 24.1% of reportable accidents in 2024; half on floors and walkways. Free slip-resistant shoes cut slipping injuries in school kitchens from 3.54 to 1.18 per 10,000 worker-months. Prevention works in three layers. A floor walk for the end of the shift closes the issue.
Management Review · Third series · November 2026 · No. 100
Slips, trips and falls: the ordinary accident
Why the fall on the level is the most common accident, where it happens in Germany, a trial with free slip-resistant shoes, three layers of prevention, and a floor walk at the end of the shift.
- No.
- 100
- Pages
- 10
- Sources
- 5
- Topics
- Operations
- Online since
- 3 November 2026
Stiven CatalystThird series · November 2026
ManagementReview
Management without theatre.
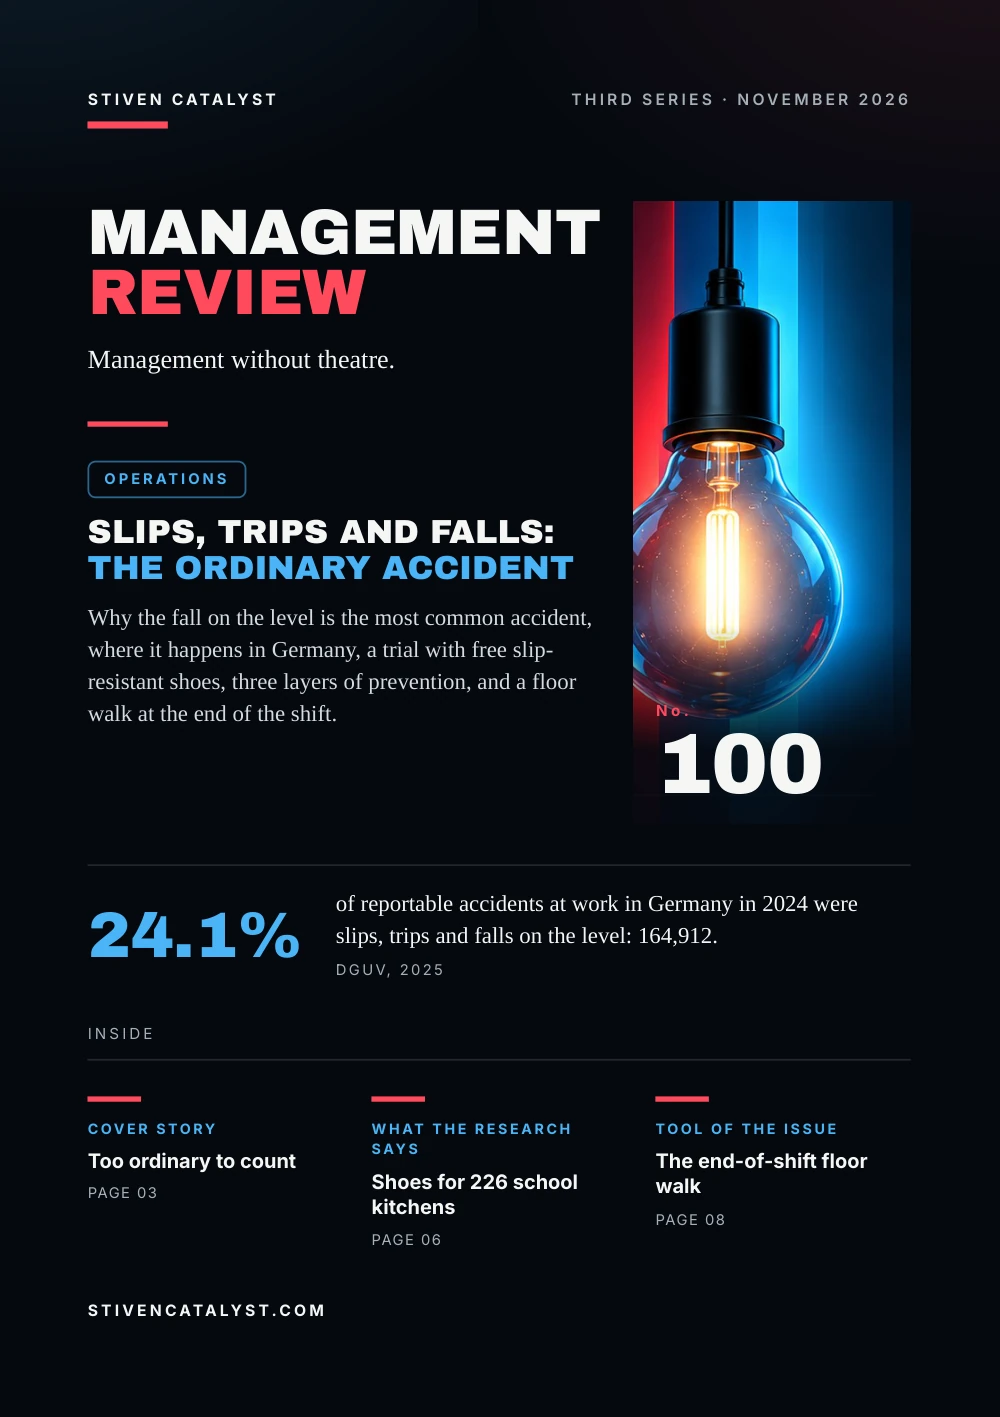
Operations
Slips, trips and falls:the ordinary accident
Why the fall on the level is the most common accident, where it happens in Germany, a trial with free slip-resistant shoes, three layers of prevention, and a floor walk at the end of the shift.

No.100
24.1%
of reportable accidents at work in Germany in 2024 were slips, trips and falls on the level: 164,912.DGUV, 2025
stivencatalyst.com
No. 100 · Operations
In this issue
A fall from a roof gets an investigation. A fall over a cable or on a wet floor gets a plaster and a note. This hundredth issue is about the accident that is too ordinary to count, and about order on the floor treated as a standard of the operation, not as cleaning.
- 03Cover storyToo ordinary to count
- 04The numbersWhere people fall in Germany
- 05The modelThree layers of prevention
- 06What the research saysShoes for 226 school kitchens
- 07How it is measuredMap the falls, not only count them
- 08Tool of the issueThe end-of-shift floor walk
- 09SourcesSources and method
How to read this issue
Figure
Every figure has its source and year at the foot of its page.
Our reading
Where the editor interprets rather than the research, it says so.
Practice
The steps and the card are proposals to try, not research results.
Cover story
T oo ordinaryt o count
HSE's statistics for 2024/25 put slips, trips and falls on the same level first among the injuries employers report, in most sectors. Together with handling injuries they make about half of all reports, yet only 1% of the deaths at work over five years. That is why they look minor.
Share of each kind of injury reported by employers, Great Britain, 2024/25
Specified injuries are a fixed list in British law; around 90% of them are fractures. Nearly half of these specified injuries came from a slip, trip or fall on the level.
Our reading
Rare deaths make the fall look small. The fractures and the weeks off say otherwise.
Source: Health and Safety Executive, 2025
HSE, RIDDOR reports to employees, 2024/25, provisional; reporting is estimated at about half. Each bar is a kind's share of one category. The overall ranking of kinds, slips 30% and handling 17%, is in No. 15; lifting in No. 99.
The numbers
Where people fallin Germany
The German statutory accident insurance counts slips, trips and falls on the level apart from falls from height. In 2024 they were 164,912 of 685,543 reportable accidents at work, those with at least four days off or a death.
24.1%of reportable accidents at work
27.1%of new accident pensions; in 68% of these the injury was a fracture
Slips, trips and falls by what the person fell on, Germany, 2024
Within floors, about 13,500 falls were on a surface wet from water, rain, snow or ice, and about 4,800 on oil or grease. Most injuries were to the ankle and foot (38%) or the knee and lower leg (21%).
Source: Deutsche Gesetzliche Unfallversicherung (DGUV), Referat Statistik und Datenanalyse, 2025
DGUV, Statistik Arbeitsunfallgeschehen 2024 (2025), tables 4 and 44: employees and entrepreneurs, accidents during work, extrapolated from a sample. Bars are shares of the 164,912; the rest are other objects. Ladder cases here are slips and trips, not falls from height.
The model
Three layersof prevention
In their review for the journal Ergonomics, Wen-Ruey Chang and colleagues set out prevention in three layers, after Haslam and Stubbs: design the hazard out, reduce what remains, and help people cope with what is left. Housekeeping sits in the middle layer.
Design out
- slip-resistant flooring
- walkways without trip hazards
- enough storage, good light
Reduce
- sustainable cleaning and inspection
- mark what cannot be removed
- no rushing, no awkward loads
Help people
- footwear for the floor
- eyesight, balance
- fatigue on shifts
The review warns that cleaning routines tend to slip back over time, so they must be built to last. It describes a fast-food chain where clean floors depended on the detergent head office chose, on how it was used locally, and on supervision amid high staff turnover.
Our reading
A wet floor is the last link of a chain that starts with a leak, a detergent or a rushed task. Fix the chain, not only the floor.
Source: Wen-Ruey Chang, Sylvie Leclercq, Thurmon E. Lockhart & Roger Haslam, Ergonomics 59(7), 2016
Layers and items from table 2 of Chang et al. (2016), adapted from Haslam and Stubbs (2006), shortened by the editors. The authors add that evidence for the single elements and their priority is sparse. Fatigue is in No. 89.
What the research says
Shoes for 226school kit chens
Jennifer Bell and colleagues at NIOSH randomised 226 US school districts whose kitchens were run by one food service company. In one group, workers could get slip-resistant shoes free of charge from August 2011; in the other they kept buying their own. 16,949 workers took part over 53 months.
Slipping injury claims per 10,000 worker-months
The odds of a slipping injury fell by 67% in the shoe group, while they rose in the other, and the difference held after adjustment for age. Earlier, in three US hospitals, a programme of eleven measures from dry floors to lighting went with a fall of over 50% in claims, as Chang and colleagues report it.
Our reading
The shoes worked where the employer paid and nearly everyone signed up. A rule that people pay for themselves is a weaker rule.
Sources: Jennifer L. Bell, James W. Collins & Sharon Chiou, Scandinavian Journal of Work, Environment & Health 45(2), 2019; Wen-Ruey Chang, Sylvie Leclercq, Thurmon E. Lockhart & Roger Haslam, Ergonomics 59(7), 2016
Bell et al. (2019), cluster randomised; outcome: compensation claims for slips on wet or greasy floors indoors. 94% of workers took part; whether the injured wore the shoes is not known. The hospital study (2008) was not read; its result as Chang et al. (2016) give it.
How it is measured
Map the falls,not only count them
A count of falls tells you there is a problem. Where they happen tells you what to fix. HSE points to a mapping tool for finding the hot spots of slips and trips; the DGUV sorts them by place and by what the person fell on.
Where
a cross on the floor plan: door, ramp, kitchen, stairs, car park
Underfoot
water, grease, ice, an object, a cable, an edge, a worn mat
Doing what
carrying, hurrying, looking elsewhere, cleaning in progress
When
hour, shift, weather; winter quarters stand out in the German data
Near misses too
a slip without a fall goes on the same plan
Our reading
Three crosses at the same door are one problem with an address. That is where the next action goes.
Sources: Health and Safety Executive, 2012; Deutsche Gesetzliche Unfallversicherung (DGUV), Referat Statistik und Datenanalyse, 2025
The fields are the editors' selection, built on HSE's mapping advice in INDG225 and the DGUV's categories; the winter peak is the DGUV's finding for 2021–2024 commuting falls. Near misses are in No. 63, the safety cross and rates in No. 87.
Tool of the issue
The end-of-shif tfloor walk
One walk per area at the end of each shift, by the person who owns that area, with what is found handed over by name. The 5S Audit tool scores the same area over time and turns findings into actions with an owner.
01Area, time, ownerone area per card; who walks it
02Floors clean and dryspills, leaks, where cleaning left the floor wet, the right detergent
03Walkways clearboxes, pallets, cables, trolleys parked in the way
04Surfaces and lightdamaged floor or mats, steps and edges visible, lamps working
05Entrances and weathermatting in place, rain or ice plan for the next shift
06Open findingswhat, where, who fixes it, by when; handed over by name
Sources: Health and Safety Executive, 2012; Wen-Ruey Chang, Sylvie Leclercq, Thurmon E. Lockhart & Roger Haslam, Ergonomics 59(7), 2016
The card is the editors' proposal, built on HSE's practical steps in INDG225 and the layers in Chang et al. (2016). The essay linked below gives the author's own end-of-shift check for one area.
More in the essay6S without a poster: order you can see
Open the tool: 5S Auditstivencatalyst.com/tools/five-s-audit/
Sources and method
Every figurehas a source.
The figures in this issue come from the sources below. The year shows how recent each one is.
- Kind of accident statistics in Great Britain, 2025Health and Safety Executive, 2025https://www.hse.gov.uk/statistics/assets/docs/kinds-of-accident.pdf
- Statistik Arbeitsunfallgeschehen 2024Deutsche Gesetzliche Unfallversicherung (DGUV), Referat Statistik und Datenanalyse, 2025https://publikationen.dguv.de/statistiken/arbeitsunfallgeschehen/5157/arbeitsunfallgeschehen-2024
- State of science: occupational slips, trips and falls on the same levelWen-Ruey Chang, Sylvie Leclercq, Thurmon E. Lockhart & Roger Haslam, Ergonomics 59(7), 2016https://doi.org/10.1080/00140139.2016.1157214
- Effectiveness of a no-cost-to-workers, slip-resistant footwear program for reducing slipping-related injuries in food service workers: a cluster randomized trialJennifer L. Bell, James W. Collins & Sharon Chiou, Scandinavian Journal of Work, Environment & Health 45(2), 2019https://doi.org/10.5271/sjweh.3790
- Preventing slips and trips at work: a brief guide (INDG225, rev2)Health and Safety Executive, 2012https://www.hse.gov.uk/pubns/indg225.pdf
Editorial method
Each figure was checked for its year, its publisher and what it measures, in the full text where it could be opened. A source read only in a summary, an abstract or excerpts is marked “via”. A figure not confirmed in what was read is marked so on its page, or left out. The editor's interpretation is marked “Our reading”.
ManagementReview
Management without theatre.
Every issue, one management question, checked against the best research.
All issues
stivencatalyst.com/magazine/management-review.html
Management Review · No. 100 · November 2026 · Stiven Catalyst
Edited by Stiven Janaqi, who answers for it; “the editors” in this publication means him. Its texts, translations, layout and the checking of figures against their sources are done in working sessions with Claude, an AI model by Anthropic.
stivencatalyst.com/how-this-is-made.html
 Next issue
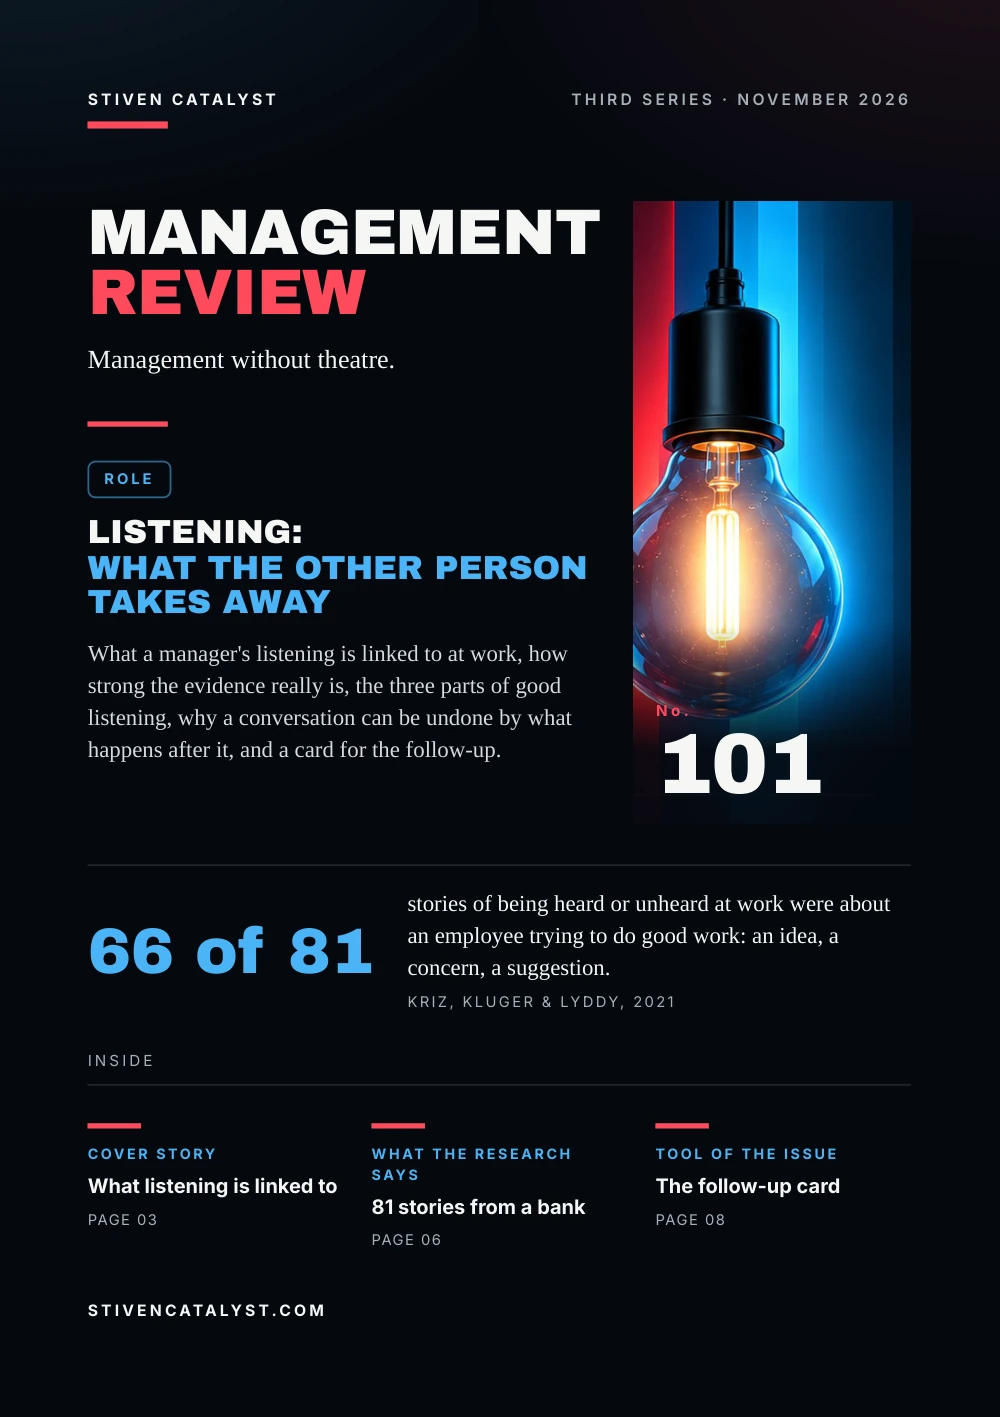
Listening: what the other person takes away
Click or swipe a page to turn it. The arrow keys work too.
Management Review · No. 100
The figures of the issue
The charts of the printed pages, with their sources.
HSE, RIDDOR reports to employees, 2024/25, provisional; reporting is estimated at about half. Each bar is a kind's share of one category. The overall ranking of kinds, slips 30% and handling 17%, is in No. 15; lifting in No. 99.
Source: Health and Safety Executive, 2025
DGUV, Statistik Arbeitsunfallgeschehen 2024 (2025), tables 4 and 44: employees and entrepreneurs, accidents during work, extrapolated from a sample. Bars are shares of the 164,912; the rest are other objects. Ladder cases here are slips and trips, not falls from height.
Source: Deutsche Gesetzliche Unfallversicherung (DGUV), Referat Statistik und Datenanalyse, 2025
Bell et al. (2019), cluster randomised; outcome: compensation claims for slips on wet or greasy floors indoors. 94% of workers took part; whether the injured wore the shoes is not known. The hospital study (2008) was not read; its result as Chang et al. (2016) give it.
Source: Jennifer L. Bell, James W. Collins & Sharon Chiou, Scandinavian Journal of Work, Environment & Health 45(2), 2019
The whole text Read the issue as text For reading on a small screen, searching or a screen reader. The same words, without the page design.
In this issue
A fall from a roof gets an investigation. A fall over a cable or on a wet floor gets a plaster and a note. This hundredth issue is about the accident that is too ordinary to count, and about order on the floor treated as a standard of the operation, not as cleaning.
In Great Britain slips, trips and falls on the level cause 30% of reported injuries but 46% of the specified ones, which are mostly fractures. In Germany they were 24.1% of reportable accidents in 2024; half on floors and walkways. Free slip-resistant shoes cut slipping injuries in school kitchens from 3.54 to 1.18 per 10,000 worker-months. Prevention works in three layers. A floor walk for the end of the shift closes the issue.
Stiven Janaqi, Editor
Cover story
T oo ordinary t o count
HSE's statistics for 2024/25 put slips, trips and falls on the same level first among the injuries employers report, in most sectors. Together with handling injuries they make about half of all reports, yet only 1% of the deaths at work over five years. That is why they look minor.
Share of each kind of injury reported by employers, Great Britain, 2024/25: Slip, trip or fall on the same level: Over 7 days off 24%, Specified, mostly fractures 46%; Handling, lifting or carrying: Over 7 days off 22%, Specified, mostly fractures 5%.
Specified injuries are a fixed list in British law; around 90% of them are fractures. Nearly half of these specified injuries came from a slip, trip or fall on the level.
Our reading
Rare deaths make the fall look small. The fractures and the weeks off say otherwise.
HSE, RIDDOR reports to employees, 2024/25, provisional; reporting is estimated at about half. Each bar is a kind's share of one category. The overall ranking of kinds, slips 30% and handling 17%, is in No. 15; lifting in No. 99.
Source: Health and Safety Executive, 2025
The numbers
Where people fall in Germany
The German statutory accident insurance counts slips, trips and falls on the level apart from falls from height. In 2024 they were 164,912 of 685,543 reportable accidents at work, those with at least four days off or a death.
- 24.1% of reportable accidents at work
- 27.1% of new accident pensions; in 68% of these the injury was a fracture
Slips, trips and falls by what the person fell on, Germany, 2024: Floors, surfaces, walkways 52.0%, Stairs 19.5%, Ladders and steps 2.8%, Pallets 1.5%.
Within floors, about 13,500 falls were on a surface wet from water, rain, snow or ice, and about 4,800 on oil or grease. Most injuries were to the ankle and foot (38%) or the knee and lower leg (21%).
DGUV, Statistik Arbeitsunfallgeschehen 2024 (2025), tables 4 and 44: employees and entrepreneurs, accidents during work, extrapolated from a sample. Bars are shares of the 164,912; the rest are other objects. Ladder cases here are slips and trips, not falls from height.
Source: Deutsche Gesetzliche Unfallversicherung (DGUV), Referat Statistik und Datenanalyse, 2025
The model
Three layers of prevention
In their review for the journal Ergonomics, Wen-Ruey Chang and colleagues set out prevention in three layers, after Haslam and Stubbs: design the hazard out, reduce what remains, and help people cope with what is left. Housekeeping sits in the middle layer.
Design out
- slip-resistant flooring
- walkways without trip hazards
- enough storage, good light
Reduce
- sustainable cleaning and inspection
- mark what cannot be removed
- no rushing, no awkward loads
Help people
- footwear for the floor
- eyesight, balance
- fatigue on shifts
The review warns that cleaning routines tend to slip back over time, so they must be built to last. It describes a fast-food chain where clean floors depended on the detergent head office chose, on how it was used locally, and on supervision amid high staff turnover.
Our reading
A wet floor is the last link of a chain that starts with a leak, a detergent or a rushed task. Fix the chain, not only the floor.
Layers and items from table 2 of Chang et al. (2016), adapted from Haslam and Stubbs (2006), shortened by the editors. The authors add that evidence for the single elements and their priority is sparse. Fatigue is in No. 89.
Source: Wen-Ruey Chang, Sylvie Leclercq, Thurmon E. Lockhart & Roger Haslam, Ergonomics 59(7), 2016
What the research says
Shoes for 226 school kit chens
Jennifer Bell and colleagues at NIOSH randomised 226 US school districts whose kitchens were run by one food service company. In one group, workers could get slip-resistant shoes free of charge from August 2011; in the other they kept buying their own. 16,949 workers took part over 53 months.
Slipping injury claims per 10,000 worker-months: Free shoes: Before (24 months) 3.54, After (29 months) 1.18; Usual practice: Before (24 months) 2.01, After (29 months) 2.30.
The odds of a slipping injury fell by 67% in the shoe group, while they rose in the other, and the difference held after adjustment for age. Earlier, in three US hospitals, a programme of eleven measures from dry floors to lighting went with a fall of over 50% in claims, as Chang and colleagues report it.
Our reading
The shoes worked where the employer paid and nearly everyone signed up. A rule that people pay for themselves is a weaker rule.
Bell et al. (2019), cluster randomised; outcome: compensation claims for slips on wet or greasy floors indoors. 94% of workers took part; whether the injured wore the shoes is not known. The hospital study (2008) was not read; its result as Chang et al. (2016) give it.
Sources: Jennifer L. Bell, James W. Collins & Sharon Chiou, Scandinavian Journal of Work, Environment & Health 45(2), 2019; Wen-Ruey Chang, Sylvie Leclercq, Thurmon E. Lockhart & Roger Haslam, Ergonomics 59(7), 2016
How it is measured
Map the falls, not only count them
A count of falls tells you there is a problem. Where they happen tells you what to fix. HSE points to a mapping tool for finding the hot spots of slips and trips; the DGUV sorts them by place and by what the person fell on.
- Where. a cross on the floor plan: door, ramp, kitchen, stairs, car park
- Underfoot. water, grease, ice, an object, a cable, an edge, a worn mat
- Doing what. carrying, hurrying, looking elsewhere, cleaning in progress
- When. hour, shift, weather; winter quarters stand out in the German data
- Near misses
t oo. a slip without a fall goes on the same plan
Our reading
Three crosses at the same door are one problem with an address. That is where the next action goes.
The fields are the editors' selection, built on HSE's mapping advice in INDG225 and the DGUV's categories; the winter peak is the DGUV's finding for 2021–2024 commuting falls. Near misses are in No. 63, the safety cross and rates in No. 87.
Sources: Health and Safety Executive, 2012; Deutsche Gesetzliche Unfallversicherung (DGUV), Referat Statistik und Datenanalyse, 2025
Tool of the issue
The end-of-shif t floor walk
One walk per area at the end of each shift, by the person who owns that area, with what is found handed over by name. The 5S Audit tool scores the same area over time and turns findings into actions with an owner.
- Area, time, owner one area per card; who walks it
- Floors clean and dry spills, leaks, where cleaning left the floor wet, the right detergent
- Walkways clear boxes, pallets, cables, trolleys parked in the way
- Surfaces and light damaged floor or mats, steps and edges visible, lamps working
- Entrances and weather matting in place, rain or ice plan for the next shift
- Open findings what, where, who fixes it, by when; handed over by name
The card is the editors' proposal, built on HSE's practical steps in INDG225 and the layers in Chang et al. (2016). The essay linked below gives the author's own end-of-shift check for one area.
Sources: Health and Safety Executive, 2012; Wen-Ruey Chang, Sylvie Leclercq, Thurmon E. Lockhart & Roger Haslam, Ergonomics 59(7), 2016
More in the essay: 6S without a poster: order you can see
Open the tool: 5S Audit
Sources and method
Every figure has a source.
The figures in this issue come from the sources below. The year shows how recent each one is.
- Health and Safety Executive, “Kind of accident statistics in Great Britain, 2025”, 2025. https://www.hse.gov.uk/statistics/assets/docs/kinds-of-accident.pdf
- Deutsche Gesetzliche Unfallversicherung (DGUV), Referat Statistik und Datenanalyse, “Statistik Arbeitsunfallgeschehen 2024”, 2025. https://publikationen.dguv.de/statistiken/arbeitsunfallgeschehen/5157/arbeitsunfallgeschehen-2024
- Wen-Ruey Chang, Sylvie Leclercq, Thurmon E. Lockhart & Roger Haslam, Ergonomics 59(7), “State of science: occupational slips, trips and falls on the same level”, 2016. https://doi.org/10.1080/00140139.2016.1157214
- Jennifer L. Bell, James W. Collins & Sharon Chiou, Scandinavian Journal of Work, Environment & Health 45(2), “Effectiveness of a no-cost-to-workers, slip-resistant footwear program for reducing slipping-related injuries in food service workers: a cluster randomized trial”, 2019. https://doi.org/10.5271/sjweh.3790
- Health and Safety Executive, “Preventing slips and trips at work: a brief guide (INDG225, rev2)”, 2012. https://www.hse.gov.uk/pubns/indg225.pdf
Edit orial me thod
Each figure was checked for its year, its publisher and what it measures, in the full text where it could be opened. A source read only in a summary, an abstract or excerpts is marked “via”. A figure not confirmed in what was read is marked so on its page, or left out. The editor's interpretation is marked “Our reading”.
Edited by Stiven Janaqi, who answers for it; “the editors” in this publication means him. Its texts, translations, layout and the checking of figures against their sources are done in working sessions with Claude, an AI model by Anthropic. How this is made
Management Review · Monthly edition