At a cattle show in Plymouth, 787 visitors each wrote a guess on a card; the middle one missed the ox's weight by 0.8%. In Zurich, 144 students were paid for accurate answers. Seeing the others' estimates narrowed their range, did not make the group significantly more accurate, and made them surer. In a web experiment with 1,360 people, exchange did help when every voice weighed the same, and hurt when one well-connected person was far from the truth. A card turns this into a routine for estimates.
Management Review · Third series · November 2026 · No. 83
Estimate first, then discuss
Galton's ox at Plymouth, why one wild guess can spoil an average, three ways seeing others' answers weakens a crowd, when exchange helps, and a card for independent estimates.
- No.
- 83
- Pages
- 10
- Sources
- 3
- Topics
- Strategy
- Online since
- 1 November 2026
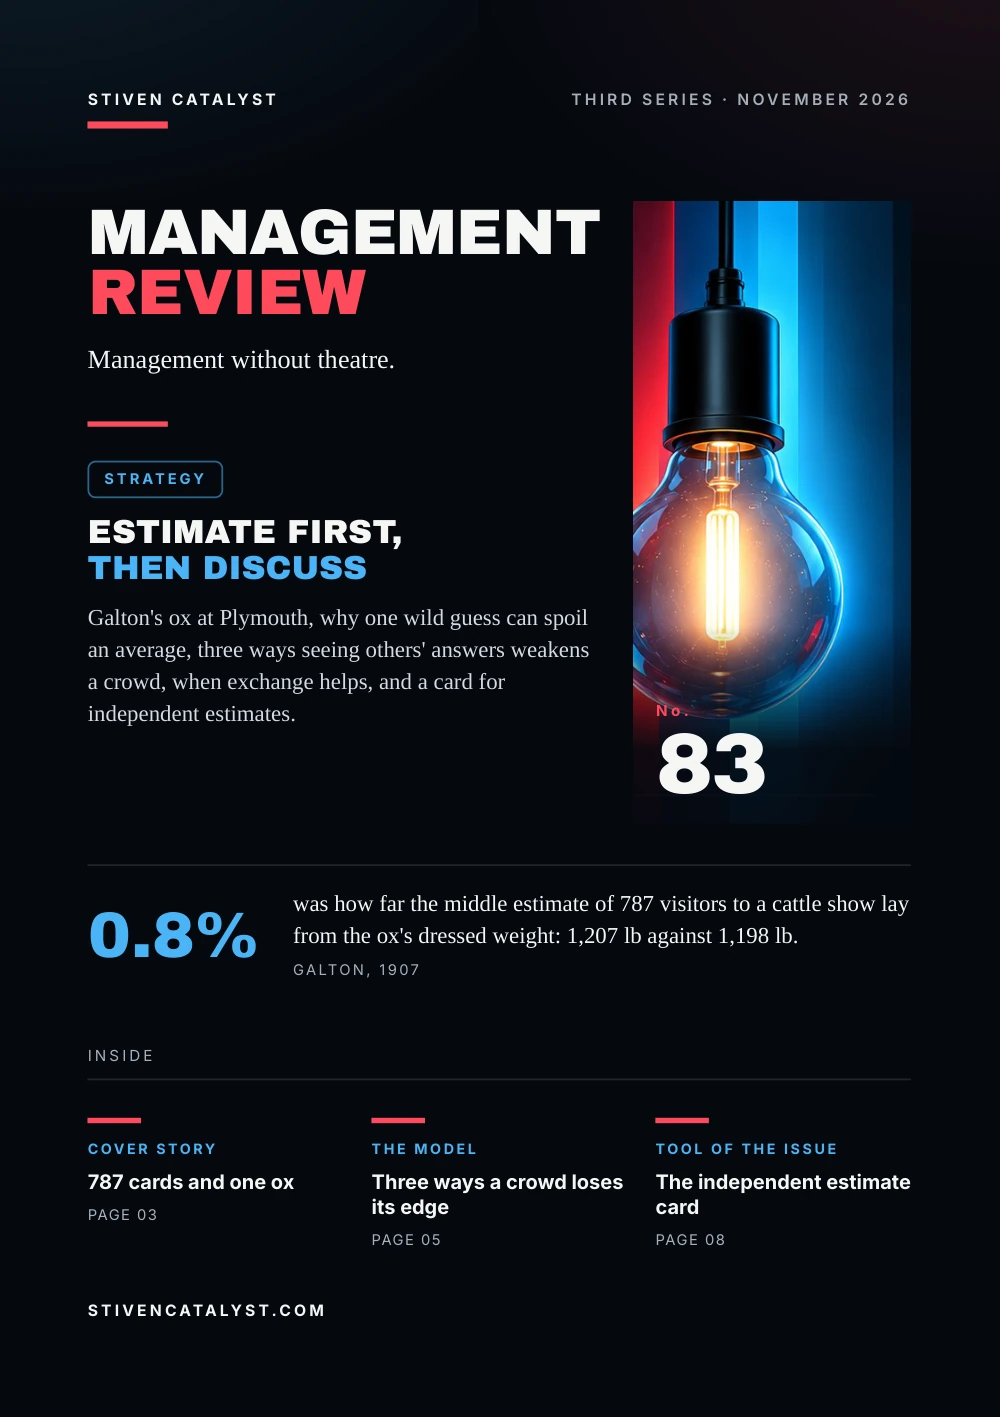
Stiven CatalystThird series · November 2026
ManagementReview
Management without theatre.
Strategy
Estimate first,then discuss
Galton's ox at Plymouth, why one wild guess can spoil an average, three ways seeing others' answers weakens a crowd, when exchange helps, and a card for independent estimates.

No.83
0.8%
was how far the middle estimate of 787 visitors to a cattle show lay from the ox's dressed weight: 1,207 lb against 1,198 lb.Galton, 1907
stivencatalyst.com
No. 83 · Strategy
In this issue
Many planning meetings start with someone saying a number. After that, the others tend to talk around it. The research on the wisdom of crowds asks a simple question: what is a group's estimate worth if its members have already heard each other?
- 03Cover story787 cards and one ox
- 04The numbersThe average that misleads
- 05The modelThree ways a crowd loses its edge
- 06What the research saysNot all influence is the same
- 07How it is measuredIs the group still wise?
- 08Tool of the issueThe independent estimate card
- 09SourcesSources and method
How to read this issue
Figure
Every figure has its source and year at the foot of its page.
Our reading
Where the editor interprets rather than the research, it says so.
Practice
The steps and the card are proposals to try, not research results.
Cover story
787 cardsand one ox
In March 1907 Francis Galton described in Nature a weight-judging competition at the West of England Fat Stock and Poultry Exhibition in Plymouth. For sixpence, visitors wrote on a card what a fat ox would weigh once slaughtered and dressed.
≈800cards were issued; Galton set 13 aside as defective or illegible
1,207 lbthe middle estimate of the 787 that remained
1,198 lbthe dressed weight of the ox
Galton took the middlemost estimate, as in a vote in which every other estimate is outvoted as too high or too low. It was 9 lb, or 0.8%, too high. Half of the cards lay between 29 lb below and 45 lb above it. He gave one reason the material was good:
“The judgments were unbiassed by passion and uninfluenced by oratory and the like.”
Our reading
The crowd was not wise because it talked. It was wise because each card was written before anyone could hear a speech.
Source: Francis Galton, Nature 75 (No. 1949), 1907
Galton, Nature 75, 7 March 1907, pp. 450–451. He reports the middlemost estimate, the median; we use only his figures. The quote is his; the translations are ours.
The numbers
The averagethat misleads
Jan Lorenz, Heiko Rauhut and colleagues at ETH Zurich put six factual questions to 144 students, in 12 sessions of 12. One asked for the length of the border between Switzerland and Italy. Payment rewarded only accuracy, not agreeing with others.
How often the group figure beat the individual estimates (2011)
Answers to such questions are skewed to the right: a few very high guesses pull the plain average away from the truth. The geometric mean, an average taken on a logarithmic scale, resists them, as does the median Galton used.
Our reading
Before averaging a team's estimates, look at the spread. One wild number can move the average more than ten sensible ones.
Source: Jan Lorenz, Heiko Rauhut, Frank Schweitzer & Dirk Helbing, PNAS 108(22), 2011
Share of cases in which the group figure was closer to the truth than individual estimates: the plain average against first estimates, the geometric mean on logarithms. 144 subjects, six questions. Read in the full text.
The model
Three waysa crowd loses its edge
Each question ran for five rounds. In the control condition nobody saw anything. In the others, subjects saw the average of the previous round, or every estimate so far. The authors' finding:
“Even mild social influence can undermine the wisdom of crowd effect.”
Social influence effect
The estimates move closer together; the group's collective error does not fall significantly.
Range reduction effect
The truth ends up at the edge of the range instead of the middle, so the group tells an outsider less.
Confidence effect
People grow surer after converging, although they are not more accurate.
Our reading
Agreement is not evidence. A team that converged in the meeting may only have converged.
Source: Jan Lorenz, Heiko Rauhut, Frank Schweitzer & Dirk Helbing, PNAS 108(22), 2011
Lorenz et al. (2011), abstract and results, read in full; the quote is from the abstract. The three names are the authors'; the short descriptions are ours.
What the research says
Not all influenceis the same
Joshua Becker, Devon Brackbill and Damon Centola at the University of Pennsylvania recruited 1,360 people online; 1,040 of them worked in networks of 40. They estimated quantities such as the calories on a plate of food, three times each, and saw the average of the people they were linked to.
Change in error, first to third estimate (2017)
In the equal networks everyone had the same number of ties; in centralized ones one member had far more, and the group drifted towards that person's first answer, for better or worse. Those who started accurate revised less.
Our reading
Exchange helped where every voice weighed the same. In many meetings one voice reaches everyone first: the boss's.
Source: Joshua Becker, Devon Brackbill & Damon Centola, PNAS 114(26), 2017
Web experiments on estimation tasks, not work teams; 13 trials per network type. −10% is our calculation from the group-mean error of 0.69 and 0.62 standard deviations. Read in the full text.
How it is measured
Is the groupstill wise?
The studies measured a crowd in a few ways. A team can keep the same records for its own estimates, and check them once the true figure is known.
First notes kept
Every estimate written alone, before anyone speaks, and kept after the meeting.
Median and spread
The middle value, and where the middle half of the notes lies, as Galton read his cards.
Where the truth fell
In the middle of the notes, or at their edge: the wisdom of crowd indicator of Lorenz and colleagues.
Error before and after
The median of the first notes and the agreed figure, each against the true value.
Confidence before and after
How sure each person was, asked twice. Rising confidence without a smaller error is a warning.
Our reading
If the agreed figure is no better than the median of the first notes, the meeting added confidence, not knowledge.
Sources: Francis Galton, Nature 75 (No. 1949), 1907; Jan Lorenz, Heiko Rauhut, Frank Schweitzer & Dirk Helbing, PNAS 108(22), 2011
The measures follow Galton (1907) and Lorenz et al. (2011); applying them to a team's estimates is the editors' proposal. The noise audit is in No. 20, the pre-mortem in No. 44, independent scoring in interviews in No. 65.
Tool of the issue
The independentestimate card
One card per estimate: next week's volume, the length of a job, the cost of a change. Lines 1–3 are filled in alone; talk starts when every card is in. An agreed volume can then go into Shift Capacity.
01The questionwhat exactly, in which unit, and when the true figure will be known
02My estimate, aloneone number, and how sure: low, medium, high
03What I based it onone line: data, experience, a comparison
04The spreadlowest, median and highest of all cards, read out before anyone argues
05After the discussionthe agreed figure; who moved, and why
06The true figurethe error of the median and of the agreed figure; what we change next time
Sources: Francis Galton, Nature 75 (No. 1949), 1907; Jan Lorenz, Heiko Rauhut, Frank Schweitzer & Dirk Helbing, PNAS 108(22), 2011; Joshua Becker, Devon Brackbill & Damon Centola, PNAS 114(26), 2017
This card is the editors' proposal, built on Galton (1907), Lorenz et al. (2011) and Becker et al. (2017); it has not been tested as a card.
Open the tool: Shift Capacitystivencatalyst.com/tools/shift-capacity/
Sources and method
Every figurehas a source.
The figures in this issue come from the sources below. The year shows how recent each one is.
- Vox populiFrancis Galton, Nature 75 (No. 1949), 1907https://galton.org/essays/1900-1911/galton-1907-vox-populi.pdf
- How social influence can undermine the wisdom of crowd effectJan Lorenz, Heiko Rauhut, Frank Schweitzer & Dirk Helbing, PNAS 108(22), 2011https://doi.org/10.1073/pnas.1008636108
- Network dynamics of social influence in the wisdom of crowdsJoshua Becker, Devon Brackbill & Damon Centola, PNAS 114(26), 2017https://doi.org/10.1073/pnas.1615978114
Editorial method
Each figure was checked for its year, its publisher and what it measures, in the full text where it could be opened. A source read only in a summary, an abstract or excerpts is marked “via”. A figure not confirmed in what was read is marked so on its page, or left out. The editor's interpretation is marked “Our reading”.
ManagementReview
Management without theatre.
Every issue, one management question, checked against the best research.
All issues
stivencatalyst.com/magazine/management-review.html
Management Review · No. 83 · November 2026 · Stiven Catalyst
Edited by Stiven Janaqi, who answers for it; “the editors” in this publication means him. Its texts, translations, layout and the checking of figures against their sources are done in working sessions with Claude, an AI model by Anthropic.
stivencatalyst.com/how-this-is-made.html
 Next issue
Heat at work: not only in a heatwave
Click or swipe a page to turn it. The arrow keys work too.
Management Review · No. 83
The figures of the issue
The charts of the printed pages, with their sources.
Share of cases in which the group figure was closer to the truth than individual estimates: the plain average against first estimates, the geometric mean on logarithms. 144 subjects, six questions. Read in the full text.
Source: Jan Lorenz, Heiko Rauhut, Frank Schweitzer & Dirk Helbing, PNAS 108(22), 2011
Web experiments on estimation tasks, not work teams; 13 trials per network type. −10% is our calculation from the group-mean error of 0.69 and 0.62 standard deviations. Read in the full text.
Source: Joshua Becker, Devon Brackbill & Damon Centola, PNAS 114(26), 2017
The whole text Read the issue as text For reading on a small screen, searching or a screen reader. The same words, without the page design.
In this issue
Many planning meetings start with someone saying a number. After that, the others tend to talk around it. The research on the wisdom of crowds asks a simple question: what is a group's estimate worth if its members have already heard each other?
At a cattle show in Plymouth, 787 visitors each wrote a guess on a card; the middle one missed the ox's weight by 0.8%. In Zurich, 144 students were paid for accurate answers. Seeing the others' estimates narrowed their range, did not make the group significantly more accurate, and made them surer. In a web experiment with 1,360 people, exchange did help when every voice weighed the same, and hurt when one well-connected person was far from the truth. A card turns this into a routine for estimates.
Stiven Janaqi, Editor
Cover story
787 cards and one ox
In March 1907 Francis Galton described in Nature a weight-judging competition at the West of England Fat Stock and Poultry Exhibition in Plymouth. For sixpence, visitors wrote on a card what a fat ox would weigh once slaughtered and dressed.
- ≈800 cards were issued; Galton set 13 aside as defective or illegible
- 1,207 lb the middle estimate of the 787 that remained
- 1,198 lb the dressed weight of the ox
Galton took the middlemost estimate, as in a vote in which every other estimate is outvoted as too high or too low. It was 9 lb, or 0.8%, too high. Half of the cards lay between 29 lb below and 45 lb above it. He gave one reason the material was good:
The judgments were unbiassed by passion and uninfluenced by oratory and the like.
Our reading
The crowd was not wise because it talked. It was wise because each card was written before anyone could hear a speech.
Galton, Nature 75, 7 March 1907, pp. 450–451. He reports the middlemost estimate, the median; we use only his figures. The quote is his; the translations are ours.
Source: Francis Galton, Nature 75 (No. 1949), 1907
The numbers
The average that misleads
Jan Lorenz, Heiko Rauhut and colleagues at ETH Zurich put six factual questions to 144 students, in 12 sessions of 12. One asked for the length of the border between Switzerland and Italy. Payment rewarded only accuracy, not agreeing with others.
How often the group figure beat the individual estimates (2011): Plain average 21.3%, Geometric mean 77.1%.
Answers to such questions are skewed to the right: a few very high guesses pull the plain average away from the truth. The geometric mean, an average taken on a logarithmic scale, resists them, as does the median Galton used.
Our reading
Before averaging a team's estimates, look at the spread. One wild number can move the average more than ten sensible ones.
Share of cases in which the group figure was closer to the truth than individual estimates: the plain average against first estimates, the geometric mean on logarithms. 144 subjects, six questions. Read in the full text.
Source: Jan Lorenz, Heiko Rauhut, Frank Schweitzer & Dirk Helbing, PNAS 108(22), 2011
The model
Three ways a crowd loses its edge
Each question ran for five rounds. In the control condition nobody saw anything. In the others, subjects saw the average of the previous round, or every estimate so far. The authors' finding:
Even mild social influence can undermine the wisdom of crowd effect.
- Social influence effect. The estimates move closer together; the group's collective error does not fall significantly.
- Range reduction effect. The truth ends up at the edge of the range instead of the middle, so the group tells an outsider less.
- Confidence effect. People grow surer after converging, although they are not more accurate.
Our reading
Agreement is not evidence. A team that converged in the meeting may only have converged.
Lorenz et al. (2011), abstract and results, read in full; the quote is from the abstract. The three names are the authors'; the short descriptions are ours.
Source: Jan Lorenz, Heiko Rauhut, Frank Schweitzer & Dirk Helbing, PNAS 108(22), 2011
What the research says
Not all influence is the same
Joshua Becker, Devon Brackbill and Damon Centola at the University of Pennsylvania recruited 1,360 people online; 1,040 of them worked in networks of 40. They estimated quantities such as the calories on a plate of food, three times each, and saw the average of the people they were linked to.
Change in error, first to third estimate (2017): Individuals, no network (control) −3%, Individuals, equal network −23%, Group mean, equal network −10%, Group mean, central person far from truth +19%.
In the equal networks everyone had the same number of ties; in centralized ones one member had far more, and the group drifted towards that person's first answer, for better or worse. Those who started accurate revised less.
Our reading
Exchange helped where every voice weighed the same. In many meetings one voice reaches everyone first: the boss's.
Web experiments on estimation tasks, not work teams; 13 trials per network type. −10% is our calculation from the group-mean error of 0.69 and 0.62 standard deviations. Read in the full text.
Source: Joshua Becker, Devon Brackbill & Damon Centola, PNAS 114(26), 2017
How it is measured
Is the group still wise?
The studies measured a crowd in a few ways. A team can keep the same records for its own estimates, and check them once the true figure is known.
- First notes ke
p t. Every estimate written alone, before anyone speaks, and kept after the meeting. - Median and spread. The middle value, and where the middle half of the notes lies, as Galton read his cards.
- Where the truth fell. In the middle of the notes, or at their edge: the wisdom of crowd indicator of Lorenz and colleagues.
- Error before and a
f ter. The median of the first notes and the agreed figure, each against the true value. - Confidence before and a
f ter. How sure each person was, asked twice. Rising confidence without a smaller error is a warning.
Our reading
If the agreed figure is no better than the median of the first notes, the meeting added confidence, not knowledge.
The measures follow Galton (1907) and Lorenz et al. (2011); applying them to a team's estimates is the editors' proposal. The noise audit is in No. 20, the pre-mortem in No. 44, independent scoring in interviews in No. 65.
Sources: Francis Galton, Nature 75 (No. 1949), 1907; Jan Lorenz, Heiko Rauhut, Frank Schweitzer & Dirk Helbing, PNAS 108(22), 2011
Tool of the issue
The independent estimate card
One card per estimate: next week's volume, the length of a job, the cost of a change. Lines 1–3 are filled in alone; talk starts when every card is in. An agreed volume can then go into Shift Capacity.
- The question what exactly, in which unit, and when the true figure will be known
- My estimate, alone one number, and how sure: low, medium, high
- What I based it on one line: data, experience, a comparison
- The spread lowest, median and highest of all cards, read out before anyone argues
- A
f ter the discussion the agreed figure; who moved, and why - The true figure the error of the median and of the agreed figure; what we change next time
This card is the editors' proposal, built on Galton (1907), Lorenz et al. (2011) and Becker et al. (2017); it has not been tested as a card.
Sources: Francis Galton, Nature 75 (No. 1949), 1907; Jan Lorenz, Heiko Rauhut, Frank Schweitzer & Dirk Helbing, PNAS 108(22), 2011; Joshua Becker, Devon Brackbill & Damon Centola, PNAS 114(26), 2017
Open the tool: Shift Capacity
Sources and method
Every figure has a source.
The figures in this issue come from the sources below. The year shows how recent each one is.
- Francis Galton, Nature 75 (No. 1949), “Vox populi”, 1907. https://galton.org/essays/1900-1911/galton-1907-vox-populi.pdf
- Jan Lorenz, Heiko Rauhut, Frank Schweitzer & Dirk Helbing, PNAS 108(22), “How social influence can undermine the wisdom of crowd effect”, 2011. https://doi.org/10.1073/pnas.1008636108
- Joshua Becker, Devon Brackbill & Damon Centola, PNAS 114(26), “Network dynamics of social influence in the wisdom of crowds”, 2017. https://doi.org/10.1073/pnas.1615978114
Edit orial me thod
Each figure was checked for its year, its publisher and what it measures, in the full text where it could be opened. A source read only in a summary, an abstract or excerpts is marked “via”. A figure not confirmed in what was read is marked so on its page, or left out. The editor's interpretation is marked “Our reading”.
Edited by Stiven Janaqi, who answers for it; “the editors” in this publication means him. Its texts, translations, layout and the checking of figures against their sources are done in working sessions with Claude, an AI model by Anthropic. How this is made
Management Review · Monthly edition