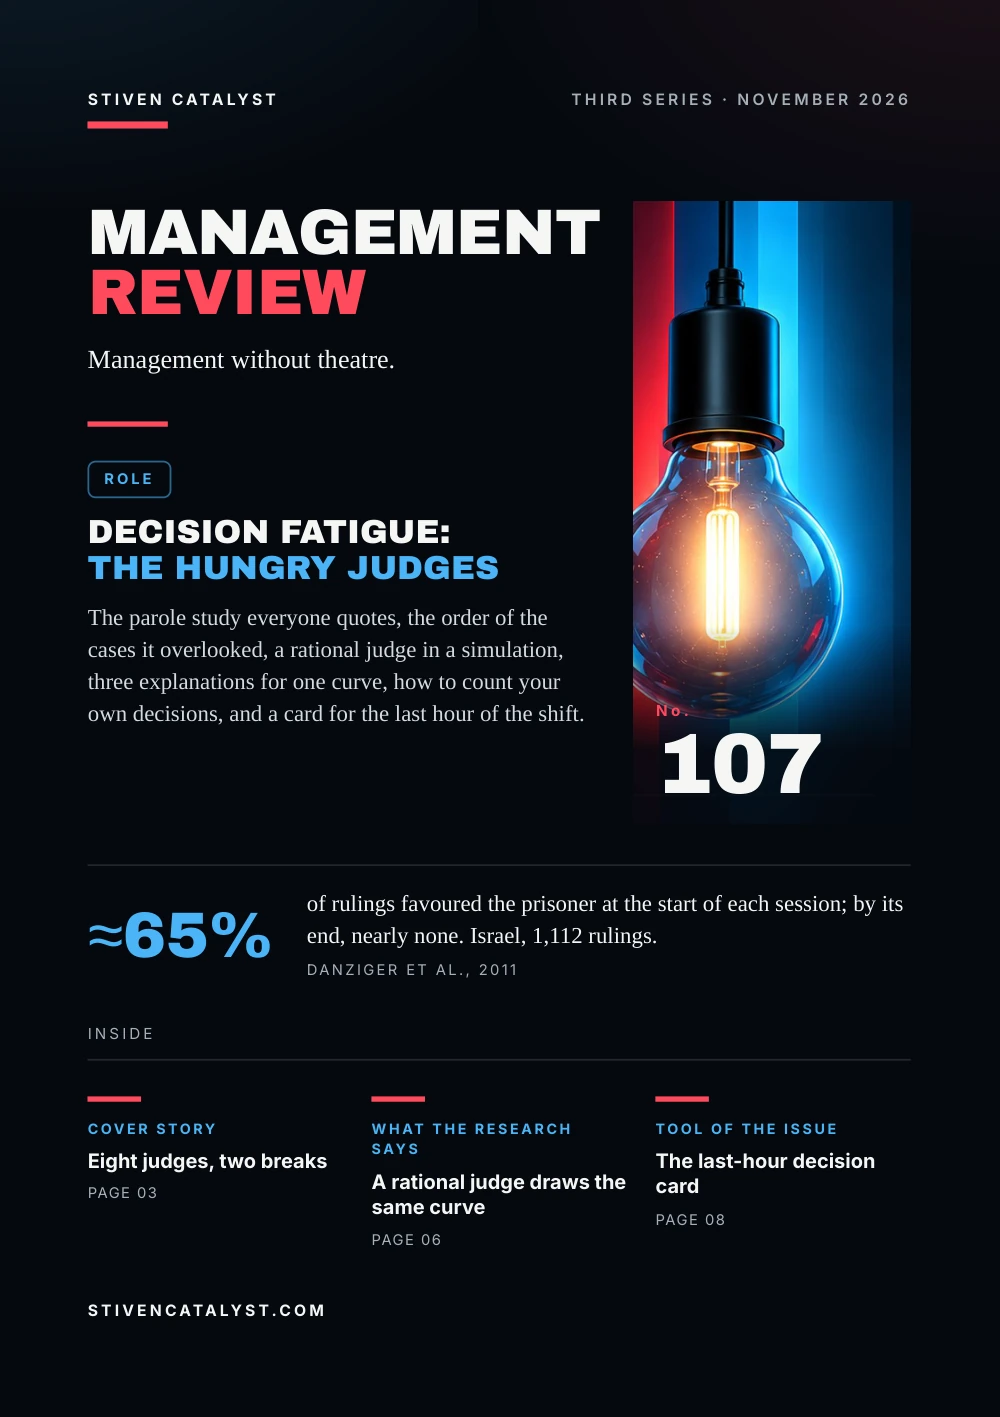
In Seattle a star more on Yelp meant 5% to 9% more revenue for an independent restaurant, and nothing measurable for a chain. For hotels on Travelocity in 2012, a point more was worth an 11.2% higher price. But on Amazon most ratings are fives, with a smaller heap of ones; when a whole group rated one CD, the ratings were lower and in the middle. On Yelp about 16% of Boston restaurant reviews were filtered as suspicious. A monthly card closes the issue.
Management Review · Third series · November 2026 · No. 108
Online ratings: what a star is wor th
Half a star in Seattle, what a point is worth to a hotel, three things the average hides, the J that nobody chose, the fakes, and a card for reading the month's reviews.
- No.
- 108
- Pages
- 10
- Sources
- 4
- Topics
- KPIs
- Online since
- 7 November 2026
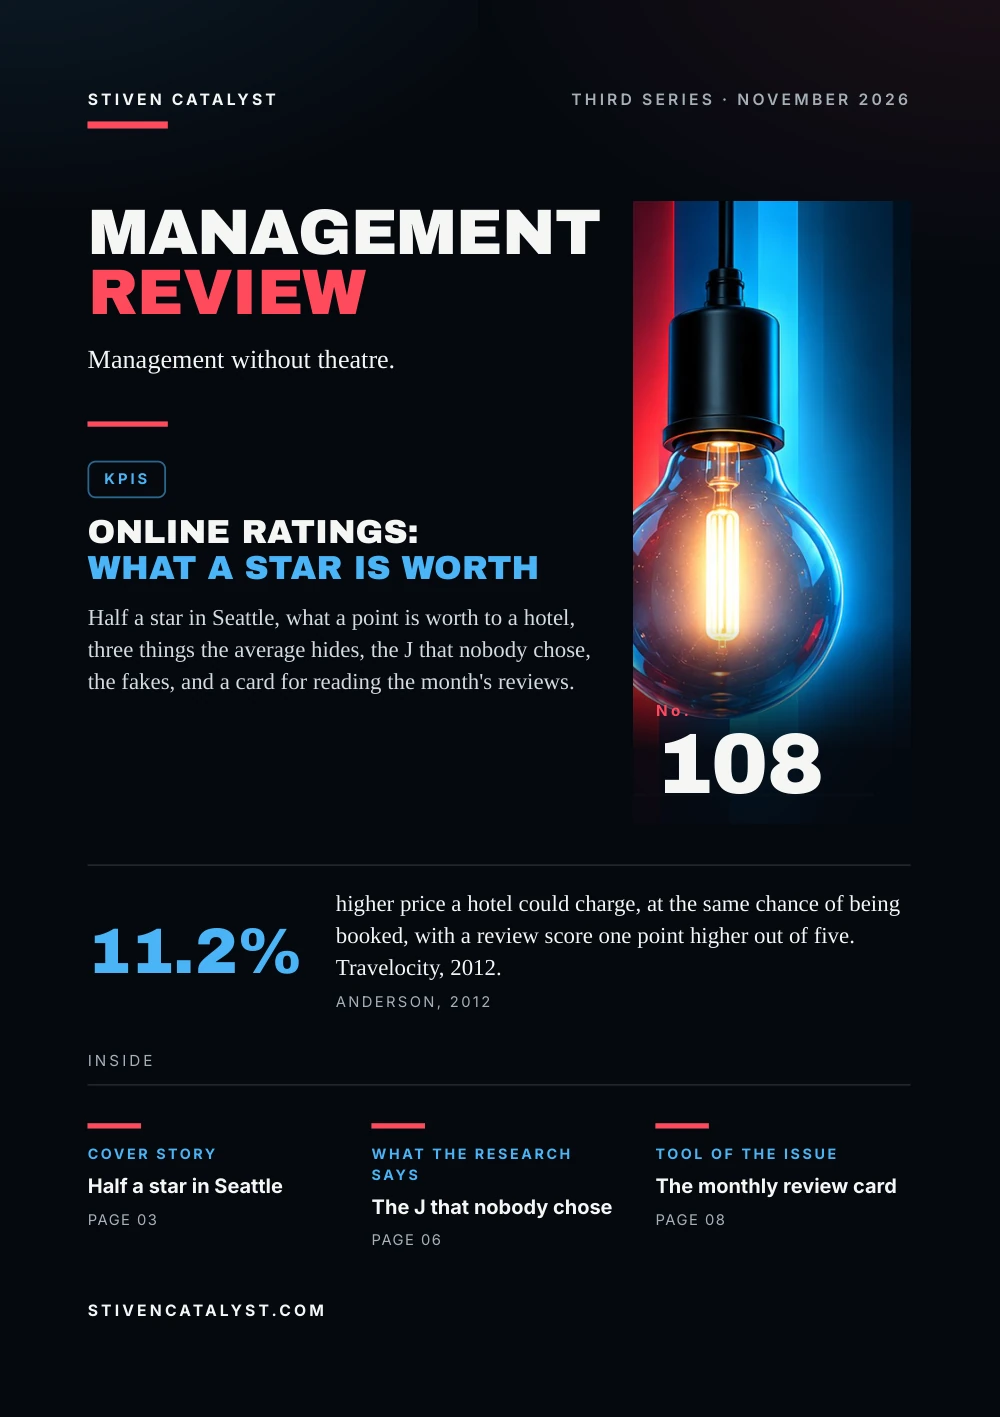
Stiven CatalystThird series · November 2026
ManagementReview
Management without theatre.
KPIs
Online ratings:what a star is worth
Half a star in Seattle, what a point is worth to a hotel, three things the average hides, the J that nobody chose, the fakes, and a card for reading the month's reviews.

No.108
11.2%
higher price a hotel could charge, at the same chance of being booked, with a review score one point higher out of five. Travelocity, 2012.Anderson, 2012
stivencatalyst.com
No. 108 · KPIs
In this issue
Stars have become a KPI that the customer writes and the whole market reads. A manager is asked why the score fell from 4.4 to 4.2 and rarely asks how many people wrote, who they were, or whether some of them were real. This issue puts a price on a star, then takes the average apart.
- 03Cover storyHalf a star in Seattle
- 04The numbersWhat a point is worth to a hotel
- 05The modelThree things the average hides
- 06What the research saysThe J that nobody chose
- 07How it is measuredCount, spread, and the fakes
- 08Tool of the issueThe monthly review card
- 09SourcesSources and method
How to read this issue
Figure
Every figure has its source and year at the foot of its page.
Our reading
Where the editor interprets rather than the research, it says so.
Practice
The steps and the card are proposals to try, not research results.
Cover story
Half a starin Seat tle
Michael Luca of Harvard Business School matched Yelp reviews with the revenue every restaurant in Seattle reported to the state tax office, 2003 to 2009: 3,582 restaurants. Yelp shows each average rounded to the nearest half star, so a 3.24 appears as three stars and a 3.25 as three and a half.
5–9%more revenue for an independent restaurant per extra star, depending on the method
≈ 0effect for chain restaurants: not significant
Comparing restaurants just either side of a rounding line, the extra half star alone raised revenue; scaled to a full star, about 9%. Diners reacted to the rounded number they saw, not only to the reviews behind it. By 2009 Yelp covered 70% of Seattle's restaurants; the city's paper had reviewed about 5%.
Our reading
The rounding line is arbitrary, and the money followed it. A displayed number is a decision for the customer.
Source: Michael Luca, Harvard Business School, 2016
Luca (2016), HBS working paper: quarterly revenue from the Washington State Department of Revenue; 5.4% from fixed effects, about 9% from restaurants within 0.1 star of a threshold. One city, data up to 2009; chains were about 5% of restaurants.
The numbers
What a point iswor th t o a hotel
Chris Anderson of Cornell's School of Hotel Administration studied 13,341 Travelocity bookings in nine US cities in July 2012. One point more on the five-point review score raised a hotel's odds of being chosen by 14.2%: enough to charge 11.2% more and be booked as often. Each place lower on the list cut the odds by 11.5%.
RevPAR change for a 1% better online reputation, by hotel class, 2010–2012
Our reading
The less a guest can guess from the brand and the price, the more the reviews decide. In midscale the gain was nearly three times that of luxury.
Source: Chris K. Anderson, Cornell University, Center for Hospitality Research, 2012
Anderson (2012): STR monthly data, January 2010 to June 2012, 11 cities in Europe and North America, against each hotel's competitive set; reputation is ReviewPro's index. Across all classes: price 0.80%, occupancy 0.20%, RevPAR 0.96%. Associations, old data; he notes much is not measured.
The model
Three thingsthe average hides
An average of stars is a single figure built from three things the reader does not see: how many people wrote, how their ratings are spread, and who they were. Luca found that readers weigh the first and the last when they can see them.
01
How many
A rating change moved revenue 50% more with 50 reviews or more than with under 10.
02
The spread
Reviews pile up at five and one; the mean sits between two crowds.
03
Who wrote
Yelp's elite reviewers had about twice the effect; some reviewers are not customers.
Example, invented by the editors
- Hotel A, 10 reviews
- all three stars: average 3.0
- Hotel B, 10 reviews
- five fives, five ones: average 3.0
Same average, two different hotels: one is ordinary for everyone, the other splits its guests. Only the spread tells them apart.
Sources: Michael Luca, Harvard Business School, 2016; Nan Hu, Paul A. Pavlou & Jennifer Zhang, 2007; Michael Luca & Georgios Zervas, Management Science 62(12), 2016
Cards: the editors' summary of Luca (2016, tables 9 and 10), Hu, Pavlou & Zhang (2007) and Luca & Zervas (2016). The 50% compares restaurants with at least 50 reviews to those with fewer than 10. The example is invented.
What the research says
The J thatnobody chose
Nan Hu, Paul Pavlou and Jennifer Zhang collected Amazon reviews of 32,878 books, 17,978 DVDs and 28,983 videos in 2005. Ratings piled up at five stars, with a smaller heap at one and little between: a J. Then they gave one music CD to 66 students and asked every one of them to rate it.
Share of Amazon reviews at four or five stars, 2005
60 students answered. Their ratings formed a bell around the middle, mean 3.12; on Amazon the same CD averaged 3.54, with over 60% of reviews at one or five stars, against under 10% among the students. Most products also had few voices: 78% of the books had fewer than 20 reviews.
Our reading
Those who buy already like the product, and those who write are the delighted and the angry. The ordinary customer mostly stays silent.
Source: Nan Hu, Paul A. Pavlou & Jennifer Zhang, 2007
Hu, Pavlou & Zhang (2007), working paper; Amazon data February to July 2005; bars are shares of all reviews in each category. The authors call the two causes purchasing bias and under-reporting bias. One CD and students: limits they name themselves.
How it is measured
Count, spread,and the fakes
Michael Luca and Georgios Zervas studied 316,415 Yelp reviews of 3,625 Boston restaurants, 2004 to 2012. Yelp's filter had set aside about 16% as suspicious. Filtered reviews were more extreme; restaurants with few reviews or recent bad ones were more likely to commit fraud, chains less so.
79% : 19%of reviews filtered at businesses caught soliciting fake reviews, against the average Boston restaurant
Count
how many this month, and the total behind the average
Spread
the share of ones and twos, and of fives, not only the mean
Recent, not lifetime
the month against the last three; the lifetime average moves slowly
Who wrote
filtered Boston reviewers had written 10 reviews on average, published ones 137
Source: Michael Luca & Georgios Zervas, Management Science 62(12), 2016
Luca & Zervas (2016), accepted version of 2015. The filter is a proxy for fakes, with errors both ways; the sting covered 126 US businesses flagged by Yelp in the 90 days to March 2014. The fields are the editors' proposal. Top-2-box is in No. 32, Goodhart's law in No. 43.
Tool of the issue
The monthlyreview card
Once a month, read the reviews as a complaint log, not a score: count them, look at the spread, sort the low ones by what went wrong and check whether the desk heard it first. The Guest Complaints tool turns categories into a Pareto and finds the rooms that complain twice.
01Month, platform, countnew reviews this month; the total behind the average
02Average and spreadshare of ones and twos, share of fives; against the last three months
03What the low ones sayin the guest's words, one category each
04Heard at the desk first?in the complaint log or not; if not, why not
05Fixed, and answeredwho fixes the cause, by when; who replies to the review
Sources: Michael Luca, Harvard Business School, 2016; Nan Hu, Paul A. Pavlou & Jennifer Zhang, 2007; Michael Luca & Georgios Zervas, Management Science 62(12), 2016
The card is the editors' proposal, not a tested method, built on the three sources' warnings about count, spread and who wrote. In the editors' view a review score should not become a staff target. The essay linked below gives the author's way of writing a complaint down in the guest's words.
More in the essayThe angry guest at 2 a.m.
Open the tool: Guest Complaintsstivencatalyst.com/tools/guest-complaints/
Sources and method
Every figurehas a source.
The figures in this issue come from the sources below. The year shows how recent each one is.
- Reviews, Reputation, and Revenue: The Case of Yelp.com (Working Paper 12-016)Michael Luca, Harvard Business School, 2016https://www.hbs.edu/ris/Publication%20Files/12-016_a7e4a5a2-03f9-490d-b093-8f951238dba2.pdf
- The Impact of Social Media on Lodging Performance (Cornell Hospitality Report 12(15))Chris K. Anderson, Cornell University, Center for Hospitality Research, 2012https://ecommons.cornell.edu/items/d64bbbba-651a-4e13-a058-af3e2e82f4cf
- Why do Online Product Reviews have a J-shaped Distribution? Overcoming Biases in Online Word-of-Mouth Communication (working paper)Nan Hu, Paul A. Pavlou & Jennifer Zhang, 2007https://archive.nyu.edu/bitstream/2451/14951/2/usedbook1.pdf
- Fake It Till You Make It: Reputation, Competition, and Yelp Review FraudMichael Luca & Georgios Zervas, Management Science 62(12), 2016https://doi.org/10.1287/mnsc.2015.2304
Editorial method
Each figure was checked for its year, its publisher and what it measures, in the full text where it could be opened. A source read only in a summary, an abstract or excerpts is marked “via”. A figure not confirmed in what was read is marked so on its page, or left out. The editor's interpretation is marked “Our reading”.
ManagementReview
Management without theatre.
Every issue, one management question, checked against the best research.
All issues
stivencatalyst.com/magazine/management-review.html
Management Review · No. 108 · November 2026 · Stiven Catalyst
Edited by Stiven Janaqi, who answers for it; “the editors” in this publication means him. Its texts, translations, layout and the checking of figures against their sources are done in working sessions with Claude, an AI model by Anthropic.
stivencatalyst.com/how-this-is-made.html
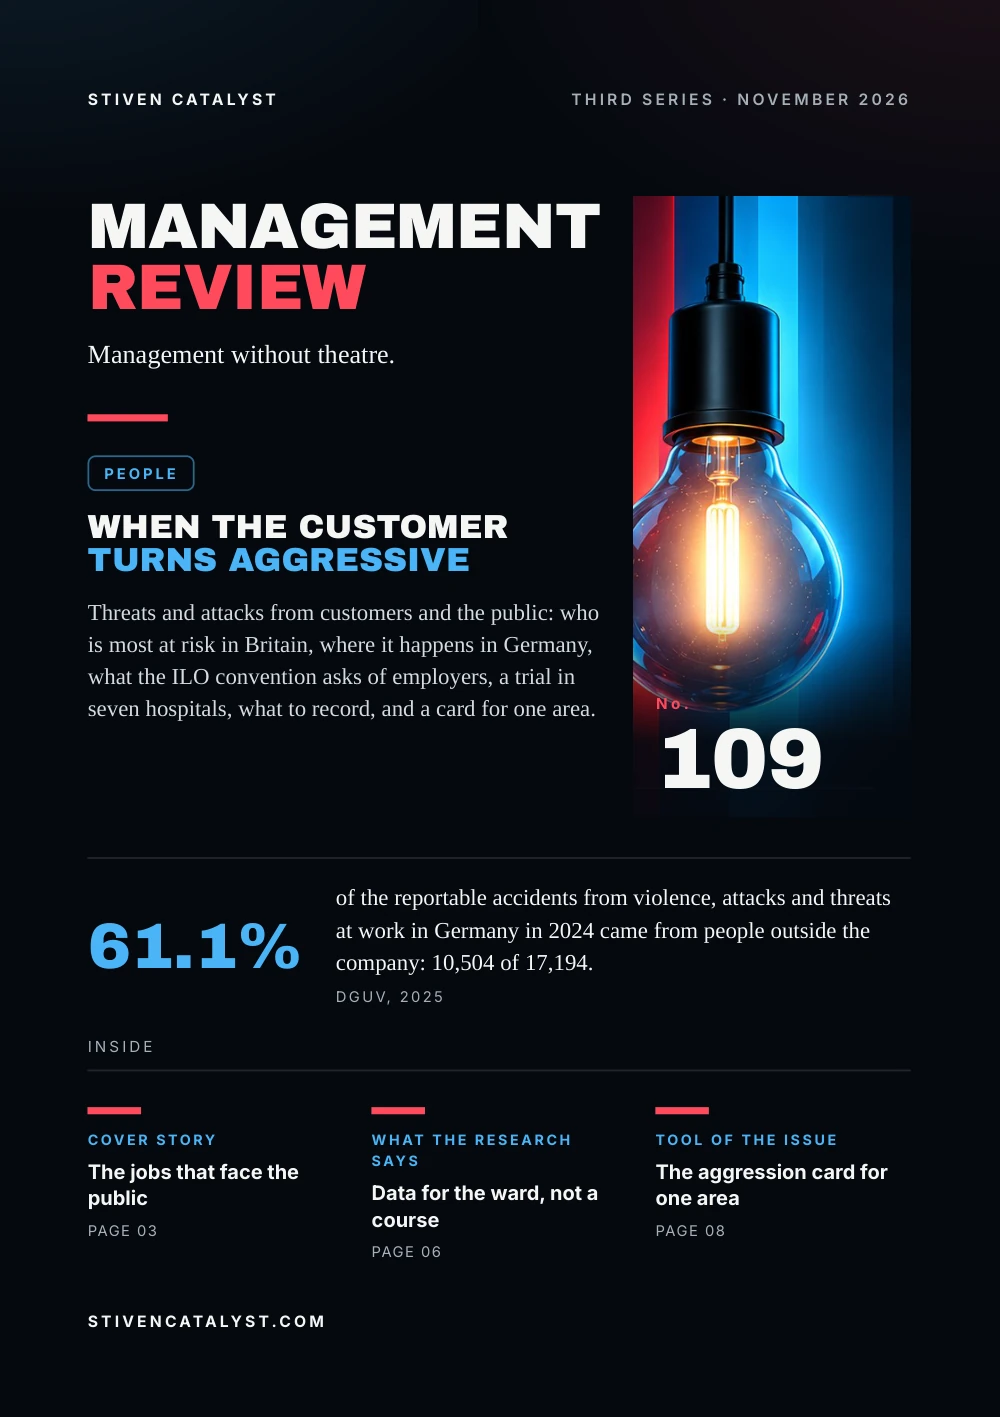 Next issue
When the customer turns aggressive
Click or swipe a page to turn it. The arrow keys work too.
Management Review · No. 108
The figures of the issue
The charts of the printed pages, with their sources.
Anderson (2012): STR monthly data, January 2010 to June 2012, 11 cities in Europe and North America, against each hotel's competitive set; reputation is ReviewPro's index. Across all classes: price 0.80%, occupancy 0.20%, RevPAR 0.96%. Associations, old data; he notes much is not measured.
Source: Chris K. Anderson, Cornell University, Center for Hospitality Research, 2012
Hu, Pavlou & Zhang (2007), working paper; Amazon data February to July 2005; bars are shares of all reviews in each category. The authors call the two causes purchasing bias and under-reporting bias. One CD and students: limits they name themselves.
Source: Nan Hu, Paul A. Pavlou & Jennifer Zhang, 2007
The whole text Read the issue as text For reading on a small screen, searching or a screen reader. The same words, without the page design.
In this issue
Stars have become a KPI that the customer writes and the whole market reads. A manager is asked why the score fell from 4.4 to 4.2 and rarely asks how many people wrote, who they were, or whether some of them were real. This issue puts a price on a star, then takes the average apart.
In Seattle a star more on Yelp meant 5% to 9% more revenue for an independent restaurant, and nothing measurable for a chain. For hotels on Travelocity in 2012, a point more was worth an 11.2% higher price. But on Amazon most ratings are fives, with a smaller heap of ones; when a whole group rated one CD, the ratings were lower and in the middle. On Yelp about 16% of Boston restaurant reviews were filtered as suspicious. A monthly card closes the issue.
Stiven Janaqi, Editor
Cover story
Half a star in Seat tle
Michael Luca of Harvard Business School matched Yelp reviews with the revenue every restaurant in Seattle reported to the state tax office, 2003 to 2009: 3,582 restaurants. Yelp shows each average rounded to the nearest half star, so a 3.24 appears as three stars and a 3.25 as three and a half.
- 5–9% more revenue for an independent restaurant per extra star, depending on the method
- ≈ 0 effect for chain restaurants: not significant
Comparing restaurants just either side of a rounding line, the extra half star alone raised revenue; scaled to a full star, about 9%. Diners reacted to the rounded number they saw, not only to the reviews behind it. By 2009 Yelp covered 70% of Seattle's restaurants; the city's paper had reviewed about 5%.
Our reading
The rounding line is arbitrary, and the money followed it. A displayed number is a decision for the customer.
Luca (2016), HBS working paper: quarterly revenue from the Washington State Department of Revenue; 5.4% from fixed effects, about 9% from restaurants within 0.1 star of a threshold. One city, data up to 2009; chains were about 5% of restaurants.
Source: Michael Luca, Harvard Business School, 2016
The numbers
What a point is wor th t o a hotel
Chris Anderson of Cornell's School of Hotel Administration studied 13,341 Travelocity bookings in nine US cities in July 2012. One point more on the five-point review score raised a hotel's odds of being chosen by 14.2%: enough to charge 11.2% more and be booked as often. Each place lower on the list cut the odds by 11.5%.
RevPAR change for a 1% better online reputation, by hotel class, 2010–2012: Luxury 0.49%, Upper upscale 0.74%, Upscale 0.83%, Upper midscale 1.13%, Midscale 1.42%.
Our reading
The less a guest can guess from the brand and the price, the more the reviews decide. In midscale the gain was nearly three times that of luxury.
Anderson (2012): STR monthly data, January 2010 to June 2012, 11 cities in Europe and North America, against each hotel's competitive set; reputation is ReviewPro's index. Across all classes: price 0.80%, occupancy 0.20%, RevPAR 0.96%. Associations, old data; he notes much is not measured.
Source: Chris K. Anderson, Cornell University, Center for Hospitality Research, 2012
The model
Three things the average hides
An average of stars is a single figure built from three things the reader does not see: how many people wrote, how their ratings are spread, and who they were. Luca found that readers weigh the first and the last when they can see them.
- How many. A rating change moved revenue 50% more with 50 reviews or more than with under 10.
- The spread. Reviews pile up at five and one; the mean sits between two crowds.
- Who wrote. Yelp's elite reviewers had about twice the effect; some reviewers are not customers.
Example, invented by the edit ors
- Hotel A, 10 reviews: all three stars: average 3.0
- Hotel B, 10 reviews: five fives, five ones: average 3.0
Same average, two different hotels: one is ordinary for everyone, the other splits its guests. Only the spread tells them apart.
Cards: the editors' summary of Luca (2016, tables 9 and 10), Hu, Pavlou & Zhang (2007) and Luca & Zervas (2016). The 50% compares restaurants with at least 50 reviews to those with fewer than 10. The example is invented.
Sources: Michael Luca, Harvard Business School, 2016; Nan Hu, Paul A. Pavlou & Jennifer Zhang, 2007; Michael Luca & Georgios Zervas, Management Science 62(12), 2016
What the research says
The J that nobody chose
Nan Hu, Paul Pavlou and Jennifer Zhang collected Amazon reviews of 32,878 books, 17,978 DVDs and 28,983 videos in 2005. Ratings piled up at five stars, with a smaller heap at one and little between: a J. Then they gave one music CD to 66 students and asked every one of them to rate it.
Share of Amazon reviews at four or five stars, 2005: Books 78%, DVDs 73%, Videos 72%.
60 students answered. Their ratings formed a bell around the middle, mean 3.12; on Amazon the same CD averaged 3.54, with over 60% of reviews at one or five stars, against under 10% among the students. Most products also had few voices: 78% of the books had fewer than 20 reviews.
Our reading
Those who buy already like the product, and those who write are the delighted and the angry. The ordinary customer mostly stays silent.
Hu, Pavlou & Zhang (2007), working paper; Amazon data February to July 2005; bars are shares of all reviews in each category. The authors call the two causes purchasing bias and under-reporting bias. One CD and students: limits they name themselves.
Source: Nan Hu, Paul A. Pavlou & Jennifer Zhang, 2007
How it is measured
Count, spread, and the fakes
Michael Luca and Georgios Zervas studied 316,415 Yelp reviews of 3,625 Boston restaurants, 2004 to 2012. Yelp's filter had set aside about 16% as suspicious. Filtered reviews were more extreme; restaurants with few reviews or recent bad ones were more likely to commit fraud, chains less so.
- 79% : 19% of reviews filtered at businesses caught soliciting fake reviews, against the average Boston restaurant
- Count. how many this month, and the total behind the average
- Spread. the share of ones and twos, and of fives, not only the mean
- Recent, not lif
e time. the month against the last three; the lifetime average moves slowly - Who wrote. filtered Boston reviewers had written 10 reviews on average, published ones 137
Luca & Zervas (2016), accepted version of 2015. The filter is a proxy for fakes, with errors both ways; the sting covered 126 US businesses flagged by Yelp in the 90 days to March 2014. The fields are the editors' proposal. Top-2-box is in No. 32, Goodhart's law in No. 43.
Source: Michael Luca & Georgios Zervas, Management Science 62(12), 2016
Tool of the issue
The monthly review card
Once a month, read the reviews as a complaint log, not a score: count them, look at the spread, sort the low ones by what went wrong and check whether the desk heard it first. The Guest Complaints tool turns categories into a Pareto and finds the rooms that complain twice.
- Month, platform, count new reviews this month; the total behind the average
- Average and spread share of ones and twos, share of fives; against the last three months
- What the low ones say in the guest's words, one category each
- Heard at the desk first? in the complaint log or not; if not, why not
- Fixed, and answered who fixes the cause, by when; who replies to the review
The card is the editors' proposal, not a tested method, built on the three sources' warnings about count, spread and who wrote. In the editors' view a review score should not become a staff target. The essay linked below gives the author's way of writing a complaint down in the guest's words.
Sources: Michael Luca, Harvard Business School, 2016; Nan Hu, Paul A. Pavlou & Jennifer Zhang, 2007; Michael Luca & Georgios Zervas, Management Science 62(12), 2016
More in the essay: The angry guest at 2 a.m.
Open the tool: Guest Complaints
Sources and method
Every figure has a source.
The figures in this issue come from the sources below. The year shows how recent each one is.
- Michael Luca, Harvard Business School, “Reviews, Reputation, and Revenue: The Case of Yelp.com (Working Paper 12-016)”, 2016. https://www.hbs.edu/ris/Publication%20Files/12-016_a7e4a5a2-03f9-490d-b093-8f951238dba2.pdf
- Chris K. Anderson, Cornell University, Center for Hospitality Research, “The Impact of Social Media on Lodging Performance (Cornell Hospitality Report 12(15))”, 2012. https://ecommons.cornell.edu/items/d64bbbba-651a-4e13-a058-af3e2e82f4cf
- Nan Hu, Paul A. Pavlou & Jennifer Zhang, “Why do Online Product Reviews have a J-shaped Distribution? Overcoming Biases in Online Word-of-Mouth Communication (working paper)”, 2007. https://archive.nyu.edu/bitstream/2451/14951/2/usedbook1.pdf
- Michael Luca & Georgios Zervas, Management Science 62(12), “Fake It Till You Make It: Reputation, Competition, and Yelp Review Fraud”, 2016. https://doi.org/10.1287/mnsc.2015.2304
Edit orial me thod
Each figure was checked for its year, its publisher and what it measures, in the full text where it could be opened. A source read only in a summary, an abstract or excerpts is marked “via”. A figure not confirmed in what was read is marked so on its page, or left out. The editor's interpretation is marked “Our reading”.
Edited by Stiven Janaqi, who answers for it; “the editors” in this publication means him. Its texts, translations, layout and the checking of figures against their sources are done in working sessions with Claude, an AI model by Anthropic. How this is made
Management Review · Monthly edition