Under the old rules the Douglas DC-8 started with 339 items on scheduled overhaul; the DC-10, planned with the new logic, with seven. Of the components United Airlines analysed, only 6% wore out at a clear age, and 4% followed the bathtub. Nowlan and Heap asked three questions about each failure and chose among four tasks. Their engine example shows an overhaul limit filling the shop. NASA's guide adds how to watch a part that is degrading. A card closes the issue.
Management Review · Third series · November 2026 · No. 105
Maintenance that fits how things fail
How airlines learned that overhauls did not control failures, six patterns of failure and the 4% bathtub, three questions and four tasks, what an age limit would cost an engine shop, what “a life of 2,000 hours” can mean, and a card.
- No.
- 105
- Pages
- 10
- Sources
- 2
- Topics
- Operations
- Online since
- 7 November 2026
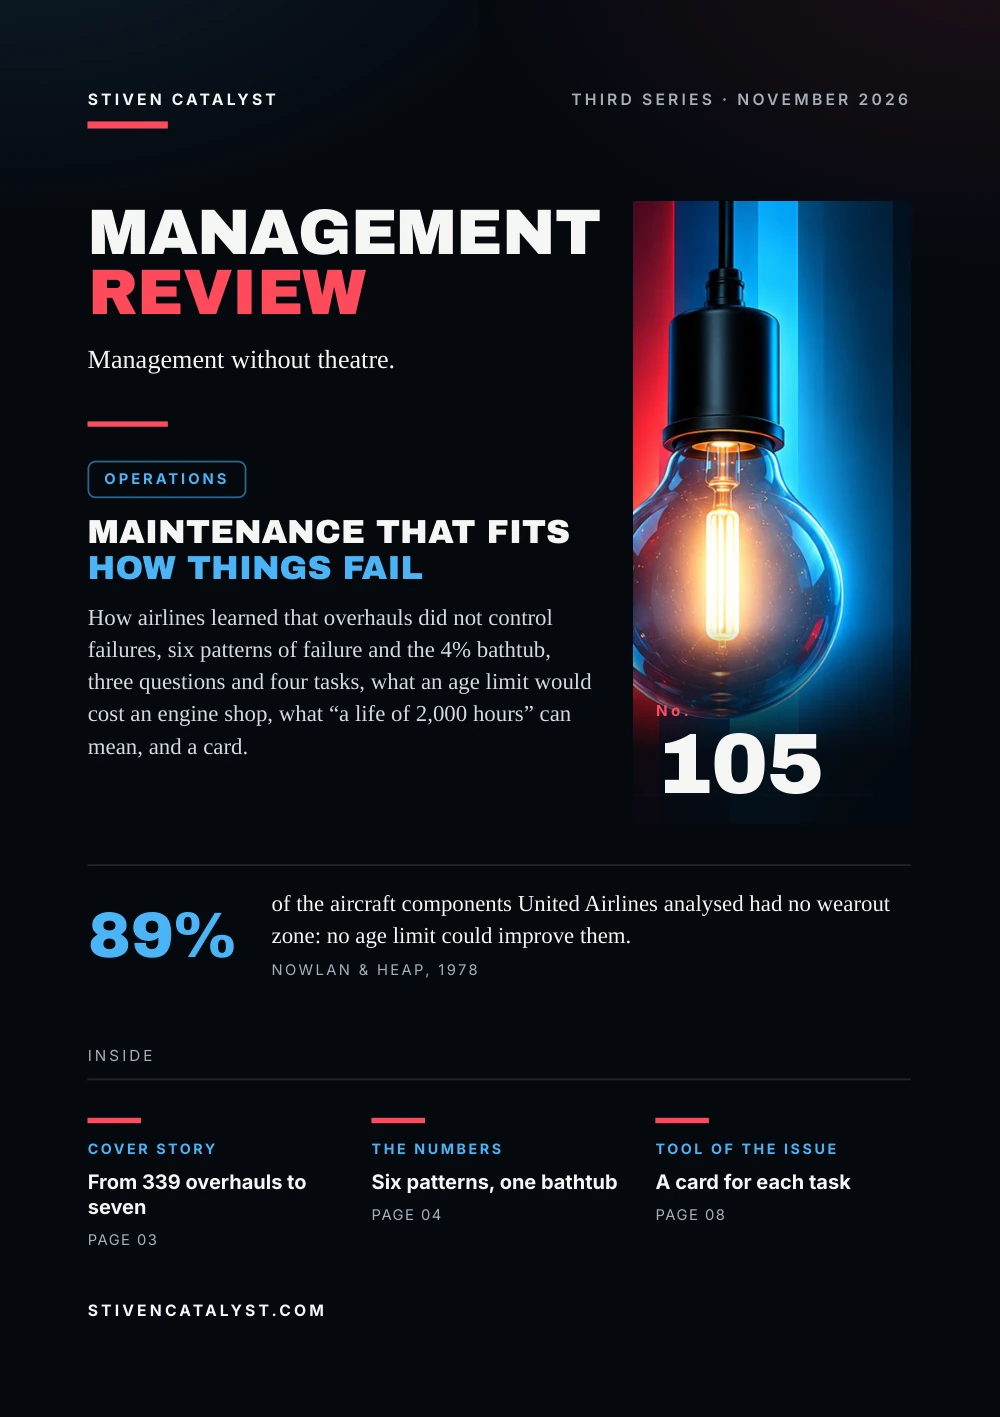
Stiven CatalystThird series · November 2026
ManagementReview
Management without theatre.
Operations
Maintenance that fitshow things fail
How airlines learned that overhauls did not control failures, six patterns of failure and the 4% bathtub, three questions and four tasks, what an age limit would cost an engine shop, what “a life of 2,000 hours” can mean, and a card.

No.105
89%
of the aircraft components United Airlines analysed had no wearout zone: no age limit could improve them.Nowlan & Heap, 1978
stivencatalyst.com
No. 105 · Operations
In this issue
Most maintenance plans still say: every so many hours or months, take it apart, renew it, put it back. It feels like care. Airlines tested that belief against their own failure data fifty years ago and found it held for a few items only. This issue asks which failures a fixed interval prevents, which it does not, and what to do instead.
- 03Cover storyFrom 339 overhauls to seven
- 04The numbersSix patterns, one bathtub
- 05The modelThree questions, four tasks
- 06What the research saysWhat an age limit costs the shop
- 07How it is measuredWhat “a life of 2,000 hours” means
- 08Tool of the issueA card for each task
- 09SourcesSources and method
How to read this issue
Figure
Every figure has its source and year at the foot of its page.
Our reading
Where the editor interprets rather than the research, it says so.
Practice
The steps and the card are proposals to try, not research results.
Cover story
From 339 overhaulst o seven
By the late 1950s airline maintenance costs had grown enough to force a new look. In 1960 the US aviation regulator and the airlines formed a task force; its reliability programme of November 1961 stated that reliability and the control of overhaul times “are not necessarily directly associated topics”.
Items assigned to scheduled overhaul in the initial maintenance programme
The turbine engine was among the items taken off fixed overhaul, which cut the spare engines held for shop work by more than half. On the Boeing 747, United Airlines spent 66,000 manhours on major structural inspections to reach a 20,000-hour interval; on the smaller DC-8 the old policies had taken over 4 million.
Our reading
The overhauls were not too rare or too careless. For most items, the chance of failing simply did not rise with age.
Source: F. Stanley Nowlan & Howard F. Heap, United Airlines, for the Office of the Assistant Secretary of Defense (Manpower, Reserve Affairs and Logistics), 1978
Nowlan & Heap (1978), section 1·1. The authors write that the cuts came with no loss of reliability. Both programmes are airline examples from the report, not a controlled comparison: the DC-10 is a later and different aircraft. The callout paraphrases the report's own explanation.
The numbers
Six pat terns,one bathtub
While overhaul intervals were being stretched, United Airlines plotted, for many aircraft components, the chance that a unit which had reached a given age would fail in the next interval. The curves fell into six patterns.
Share of the components analysed, by failure pattern (United Airlines, 1978)
Only A and B, 6%, wore out at a clear age, mostly simple items such as tyres, brake pads and compressor blades. Another 5% grew steadily more likely to fail. The other 89% had no wearout zone, so no age limit could improve them.
Our reading
The most common pattern starts with failures right after installation. For it, the riskiest time is the start, not the end.
Sources: F. Stanley Nowlan & Howard F. Heap, United Airlines, for the Office of the Assistant Secretary of Defense (Manpower, Reserve Affairs and Logistics), 1978; National Aeronautics and Space Administration (NASA), 2008
Exhibit 2·13 and section 2·8. Shares of components, not of failures; the report gives neither their number nor the years. NASA's guide (2008) cites a Swedish study (1973) and a US Navy one (1982): with the airline data, 77–92% of failures “random”, not age-related; the Navy found pattern B in 17%.
The model
Three questions,four tasks
Nowlan and Heap start not from the part but from what its failure does. The decision runs in two steps: first the consequence, which sets what a task must achieve, then the tasks in a fixed order of preference.
Ask of each failure
- Would the crew notice it? If not, the function is hidden and needs a check.
- Could it harm safety? Then a task must prevent every case, or the design changes.
- Does it stop operations? Then a task must cost less than the loss.
Then try, in this order
- Inspect for signs of a coming failure
- Rework at an age limit
- Discard at a life limit
- For hidden functions: a check that finds failures
An inspection works only if a coming failure can be seen, defined as a limit and found in time, like a crack growing at a known rate or a brake pin worn below 0.25 inch. If no task passes, an evident failure without safety risk gets no scheduled task.
Our reading
“Run to failure” is a decision with a reason written next to it, not a gap in the plan.
Sources: F. Stanley Nowlan & Howard F. Heap, United Airlines, for the Office of the Assistant Secretary of Defense (Manpower, Reserve Affairs and Logistics), 1978; National Aeronautics and Space Administration (NASA), 2008
Exhibits 4·2 and 4·3 and sections 3·1–3·4 of Nowlan & Heap (1978); the wording is the editors'. The brake pin is one of United Airlines' task cards in Exhibit 3·2. NASA's guide (2008) keeps the same logic and names run-to-failure “a conscious decision”. Risk ranking with FMEA is in No. 28.
What the research says
What an age limitcosts the shop
The report's worked example is the Pratt & Whitney JT8D-7 engine of United's Boeing 737s, from 58,432 operating hours between May and July 1974. Without an age limit an engine lasted 1,811 hours on average. The authors then computed the shop load under three overhaul limits.
Engines sent to the shop per 1,000,000 operating hours, failed plus scheduled, by overhaul limit (1978)
A limit of 2,000 hours would bring about 135 fewer failures but 166 more engines into the shop. It pays only if a planned overhaul costs less than 45.1% of a failure repair, or if failures bring other losses. For complex items the authors add that overhaul often raises the failure rate, by bringing back the early failures of a fresh unit.
Our reading
An age limit always sends more units to the shop. The question is whether the failures it saves are worth that.
Source: F. Stanley Nowlan & Howard F. Heap, United Airlines, for the Office of the Assistant Secretary of Defense (Manpower, Reserve Affairs and Logistics), 1978
Exhibit 3·3 and section 3·2; the columns round the report's totals (1,193.3; 717.9; 593.5; 552.2). These are the authors' calculations from one engine's survival curve, not counts of real overhauls. With no limit all 552 are failures; at 1,000 hours 825 of the 1,193 are planned removals.
How it is measured
What “a life of2,000 hours” means
Nowlan and Heap list six things the same sentence can mean: no engine fails before 2,000 hours; no critical failure before then; half fail before; the average failed engine is 2,000 hours old; the risk is constant until then; or one part has a 2,000-hour limit.
0.692of the engines reached 1,000 hours
0.053of all engines failed between 1,000 and 1,200
0.077the risk for an engine that reached 1,000 hours
The last figure is the one that guides maintenance: the chance of failing in the next interval for a unit that has survived so far, .053 divided by .692. Plotted by age, it shows whether failures pile up. A failure rate or an average life does not, and the authors give it a minor role. NASA's guide adds a rule for parts watched for wear: once a reading passes the alert limit, check three to four times as often, for example every three to four weeks instead of quarterly.
Our reading
Count failures by the age of the unit since its last overhaul, not only by month. Only then can a curve be drawn.
Sources: F. Stanley Nowlan & Howard F. Heap, United Airlines, for the Office of the Assistant Secretary of Defense (Manpower, Reserve Affairs and Logistics), 1978; National Aeronautics and Space Administration (NASA), 2008
Section 2·7 and 2·8 of Nowlan & Heap (1978), the JT8D-7 engine; section 4·1 of NASA's guide (2008). The callout is the editors' reading. MTBF in the site's maintenance planner is a failure rate: useful for intervals and costs, silent on which task fits. OEE is in No. 48.
Tool of the issue
A card foreach task
One card for each task in the maintenance plan, to say why it is there. The Maintenance Planner keeps the tasks, their intervals and the breakdowns per asset; the card adds the reason, and the date to look at it again.
01Function and failurewhat it must do, with a limit, and how it fails to
02Would anyone notice?if not, it is hidden: plan a check that finds the failure
03Consequencesafety, stopped work, or only the repair
04Warning sign and lead timewhat shows it coming, and how long before it fails
05Task and why this intervalinspect, rework, discard, find, or run to failure
06Failures by age, next reviewhours since last overhaul at each failure; the date to decide again
Sources: F. Stanley Nowlan & Howard F. Heap, United Airlines, for the Office of the Assistant Secretary of Defense (Manpower, Reserve Affairs and Logistics), 1978; National Aeronautics and Space Administration (NASA), 2008
The card is the editors' proposal, built on the decision questions and task criteria of Nowlan & Heap (1978) and on NASA's guide (2008); it is not a tested instrument. Reviewing tasks as failure data arrive is what the report calls age exploration.
Open the tool: Maintenance Plannerstivencatalyst.com/tools/maintenance-planner/
Sources and method
Every figurehas a source.
The figures in this issue come from the sources below. The year shows how recent each one is.
- Reliability-Centered Maintenance (report AD-A066579)F. Stanley Nowlan & Howard F. Heap, United Airlines, for the Office of the Assistant Secretary of Defense (Manpower, Reserve Affairs and Logistics), 1978https://apps.dtic.mil/sti/citations/ADA066579
- Reliability-Centered Maintenance Guide for Facilities and Collateral EquipmentNational Aeronautics and Space Administration (NASA), 2008https://www.nasa.gov/wp-content/uploads/2023/06/nasa-rcmguide.pdf
Editorial method
Each figure was checked for its year, its publisher and what it measures, in the full text where it could be opened. A source read only in a summary, an abstract or excerpts is marked “via”. A figure not confirmed in what was read is marked so on its page, or left out. The editor's interpretation is marked “Our reading”.
ManagementReview
Management without theatre.
Every issue, one management question, checked against the best research.
All issues
stivencatalyst.com/magazine/management-review.html
Management Review · No. 105 · November 2026 · Stiven Catalyst
Edited by Stiven Janaqi, who answers for it; “the editors” in this publication means him. Its texts, translations, layout and the checking of figures against their sources are done in working sessions with Claude, an AI model by Anthropic.
stivencatalyst.com/how-this-is-made.html
 Next issue
AI that screens CVs: the test and the law
Click or swipe a page to turn it. The arrow keys work too.
Management Review · No. 105
The figures of the issue
The charts of the printed pages, with their sources.
Nowlan & Heap (1978), section 1·1. The authors write that the cuts came with no loss of reliability. Both programmes are airline examples from the report, not a controlled comparison: the DC-10 is a later and different aircraft. The callout paraphrases the report's own explanation.
Source: F. Stanley Nowlan & Howard F. Heap, United Airlines, for the Office of the Assistant Secretary of Defense (Manpower, Reserve Affairs and Logistics), 1978
Exhibit 2·13 and section 2·8. Shares of components, not of failures; the report gives neither their number nor the years. NASA's guide (2008) cites a Swedish study (1973) and a US Navy one (1982): with the airline data, 77–92% of failures “random”, not age-related; the Navy found pattern B in 17%.
Source: F. Stanley Nowlan & Howard F. Heap, United Airlines, for the Office of the Assistant Secretary of Defense (Manpower, Reserve Affairs and Logistics), 1978
Exhibit 3·3 and section 3·2; the columns round the report's totals (1,193.3; 717.9; 593.5; 552.2). These are the authors' calculations from one engine's survival curve, not counts of real overhauls. With no limit all 552 are failures; at 1,000 hours 825 of the 1,193 are planned removals.
Source: F. Stanley Nowlan & Howard F. Heap, United Airlines, for the Office of the Assistant Secretary of Defense (Manpower, Reserve Affairs and Logistics), 1978
The whole text Read the issue as text For reading on a small screen, searching or a screen reader. The same words, without the page design.
In this issue
Most maintenance plans still say: every so many hours or months, take it apart, renew it, put it back. It feels like care. Airlines tested that belief against their own failure data fifty years ago and found it held for a few items only. This issue asks which failures a fixed interval prevents, which it does not, and what to do instead.
Under the old rules the Douglas DC-8 started with 339 items on scheduled overhaul; the DC-10, planned with the new logic, with seven. Of the components United Airlines analysed, only 6% wore out at a clear age, and 4% followed the bathtub. Nowlan and Heap asked three questions about each failure and chose among four tasks. Their engine example shows an overhaul limit filling the shop. NASA's guide adds how to watch a part that is degrading. A card closes the issue.
Stiven Janaqi, Editor
Cover story
From 339 overhauls t o seven
By the late 1950s airline maintenance costs had grown enough to force a new look. In 1960 the US aviation regulator and the airlines formed a task force; its reliability programme of November 1961 stated that reliability and the control of overhaul times “are not necessarily directly associated topics”.
Items assigned to scheduled overhaul in the initial maintenance programme: DC-8, old rules 339, DC-10, MSG-2 7.
The turbine engine was among the items taken off fixed overhaul, which cut the spare engines held for shop work by more than half. On the Boeing 747, United Airlines spent 66,000 manhours on major structural inspections to reach a 20,000-hour interval; on the smaller DC-8 the old policies had taken over 4 million.
Our reading
The overhauls were not too rare or too careless. For most items, the chance of failing simply did not rise with age.
Nowlan & Heap (1978), section 1·1. The authors write that the cuts came with no loss of reliability. Both programmes are airline examples from the report, not a controlled comparison: the DC-10 is a later and different aircraft. The callout paraphrases the report's own explanation.
Source: F. Stanley Nowlan & Howard F. Heap, United Airlines, for the Office of the Assistant Secretary of Defense (Manpower, Reserve Affairs and Logistics), 1978
The numbers
Six pat terns, one bathtub
While overhaul intervals were being stretched, United Airlines plotted, for many aircraft components, the chance that a unit which had reached a given age would fail in the next interval. The curves fell into six patterns.
Share of the components analysed, by failure pattern (United Airlines, 1978): A Bathtub: early failures, then wearout 4%, B Flat, then wearout at the end 2%, C Slowly rising, no wearout age 5%, D Low when new, then constant 7%, E Constant at all ages 14%, F Early failures, then constant 68%.
Only A and B, 6%, wore out at a clear age, mostly simple items such as tyres, brake pads and compressor blades. Another 5% grew steadily more likely to fail. The other 89% had no wearout zone, so no age limit could improve them.
Our reading
The most common pattern starts with failures right after installation. For it, the riskiest time is the start, not the end.
Exhibit 2·13 and section 2·8. Shares of components, not of failures; the report gives neither their number nor the years. NASA's guide (2008) cites a Swedish study (1973) and a US Navy one (1982): with the airline data, 77–92% of failures “random”, not age-related; the Navy found pattern B in 17%.
Sources: F. Stanley Nowlan & Howard F. Heap, United Airlines, for the Office of the Assistant Secretary of Defense (Manpower, Reserve Affairs and Logistics), 1978; National Aeronautics and Space Administration (NASA), 2008
The model
Three questions, four tasks
Nowlan and Heap start not from the part but from what its failure does. The decision runs in two steps: first the consequence, which sets what a task must achieve, then the tasks in a fixed order of preference.
Ask of each failure
- Would the crew notice it? If not, the function is hidden and needs a check.
- Could it harm safety? Then a task must prevent every case, or the design changes.
- Does it stop operations? Then a task must cost less than the loss.
Then try, in this order
- Inspect for signs of a coming failure
- Rework at an age limit
- Discard at a life limit
- For hidden functions: a check that finds failures
An inspection works only if a coming failure can be seen, defined as a limit and found in time, like a crack growing at a known rate or a brake pin worn below 0.25 inch. If no task passes, an evident failure without safety risk gets no scheduled task.
Our reading
“Run to failure” is a decision with a reason written next to it, not a gap in the plan.
Exhibits 4·2 and 4·3 and sections 3·1–3·4 of Nowlan & Heap (1978); the wording is the editors'. The brake pin is one of United Airlines' task cards in Exhibit 3·2. NASA's guide (2008) keeps the same logic and names run-to-failure “a conscious decision”. Risk ranking with FMEA is in No. 28.
Sources: F. Stanley Nowlan & Howard F. Heap, United Airlines, for the Office of the Assistant Secretary of Defense (Manpower, Reserve Affairs and Logistics), 1978; National Aeronautics and Space Administration (NASA), 2008
What the research says
What an age limit costs the shop
The report's worked example is the Pratt & Whitney JT8D-7 engine of United's Boeing 737s, from 58,432 operating hours between May and July 1974. Without an age limit an engine lasted 1,811 hours on average. The authors then computed the shop load under three overhaul limits.
Engines sent to the shop per 1,000,000 operating hours, failed plus scheduled, by overhaul limit (1978): 1,000 h 1,193, 2,000 h 718, 3,000 h 594, No limit 552.
A limit of 2,000 hours would bring about 135 fewer failures but 166 more engines into the shop. It pays only if a planned overhaul costs less than 45.1% of a failure repair, or if failures bring other losses. For complex items the authors add that overhaul often raises the failure rate, by bringing back the early failures of a fresh unit.
Our reading
An age limit always sends more units to the shop. The question is whether the failures it saves are worth that.
Exhibit 3·3 and section 3·2; the columns round the report's totals (1,193.3; 717.9; 593.5; 552.2). These are the authors' calculations from one engine's survival curve, not counts of real overhauls. With no limit all 552 are failures; at 1,000 hours 825 of the 1,193 are planned removals.
Source: F. Stanley Nowlan & Howard F. Heap, United Airlines, for the Office of the Assistant Secretary of Defense (Manpower, Reserve Affairs and Logistics), 1978
How it is measured
What “a life of 2,000 hours” means
Nowlan and Heap list six things the same sentence can mean: no engine fails before 2,000 hours; no critical failure before then; half fail before; the average failed engine is 2,000 hours old; the risk is constant until then; or one part has a 2,000-hour limit.
- 0.692 of the engines reached 1,000 hours
- 0.053 of all engines failed between 1,000 and 1,200
- 0.077 the risk for an engine that reached 1,000 hours
The last figure is the one that guides maintenance: the chance of failing in the next interval for a unit that has survived so far, .053 divided by .692. Plotted by age, it shows whether failures pile up. A failure rate or an average life does not, and the authors give it a minor role. NASA's guide adds a rule for parts watched for wear: once a reading passes the alert limit, check three to four times as often, for example every three to four weeks instead of quarterly.
Our reading
Count failures by the age of the unit since its last overhaul, not only by month. Only then can a curve be drawn.
Section 2·7 and 2·8 of Nowlan & Heap (1978), the JT8D-7 engine; section 4·1 of NASA's guide (2008). The callout is the editors' reading. MTBF in the site's maintenance planner is a failure rate: useful for intervals and costs, silent on which task fits. OEE is in No. 48.
Sources: F. Stanley Nowlan & Howard F. Heap, United Airlines, for the Office of the Assistant Secretary of Defense (Manpower, Reserve Affairs and Logistics), 1978; National Aeronautics and Space Administration (NASA), 2008
Tool of the issue
A card for each task
One card for each task in the maintenance plan, to say why it is there. The Maintenance Planner keeps the tasks, their intervals and the breakdowns per asset; the card adds the reason, and the date to look at it again.
- Function and failure what it must do, with a limit, and how it fails to
- Would anyone notice? if not, it is hidden: plan a check that finds the failure
- Consequence safety, stopped work, or only the repair
- Warning sign and lead time what shows it coming, and how long before it fails
- Task and why this interval inspect, rework, discard, find, or run to failure
- Failures by age, next review hours since last overhaul at each failure; the date to decide again
The card is the editors' proposal, built on the decision questions and task criteria of Nowlan & Heap (1978) and on NASA's guide (2008); it is not a tested instrument. Reviewing tasks as failure data arrive is what the report calls age exploration.
Sources: F. Stanley Nowlan & Howard F. Heap, United Airlines, for the Office of the Assistant Secretary of Defense (Manpower, Reserve Affairs and Logistics), 1978; National Aeronautics and Space Administration (NASA), 2008
Open the tool: Maintenance Planner
Sources and method
Every figure has a source.
The figures in this issue come from the sources below. The year shows how recent each one is.
- F. Stanley Nowlan & Howard F. Heap, United Airlines, for the Office of the Assistant Secretary of Defense (Manpower, Reserve Affairs and Logistics), “Reliability-Centered Maintenance (report AD-A066579)”, 1978. https://apps.dtic.mil/sti/citations/ADA066579
- National Aeronautics and Space Administration (NASA), “Reliability-Centered Maintenance Guide for Facilities and Collateral Equipment”, 2008. https://www.nasa.gov/wp-content/uploads/2023/06/nasa-rcmguide.pdf
Edit orial me thod
Each figure was checked for its year, its publisher and what it measures, in the full text where it could be opened. A source read only in a summary, an abstract or excerpts is marked “via”. A figure not confirmed in what was read is marked so on its page, or left out. The editor's interpretation is marked “Our reading”.
Edited by Stiven Janaqi, who answers for it; “the editors” in this publication means him. Its texts, translations, layout and the checking of figures against their sources are done in working sessions with Claude, an AI model by Anthropic. How this is made
Management Review · Monthly edition