Operations managers do not have the luxury of managing only by instinct. A departure must be on time or late. A load must be complete or incomplete. A room must be ready or not. Every shift creates facts that deserve a record. Yet those records become dangerous when an indicator designed to reveal the work is treated as a complete judgment on the people and the service. The author has worked with last-mile measures such as Delay, Damage, Incomplete and Loading Time, and with reporting and handovers in hospitality. These contexts explain why a KPI can be both useful and incomplete. This sixth volume does not claim that any named employer manipulated a target, hid a defect or punished staff on the basis of a misleading dashboard. Its operational scenes are constructed illustrations, clearly marked wherever an event or measurement is invented. We begin with a deceptively positive score. Campbell and Goodhart explain why high-pressure targets can weaken the measures intended to guide management. Holmström and Milgrom show the incentives problem when some tasks are measurable and others less visible. Bevan and Hood provide a documented public-service case of gaming risk. Statistical process control distinguishes a management target from evidence of a changed process. The final chapters put the measures back into a balanced, auditable decision.
In-depth narrative analysis and theoretical-practical operational treatise · Volume 6 · October 2026
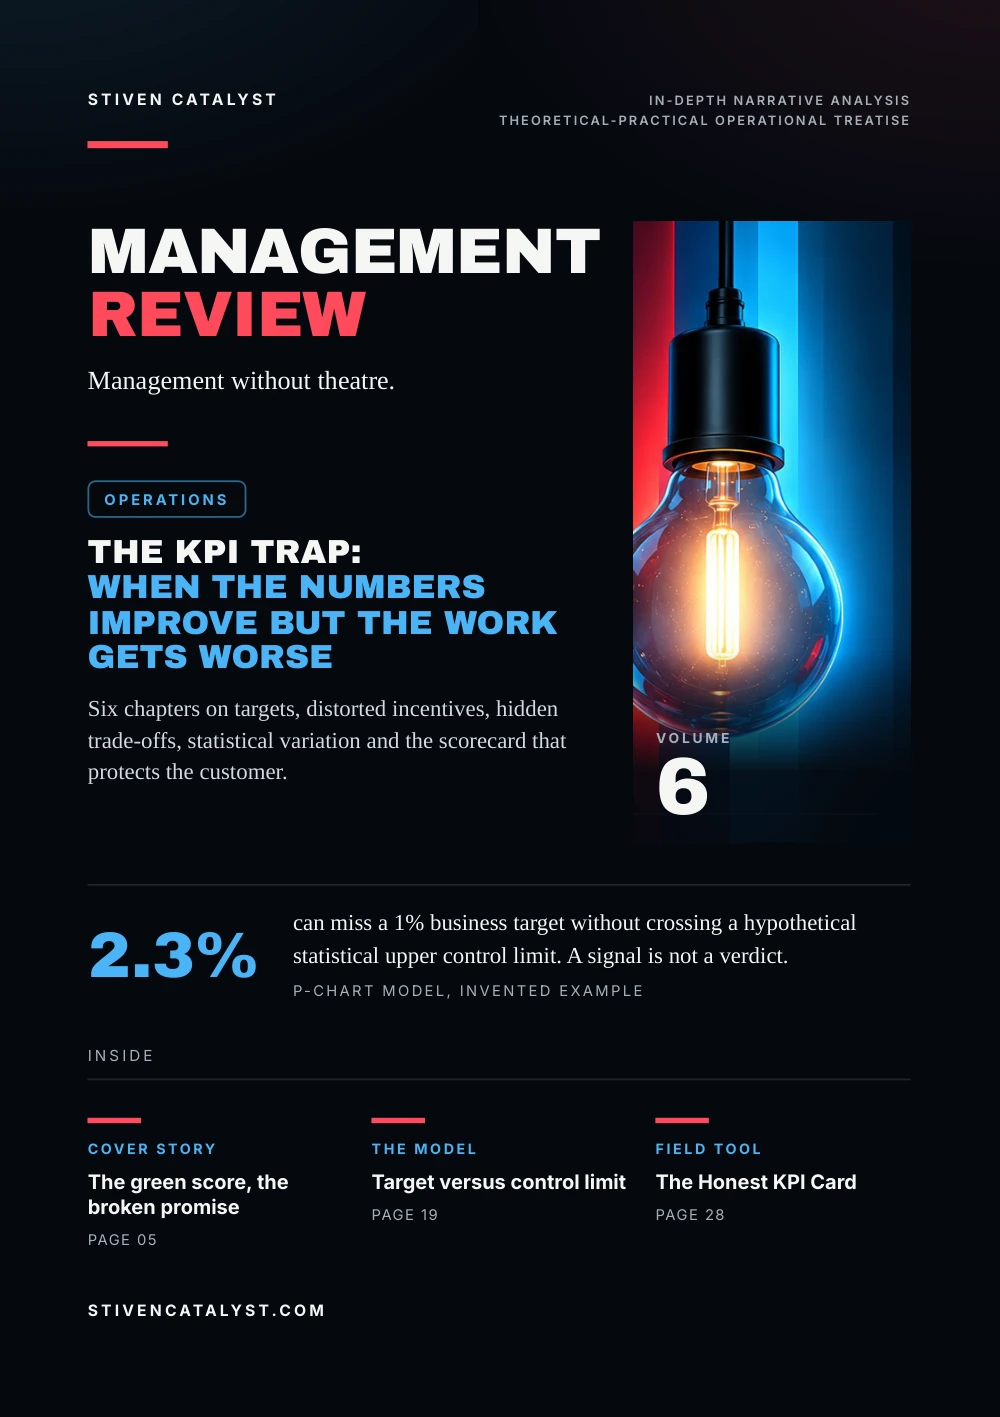
The KPI trap: when the numbers improve but the work ge ts worse
Six chapters on targets, distorted incentives, hidden trade-offs, statistical variation and the scorecard that protects the customer.
- Volume
- 6
- Chapters
- 6
- Pages
- 32
- Sources
- 10
- Online since
- 22 October 2026
How every chapter is built
- 1The living scene
A shift, a ramp, a desk at 03:00: one piece of work followed as it actually happens, with the hand-off where it breaks. Scenes are constructed from real categories of work and say so.
- 2The conce
p tual and scientific breakdownThe mechanism behind the scene, named with the model that explains it, and the research that tests it: the study, its population, its year and its limits, before it is applied anywhere else.
- 3The operating pro
t ocol for actionWhat a working team can try on Monday: fields, questions, a cadence and a count, each with an owner, a next step and a return of information to the people who do the work.
Theoretical-practical operational treatise
Management without theatre.
Operations
Six chapters on targets, distorted incentives, hidden trade-offs, statistical variation and the scorecard that protects the customer.

Volume6
can miss a 1% business target without crossing a hypothetical statistical upper control limit. A signal is not a verdict.p-chart model, invented example
stivencatalyst.com
Editorial · Volume 6
A green scorecan hide a bad day
Measurement is necessary. The problem begins when the number becomes easier to defend than the purpose it was supposed to serve.
How every chapter is built
- 1
The living scene
A shift, a ramp, a desk at 03:00: one piece of work followed as it actually happens, with the hand-off where it breaks. Scenes are constructed from real categories of work and say so.
- 2
The conceptual and scientific breakdown
The mechanism behind the scene, named with the model that explains it, and the research that tests it: the study, its population, its year and its limits, before it is applied anywhere else.
- 3
The operating protocol for action
What a working team can try on Monday: fields, questions, a cadence and a count, each with an owner, a next step and a return of information to the people who do the work.
The reading contract
Field
Real categories of operational work, no invented personal incidents.
Evidence
Research setting, date, method and limits stated together.
Action
A KPI decision must survive a customer-and-quality check.
Contents
The chap ters,in three layers
Chapter IThe green score, the broken promise05
1 SceneThe green score, the broken promise052 BreakdownThe measure is not the mission063 ProtocolRead the green before you celebrate07Chapter IIWhen a measure becomes a target08
1 SceneThe target changes the room082 BreakdownGoodhart is a warning, not a law of fate09What gets measured gets effort10When measurement becomes a game113 ProtocolKeep the target from eating the measure12Chapter IIIThe hidden cost of one KPI13
1 SceneThe fast process and the extra work132 BreakdownA balanced set is not a crowded dashboard14One measure improves. Another changes.153 ProtocolPut a guardrail beside the goal16Chapter IVThe red number and the wrong blame17
1 SceneThe day the dashboard turns red172 BreakdownA business target is not a control limit18The red point inside the expected range193 ProtocolInvestigate the red without inventing a culprit20Chapter VThe scorecard that tells the truth21
1 SceneOne average, two different days212 BreakdownHow both groups improve while the total falls22A scorecard with a conscience233 ProtocolDefine the KPI before defining success24Chapter VIBeyond the target25
1 SceneThe meeting that asks one more question252 BreakdownFive questions before a verdict263 ProtocolBeyond the target: an operating review27
Also in this volume
- 04Research noteWhat a KPI study is allowed to say
- 28Field toolThe Honest KPI Card
- 29Closing essayResponsible for the purpose
- 30MethodStudies, models and methods
- 31SourcesSources and method
Research note
What a KPI studyis allowed t o say
A correlation between a target and a behaviour is not proof that every target causes manipulation.
This volume combines several kinds of evidence: theoretical papers on how control pressure or unequal measurement can alter behaviour, observational public-service research on documented risks in one institutional setting, statistical quality-control guidance on telling routine variation from unusual signals, and improvement guidance on practical families of measures. They produce no universal percentage for KPI gaming, establish no falsified result by anyone in the author's work, and do not show that a three-metric dashboard always prevents harmful incentives. They justify a disciplined set of questions for local verification.
Observed
Publisher-identified finding, population, date and method.
Modelled
Mathematical example with assumptions and reproducible inputs.
Proposed
Editorial control, owner and test, awaiting local evidence.
A green score can be both mathematically correct and operationally inadequate if the definition excludes a relevant customer consequence. Likewise, a red score can be a legitimate warning without proving misconduct or an unusual process shift. The reader should ask what the numerator and denominator mean, who is excluded, when events are counted and what happens outside the visible boundary.
This is an evidence-informed operational treatise, not a statistical study of the author's workplaces.
Sources: Donald T. Campbell, Evaluation and Program Planning, 1979 (via Dartmouth occasional paper (1976), reprinted in the Journal of MultiDisciplinary Evaluation (2011)); Bengt Holmström & Paul Milgrom, Journal of Law, Economics, & Organization 7 (special issue), 1991; Gwyn Bevan & Christopher Hood, Public Administration, 2006; NIST & SEMATECH, 2026; Institute for Healthcare Improvement, 2026
Campbell (1979), Holmström and Milgrom (1991), Bevan and Hood (2006), the NIST/SEMATECH e-Handbook and the IHI; all numerical operational cases are invented.
- 1Scene
- 2Breakdown
- 3Protocol
Chapter I · The green score, the broken promise
The green score,the broken promise
The dashboard is satisfied. The receiving person is not.
Hypothetical last-mile scene, no documented incident
At a constructed loading station, a manager sees that departures are occurring faster than last week. The Loading Time indicator is green. The team has earned the result shown on its screen: the recorded interval from the defined start to the defined end is shorter. A delivery issue appears later. One part of an order has not reached the person who expected it. The departure statistic remains unchanged because the defect belongs to a different measure. Nothing in this scene proves that loading speed caused the missing item. The shortfall could have begun in preparation, recording, sorting, loading or a later handover. The managerial temptation is to tell the easy story: one measure improved and another person made a mistake. That is precisely the story that must be tested rather than announced.
The author's documented last-mile work included Loading Time, Incomplete, missing bags and mixed trolleys as categories of operational attention. The event, its sequence and its outcome here are fictional. We use them only to ask what a metric can certify, and what it cannot.
A metric can be accurate within its boundary and still tell too little about the customer's experience.
Editorial composite of real operational categories; conceptual background in the IHI's outcome, process and balancing measures. The essay named below reads a machine's report the same way.
- 1Scene
- 2Breakdown
- 3Protocol
Chapter I · The green score, the broken promise
The measure isnot the mission
Every indicator has a definition; every service has a larger purpose. A loading-time measure concerns one interval in a process. An incomplete-delivery measure concerns a different failure mode, and its denominator may count orders, bags or another unit. Both can be meaningful without being interchangeable. A percentage with an ambiguous denominator is not yet decision-grade evidence.
The Institute for Healthcare Improvement distinguishes outcome, process and balancing measures. Outcome asks whether the service produces the intended result. Process asks whether the critical steps are working. Balancing asks whether the intervention creates new trouble elsewhere. This is a useful design lens outside healthcare, but the actual measures and acceptance criteria must be defined within the local operation.
Process
Loading interval, scan-completion rate or a defined on-time handover.
Outcome
Complete, correct and timely service for the recipient.
Balancing
Missing items, rework, safety deviations or new downstream waiting.
It is tempting to merge these numbers into a single score. But a weighted average can conceal a severe outcome unless the weights, veto conditions and customer priorities are explicit. Some failures should never be traded away against faster throughput. The definition of an acceptable result comes before the dashboard design.
Ask what changed for the customer before declaring that an internal target has been won.
Source: Institute for Healthcare Improvement, 2026
IHI, Establishing Measures; the logistics mapping is editorial, not validated at an identified site.
- 1Scene
- 2Breakdown
- 3Protocol
Chapter I · The green score, the broken promise
Read the greenbefore you celebrate
A five-step review that tests a favourable KPI against the end-to-end service.
Name the indicator boundary
Operational start, end, exclusions, time window, numerator, denominator and data source.
Check the underlying work
Are the events counted as good complete and usable downstream? Sample anonymised cases where permitted.
Pair the customer outcome
Read the service outcome and a balancing measure next to the improved process KPI.
Test plausible alternatives
Case mix, volume, cut-off rules, staffing and exceptional days, before assigning a cause.
Document the decision
What was confirmed, what is still unknown, who will verify it and when the team will hear back.
When Loading Time improves, also read completeness, on-time service and safety records. Two numbers moving together prove no cause; check that they share time windows and units, since a same-day process number and a next-day customer result may need aligning.
A green number should begin a short verification, not end the conversation.
Source: Institute for Healthcare Improvement, 2026
Editorial operating protocol after the IHI's measurement guidance; no claim of a formal employer-wide implementation.
- 1Scene
- 2Breakdown
- 3Protocol
Chapter II · When a measure becomes a target
The targe tchanges the room
A measurement programme can alter the very activity it is intended to observe.
Constructed team meeting, not a recorded discussion
In a fictional operations review, a manager announces that the only figure shown at the weekly meeting will be one rate of punctual departure. People naturally begin to focus their attention on the recorded departure event. Questions once asked about preparation accuracy, delayed information and recovery after a late start receive less time. The score remains useful, but the meeting has become narrower. No dishonest action is necessary for this shift to happen. People respond to what receives attention, praise and consequences. Staff may do exactly the work the formal measure encourages while leaving less measured responsibilities unattended. The risk is not a defect in the arithmetic; it is a defect in the design of the incentive system.
This is not an allegation about any named employer or person. The point is to introduce a documented theoretical concern: when we convert a diagnostic indicator into a strong control target, its relationship to the work can change.
The stronger the consequence attached to one indicator, the more carefully its blind spots must be examined.
Constructed scenario; theory in Goodhart (1975), Campbell (1979) and Holmström and Milgrom (1991). The essay named below asks which KPIs a team trusts.
- 1Scene
- 2Breakdown
- 3Protocol
Chapter II · When a measure becomes a target
Goodhar t is a warning,not a law of fate
The familiar slogan is a later generalisation of an earlier observation about statistical regularities.
Charles Goodhart observed in monetary-policy analysis that a regularity used for control can cease to behave as it did before control. A popular paraphrase, associated with Marilyn Strathern's discussion of audit culture, says that a measure can cease to be a good measure when it becomes a target. These are related formulations, not two quotations from the same original text. Neither means that every target must fail. Their use in this volume is to challenge the assumption that a measure remains neutral after rewards and penalties are attached. Donald Campbell's 1979 treatment of planned social change also reminds evaluators that observed indicators may fail to reveal whether an intervention really caused the intended improvement. In complex systems, changing conditions and other interventions may move the same measure. A good trend can be real, an artefact of changed definitions or an effect of other influences.
Proxy
The number represents only some qualities of the outcome.
Pressure
Visibility and consequences change incentives and attention.
Validity
Recheck whether the proxy still describes the outcome.
The problem is not using a target. It is forgetting that the target changes the context in which the measure is produced.
Sources: Charles Goodhart, 1975 (via Bevan & Hood (2006), quoting the 1984 reprint); Marilyn Strathern, European Review, 1997; Donald T. Campbell, Evaluation and Program Planning, 1979 (via Dartmouth occasional paper (1976), reprinted in the Journal of MultiDisciplinary Evaluation (2011))
Goodhart (1975) as quoted by Bevan and Hood (2006); Strathern (1997) for the paraphrase; Campbell (1979). The three cards are editorial.
- 1Scene
- 2Breakdown
- 3Protocol
Chapter II · When a measure becomes a target
What ge ts measuredge ts effor t
Multitask incentive theory explains why narrow scores can crowd out responsibilities that are difficult to quantify. Holmström and Milgrom's 1991 multitask principal-agent analysis studies how the design of rewards influences the allocation of effort across duties. In a job with several responsibilities, strong incentives tied to only the measurable ones can divert attention from the others. This is a theoretical mechanism, not an empirical measurement of the author's colleagues.
A dispatcher does more than watch one dashboard: they coordinate, verify exceptions and communicate. A night auditor does more than generate a report: open work must be conveyed accurately to the next shift. A wholesale account manager does more than accept orders: availability and promises must remain credible. In each setting, some valuable activity is harder to capture in a clean daily percentage.
Last-mile: on-time departures are easy to count
Downstream completeness is easy to miss.
Hotel handover: the report was sent
Whether the next shift can act is easy to miss.
Wholesale: orders accepted
Promise fulfilment is easy to miss.
The rows are an editorial illustration of how task definitions can differ, not a claim that any of the three organisations paid incentives on these measures. A reasonable scorecard should include the harder-to-see responsibilities, through sampling or qualitative verification where numerical proxies are inadequate.
When effort has several purposes, a single rewarded number rarely describes all of them.
Source: Bengt Holmström & Paul Milgrom, Journal of Law, Economics, & Organization 7 (special issue), 1991
Holmström and Milgrom, Journal of Law, Economics, & Organization 7 (special issue), 1991; the work examples are interpretive.
- 1Scene
- 2Breakdown
- 3Protocol
Chapter II · When a measure becomes a target
When measurementbecomes a game
Published evidence from public services illustrates risks without proving identical behaviour in private operations.
Gwyn Bevan and Christopher Hood studied target-based governance in the English public healthcare system and described reported success alongside measurement problems and gaming risk. Their 2006 paper examines a particular policy environment, with high-stakes public targets and accountability arrangements. Its context matters: hospital services, political governance and public reporting are not the same as a privately operated loading ramp or hotel shift. Sandra van Thiel and Frans Leeuw described the performance paradox in the public sector: growing quantities of performance information may coexist with declining insight into actual performance, tunnel vision or analysis paralysis. Again, this is not evidence that the author has witnessed gaming. It is a reason to examine what the chosen indicator excludes and how the organisation responds to it.
The practical response is not to accuse individuals whenever a score looks unusually good. Investigate the metric definition, any changes in eligibility or timing, the quality of supporting records, the incentives attached to the score and what independent customer outcomes say.
A surprising score is a question for verification, not an accusation against the team.
Sources: Gwyn Bevan & Christopher Hood, Public Administration, 2006; Sandra van Thiel & Frans L. Leeuw, Public Performance & Management Review 25(3), 2002
Bevan and Hood, Public Administration 84(3), 2006; van Thiel and Leeuw, Public Performance & Management Review 25(3), 2002.
- 1Scene
- 2Breakdown
- 3Protocol
Chapter II · When a measure becomes a target
Keep the targe tfrom eating the measure
Five safeguards before an indicator is attached to praise, ranking or consequences.
Keep a diagnostic copy
The measure used to learn stays separate from the number used to judge.
Name what the proxy cannot see
The responsibilities that get no number, and how they will be sampled.
Add a counter-measure
A balancing indicator that would worsen if the target were pursued too narrowly.
Freeze the definition
Eligibility, timing and exclusions versioned before the first comparison.
Review the incentive, not only the score
Ask periodically what the target has started to reward, and what it has stopped noticing.
An unusually good score deserves the same review as a bad one: the definition, the records behind it, any change in eligibility or timing, and what independent customer outcomes say. None of this presumes misconduct; it keeps the measure worth trusting.
A target is safe to use only while someone still checks what it has stopped measuring.
Sources: Charles Goodhart, 1975 (via Bevan & Hood (2006), quoting the 1984 reprint); Donald T. Campbell, Evaluation and Program Planning, 1979 (via Dartmouth occasional paper (1976), reprinted in the Journal of MultiDisciplinary Evaluation (2011)); Bengt Holmström & Paul Milgrom, Journal of Law, Economics, & Organization 7 (special issue), 1991; Gwyn Bevan & Christopher Hood, Public Administration, 2006
Editorial protocol after Goodhart, Campbell, Holmström and Milgrom and Bevan and Hood; the author's PDF folds these safeguards into its research page.
- 1Scene
- 2Breakdown
- 3Protocol
Chapter III · The hidden cost of one KPI
The fast processand the extra work
Local speed can improve while an adjacent task inherits additional effort.
Hypothetical service flow, no measured employer result
Imagine a team that reduces the time needed to close an incoming request. The dashboard shows more requests marked as processed before the deadline. A downstream colleague finds that some requests now arrive without information necessary to complete the service. The originating team may be doing the measured part faster, while the receiving team spends more time clarifying incomplete handovers. Neither the handover defect nor its cause is established by this short story. A proper inquiry would compare a sample of records before and after the change, verify whether the same type of requests were counted and distinguish a real process-design problem from a coincidence. The team needs a measure of work usable at the next step, not only the date at which the first step was marked finished.
This scenario applies to orders, shift handovers and support requests in principle. It is deliberately not a factual claim about specific guest complaints, transactions, route adjustments or a documented process intervention.
Faster completion at the first desk is not necessarily faster delivery to the customer.
Hypothetical comparison; conceptual sources the IHI's balancing measures and Kaplan and Norton (1992). The essay named below follows a part of an order that went missing.
- 1Scene
- 2Breakdown
- 3Protocol
Chapter III · The hidden cost of one KPI
A balanced se t is nota crowded dashboard
The point is to protect the purpose of the work with complementary measures, not to measure everything. Kaplan and Norton introduced the Balanced Scorecard in 1992 to broaden attention beyond traditional financial measures, combining perspectives on customers, internal processes and organisational capability. It is a strategic management approach, not a rule that every operational dashboard must reproduce four boxes unchanged. A useful front-line scorecard can be simpler.
The IHI's outcome, process and balancing distinction provides a concrete test. If one team is asked to improve a process indicator, the review should include a result experienced by the customer and a countermeasure that can detect unwanted costs elsewhere. Measurement may also require a qualitative sample, because a tally of completed forms cannot tell whether the receiving colleague understands the open case.
Outcome
The result a customer or receiving team actually values.
Process
A controllable step plausibly connected to that result.
Balancing
What might deteriorate if the process score is pushed.
More measures can also create more noise. Choose a small family with different jobs; remove duplicates; define ownership; decide how often to review each. Any safety-critical exception should be visible in its own right rather than averaged away by a more favourable speed figure.
A balanced scorecard is a discipline of looking at the whole result, not an excuse for multiplying targets.
Sources: Robert S. Kaplan & David P. Norton, Harvard Business Review, 1992; Institute for Healthcare Improvement, 2026
Kaplan and Norton, Harvard Business Review, January–February 1992; IHI, Establishing Measures.
- 1Scene
- 2Breakdown
- 3Protocol
Chapter III · The hidden cost of one KPI
One measure improves.Another changes.
A completely synthetic numerical example shows why two indicators must be examined together: two periods of 1,000 orders each.
Synthetic example, authored for this volume; not employer data
Frequency per 1,000 orders, invented
The late-order rate falls by two percentage points while the incomplete-order rate rises by two points. We have described two facts about the artificial table. We have not demonstrated that faster departures caused incomplete orders, nor decided whether one percentage point has the same value in the two outcomes. Also, a late and an incomplete order may be the same order: the counts cannot simply be added to infer a unique number of affected orders. A genuine analysis would need event definitions, overlap handling, confidence considerations, customer severity, comparable volume and evidence about the process change. Without those, the apparent trade-off is only a prompt for investigation.
Do not add percentages with different meanings, and do not infer a cause from two lines on a chart.
Source: Institute for Healthcare Improvement, 2026
Every value on this page is synthetic, authored for this volume; measure taxonomy after the IHI.
- 1Scene
- 2Breakdown
- 3Protocol
Chapter III · The hidden cost of one KPI
Put a guardrailbeside the goal
A practical protocol for reviewing an improvement without relocating its cost.
State the primary goal
The customer effect and the operational metric intended to lead toward it.
Name a possible side effect
One or two plausible downstream or safety consequences.
Align the measurement scope
Match population, period and unit of analysis; record known missingness.
Decide before the pilot
Review triggers and non-negotiable stop conditions where policy warrants them.
Check both sides
The result, the balancing signal and a small sample of actual work.
Preserve the distinction
Worked, partially worked or not yet knowable: record which.
For a hotel handover, a timely report is one thing; whether the next shift has enough actionable information is another. For last-mile loading, departure timing and completeness may deserve paired attention. These are design proposals, not already verified combined KPIs for the author's workplaces.
You do not need a perfect dashboard to avoid celebrating a problem transferred to another team.
Sources: Institute for Healthcare Improvement, 2026; Robert S. Kaplan & David P. Norton, Harvard Business Review, 1992
Editorial operating protocol from the IHI's measure families and Kaplan and Norton's balanced-performance lens.
- 1Scene
- 2Breakdown
- 3Protocol
Chapter IV · The red number and the wrong blame
The daythe dashboard turns red
A worse number may require attention now. It does not always justify changing the process tomorrow.
Constructed manager review, no claimed event
A manager sees a red daily rate on a performance screen. It is above a target. The instinct is to ask who caused it, and then to call an immediate meeting. But one daily proportion contains several questions that the colour cannot answer: How many opportunities were counted? Has the definition changed? Does the process normally fluctuate? Is this a genuine exceptional event or one observation in an already unstable system? The answer also depends on the nature of the defect. A serious safety incident, a compliance breach or a direct risk to customers demands immediate action according to policy even if no statistical alarm has occurred. For ordinary process improvement, however, reacting to every red point as proof of an assignable cause can create needless changes and more variability.
The author has worked with daily performance discussions, loading deviations and hotel reports, but there is no verified personal case in which a particular red cell caused the precise sequence described here.
A red colour is an invitation to verify. It is not a complete explanation.
Constructed scene; the statistical distinction follows the NIST/SEMATECH e-Handbook. The essay named below asks whether it was a bad day or a problem.
- 1Scene
- 2Breakdown
- 3Protocol
Chapter IV · The red number and the wrong blame
A business targe tis not a control limit
Two horizontal lines can look identical on a chart and answer different questions. A business target expresses a desired service level. A statistical control limit is derived from a model of how a process varies when its underlying mechanism is sufficiently stable. A daily value may fail the target while remaining within expected variation; a sudden signal can occur while the value still meets the target.
NIST describes control charts as measurements plotted over time with a centre line and control limits. The limits are chosen according to statistical assumptions and the chart type. For proportions of nonconforming units, a p-chart may be appropriate if the counted opportunities and dependence assumptions support it. A target set by management is neither the centre line nor the upper control limit.
Target
What performance we want or require.
Control limit
What the process model predicts as routine variation.
Safety trigger
What policy requires immediate action regardless of the chart.
Some processes do not justify a Shewhart chart without more work. Varying case mix, serial dependence, changing denominators or an unstable baseline can invalidate a simple formula. Control charts are tools for disciplined investigation, not instant verdicts on individuals.
Missed target, unusual signal and unsafe condition are three separate management questions.
Sources: NIST & SEMATECH, NIST/SEMATECH e-Handbook of Statistical Methods: What are Control Charts? (section 6.3.1), 2026; NIST & SEMATECH, NIST/SEMATECH e-Handbook of Statistical Methods: Proportions Control Charts (section 6.3.3.2), 2026
NIST/SEMATECH e-Handbook, sections 6.3.1 and 6.3.3.2.
- 1Scene
- 2Breakdown
- 3Protocol
Chapter IV · The red number and the wrong blame
The red pointinside the expected range
An illustrative p-chart calculation with fixed sample size and explicit assumptions: UCL = p₀ + 3√[p₀(1 − p₀)/n], with p₀ = 0.015 and n = 1,000 opportunities per day. The upper 3-sigma limit is about 0.0265 (2.65%); the lower limit is about 0.0035 (0.35%).
Synthetic baseline, assuming independent binomial counts
Daily share of incomplete orders, per cent, invented
The day at 2.30% fails the business target but, under this simplified chart, does not cross the upper control limit. That does not certify the day as acceptable: statistical evidence of a changed mechanism is a different question from service adequacy. The calculation assumes a stable historical proportion, independent opportunities and consistent definitions, conditions that real data must be checked for. The UCL is a conventional p-chart calculation, not an employer threshold, and no real baseline is disclosed.
An undesirable rate can be ordinary for a poorly performing process. Routine does not mean good.
Source: NIST & SEMATECH, 2026
Synthetic p-chart example from the NIST proportions-chart formula: 3√(0.015 × 0.985 / 1,000) ≈ 0.0115, so UCL ≈ 2.65% and LCL ≈ 0.35%. No local baseline or test result is claimed.
- 1Scene
- 2Breakdown
- 3Protocol
Chapter IV · The red number and the wrong blame
Investigate the redwithout inventing a culprit
A proportionate response to a data signal, a service breach or a safety risk.
Check immediate risk
Safety, guest-protection and compliance rules first, whenever a hazard is active.
Validate the entry
Source, timestamp, denominator, inclusion rules, pending corrections.
Locate the question
Target miss, unusual process signal, recurring customer harm, or several?
Talk to the process owners
What conditions were present, from senders and receivers; no blame first.
Test an explanation
Comparable periods, case mix and direct observation before changing the routine.
Close the response
Verified, unresolved, next action and who receives feedback.
A team should not have to defend itself against a different root-cause story each morning; nor may statistical caution excuse ignoring a dangerous condition or a chronic service failure. The decision fits the risk and the quality of the evidence.
The right response is not always faster. It is better matched to what the signal actually tells us.
Source: NIST & SEMATECH, 2026
Editorial protocol informed by NIST control-chart guidance and common operational escalation principles.
- 1Scene
- 2Breakdown
- 3Protocol
Chapter V · The scorecard that tells the truth
One average,two different days
When the mix of work changes, an aggregate KPI can tell the opposite story from its components.
Purely numerical illustration, no employer data
A manager reviews two periods of service. In each category of work, performance improves. The simpler requests are completed more reliably; the complex requests are also handled more reliably. Yet the overall on-time percentage falls. No one has falsified a count. The dashboard has changed because the proportion of difficult work has changed dramatically. The manager who reads only the total may conclude that the team has deteriorated. The colleague who reads the categories may conclude that the process has improved. Both can point to correct arithmetic. The missing information is the composition of the denominator. The next page makes the effect visible with synthetic integer counts that anyone can recalculate.
The editorial lesson extends across last-mile, hotel occupancy patterns and wholesale orders: different kinds of work do not necessarily require the same effort, create the same risk or occur in the same mix each day. A fair analysis must preserve the definition and case mix of each cohort.
An average can be correct and still fail to describe the operational change that matters.
Conceptual mathematical illustration of aggregation effects; no implied observation from the author's workplaces. The essay named below explains why KPIs do not improve in Excel.
- 1Scene
- 2Breakdown
- 3Protocol
Chapter V · The scorecard that tells the truth
How both groups improvewhile the t otal falls
A recomputable example of an aggregation reversal caused by changed case mix. Success means on-time completion.
Synthetic example, authored for this volume; not employer data
On-time share by category and in total, invented counts
Both categories improve, yet the overall on-time share falls from about 85.5% to 83.3%, because the demanding category is a far larger share of period B. The totals are not like-for-like comparisons: the reversal is an arithmetic property of the weights, not a real trend. A metric that supports decisions about people should show whether the mix changed and report volumes; segment where risks differ, with sufficient samples and stable definitions, because an arbitrary split creates noise of its own.
Before comparing two totals, ask whether they contain the same kind of work.
All numbers are invented; the computation was checked from integer numerators and denominators: 94/110 = 85.45%, 100/120 = 83.33%.
- 1Scene
- 2Breakdown
- 3Protocol
Chapter V · The scorecard that tells the truth
A scorecardwith a conscience
The measure family must connect operational action to the customer and make its exclusions visible. A useful scorecard is not a table in which every indicator has equal status. Some establish service adequacy; some show process health; some warn of side effects; some qualify interpretation by showing volume, case mix and coverage. A threshold can prompt review without becoming a statement of guilt.
Outcome
Complete and timely service; customer-visible quality.
Process
Departure or handover steps that have a causal rationale.
Balancing
Incomplete orders, rework, unsafe shortcuts or complaint recurrence.
Context
Volume, case mix, exception exposure and seasonality.
Data quality
Coverage, exclusions, delays, corrections and definition changes.
Balanced Scorecard thinking can inform strategy, while IHI measure families help design local improvement. The manager can add a data-quality note: a well-defined rate based on partial records may be precise without being representative. The percentage of records with a valid status is therefore sometimes as important as the reported service rate. Personal identifiers, guest details and confidential operational records should not be placed in a general dashboard; aggregated or demonstrative figures can explain the method without exposing internal information.
The scorecard should make a disputed number easier to investigate, not harder to challenge.
Sources: Robert S. Kaplan & David P. Norton, Harvard Business Review, 1992; Institute for Healthcare Improvement, 2026; NIST & SEMATECH, 2026
Conceptual synthesis after Kaplan and Norton (1992), the IHI's measurement guidance and NIST's data assumptions.
- 1Scene
- 2Breakdown
- 3Protocol
Chapter V · The scorecard that tells the truth
Define the KPIbefore defining success
A compact metric dictionary protects decisions from silent changes to the denominator.
Purpose and user
Who needs the number, and which decision could it support?
Unit and formula
Numerator, denominator, units, event boundary and time window.
Source and freshness
The authoritative source, refresh schedule, known latency and ownership.
Eligibility and exceptions
Exclusions, cancellations, repeats, late entries and case-mix segmentation.
Companion measures
Pair the process metric with a customer result, balancing guardrail and data-quality check.
Govern the changes
Version the definition, retain comparable history and announce changes before comparing periods.
Do not apply an invented definition of Delay or Incomplete to a company whose official metric dictionary has different rules. Nor should the meaning of a hotel report be inferred merely from its title. A professional publication may describe general structures, but a real decision requires the authorised local definition.
The most important part of a KPI may be the small print that explains what is missing.
Source: Institute for Healthcare Improvement, 2026
Editorial metric-dictionary protocol, not an existing approved data-governance standard of any employer.
- 1Scene
- 2Breakdown
- 3Protocol
Chapter VI · Beyond the target
The mee ting that asksone more question
A useful performance review asks for the service result after it sees the number.
Hypothetical management review, no claim of direct experience
A constructed leadership team arrives at a weekly review. One KPI is better than last week. The slides are ready; the celebration is almost immediate. Instead, the chair asks whether the rate is based on comparable work, whether the count is complete and whether any downstream indicator worsened. The analyst can answer two questions but not the third. A small sample is assigned to the process owner, and the outcome is left open until it can be checked. This is not indecision. It is a proportionate refusal to turn an incomplete statistic into a complete claim. The meeting still recognises what is known, and it still honours the people who improved a measured step. It simply avoids attributing a business result that the evidence has not established.
The fictional meeting describes the practice this volume advocates. It is not a reconstructed conversation with supervisors or colleagues from the author's career.
The strongest dashboard is the one that makes an honest “we do not know yet” possible.
Constructed scenario, inspired by statistical process control, balanced measurement and evidence discipline. The essay named below is about talking to someone who made a mistake.
- 1Scene
- 2Breakdown
- 3Protocol
Chapter VI · Beyond the target
Five questionsbefore a verdict
A manager can take accountability for a decision without pretending the metric contains the entire explanation.
Is it defined?
Can another competent reader reproduce the formula, population and period?
Is it trustworthy?
Are records complete, current and consistent with the physical or service process?
Is it different?
Is the change practically meaningful and, where appropriate, an unusual statistical signal?
Is it balanced?
Did the customer result improve without unacceptable safety, quality or downstream costs?
Is it actionable?
Does the responsible team have authority to change the condition causing the result?
The sequence matters. Starting with a new target before validating a denominator creates false urgency. Turning a signal into an accusation before comparing the process creates distrust. Adding ten new metrics without removing stale ones creates work but not insight. Every metric review should have an agreed route for corrections: a corrected number should not quietly replace the old one without an audit trail. If the measure is right but the process is poor, the problem belongs to process improvement; if the indicator is neither reliable nor useful, it may need redesign.
A KPI deserves trust because its meaning and evidence can be inspected, not because it is displayed in colour.
Sources: Donald T. Campbell, Evaluation and Program Planning, 1979 (via Dartmouth occasional paper (1976), reprinted in the Journal of MultiDisciplinary Evaluation (2011)); NIST & SEMATECH, 2026; Institute for Healthcare Improvement, 2026
Editorial framework drawn from Campbell (1979), NIST process-control methods and the IHI's measurement guidance.
- 1Scene
- 2Breakdown
- 3Protocol
Chapter VI · Beyond the target
Be yond the targe t:an operating review
A proposed four-week pilot, with no assumption that every problem can be resolved in a month.
- Week 1Define.
- Week 2Validate.
- Week 3Observe.
- Week 4Review.
Week 1: choose a real decision
One KPI behind a recurring managerial choice, with its official definition.
Week 2: audit a small sample
Freshness, coverage, duplicates, timing and a companion service measure.
Week 3: trace discrepancies
Observe work where a misleading reading may arise; protect staff privacy.
Week 4: agree the decision rule
Owner, escalation conditions, follow-up date, a guardrail against side effects.
After the pilot: compare and explain
Findings, unknowns, changes; the definition revised only with documented governance.
Four weeks are an editorial test cadence, not a proven duration or an employer procedure: a safety-critical finding is escalated at once, a structural redesign may take longer. The output is a more defensible choice and a team that knows what the number means.
Measurement serves management only when management remains responsible for judgment.
Sources: Institute for Healthcare Improvement, 2026; NIST & SEMATECH, 2026
Original editorial pilot after IHI and NIST guidance; not a certified or validated intervention.
Field tool
The HonestKPI Card
One indicator, one decision and an explicit check on what the measure cannot see. Use blank or synthetic data in public examples.
01Purpose and decisionwho uses it, and what choice is it meant to support?
02Exact definitionnumerator, denominator, time window, exclusions and metric owner
03Source and freshnessauthoritative dataset, update lag and known gaps
04Signal or target?business threshold, control-chart assumptions or urgent risk trigger
05Balance and customer impactwhat downstream quality, safety or service measure could worsen?
06Action and feedbacknext verification, named owner, checkpoint and report-back
Sources: Institute for Healthcare Improvement, 2026; NIST & SEMATECH, 2026; Robert S. Kaplan & David P. Norton, Harvard Business Review, 1992
Do not add employee, guest or payment identifiers. If a question has no valid answer, record “not measured” or “not yet verified” rather than fabricating a precise result. One page is enough to expose the difference between a number and a decision.
Closing essay
Responsible forthe purpose
The purpose of a metric is to improve the work, not to replace the work with an attractive description.
A manager needs numbers. Without them, recurring failures can remain anecdotal, improvement becomes difficult to test and the quieter parts of the organisation may never be seen. But measurement also creates a temptation. Once a target is placed on a wall, people begin to talk about it as though it were the purpose of the operation. A green cell offers relief. A red cell invites an explanation. Both feelings arrive before the evidence is necessarily complete. What matters is whether the number still connects to the service it was invented to describe. In the last-mile setting, that means remembering that loading, departure, completeness and customer outcome are linked but not interchangeable. In a hotel, the report and the handover must support work that continues across shifts. In wholesale, an accepted order and a reliable promise are separate accomplishments. The relevant measures differ, but the responsibility to check their meaning is shared.
Campbell reminds us that planned improvement is difficult to evaluate. Goodhart warns that applying pressure can alter the usefulness of a regularity. Holmström and Milgrom explain why disproportionate incentives on measured tasks can distort attention. Bevan and Hood describe risks in a documented public-service setting. IHI and NIST offer tools for building a more balanced and statistically honest review. None of these removes the manager's duty to listen to people, inspect the process and protect the customer. A metric need not be perfect to be useful. It needs a defined scope, a trustworthy source, a companion signal and a person willing to say what is not yet known. When it stops guiding a better decision, its colour becomes a decoration.
A target can be achieved while the purpose of the work is lost. The manager is responsible for noticing the difference.
Editorial conclusion. No manipulation, hidden defect or sanction is attributed to any named employer.
Method
Studies, modelsand me thods
An evidence-informed synthesis, not a field experiment. The last-mile and hotel contexts reflect categories of work described by the author; every stated meeting, individual event and numerical operational dataset is explicitly synthetic.
Theory
Goodhart (1975, via Bevan and Hood), Strathern (1997), Campbell (1979) and Holmström and Milgrom (1991) describe mechanisms, not measured rates.
Observation
Bevan and Hood (2006) and van Thiel and Leeuw (2002) concern public services; their findings are not transferred as outcomes of logistics or hospitality.
Method
Kaplan and Norton (1992), the IHI's measure families and NIST's control-chart sections are design guidance; the p-chart is calculated under its stated assumptions.
Arithmetic
80, 60, 10 and 30 per 1,000; UCL ≈ 2.65% and LCL ≈ 0.35% for p₀ = 0.015 and n = 1,000; 94/110 = 85.5% and 100/120 = 83.3%: all re-checked.
The Honest KPI Card and the four-week cycle are editorial proposals for local testing, not certified interventions. Editorial standard: a theory, an observation, a model and a proposal are named as such, and the sentence stops claiming where the evidence stops.
Sources: Charles Goodhart, 1975 (via Bevan & Hood (2006), quoting the 1984 reprint); Marilyn Strathern, European Review, 1997; Donald T. Campbell, Evaluation and Program Planning, 1979 (via Dartmouth occasional paper (1976), reprinted in the Journal of MultiDisciplinary Evaluation (2011)); Bengt Holmström & Paul Milgrom, Journal of Law, Economics, & Organization 7 (special issue), 1991; Gwyn Bevan & Christopher Hood, Public Administration, 2006; Sandra van Thiel & Frans L. Leeuw, Public Performance & Management Review 25(3), 2002; Robert S. Kaplan & David P. Norton, Harvard Business Review, 1992; Institute for Healthcare Improvement, 2026; NIST & SEMATECH, NIST/SEMATECH e-Handbook of Statistical Methods: What are Control Charts? (section 6.3.1), 2026; NIST & SEMATECH, NIST/SEMATECH e-Handbook of Statistical Methods: Proportions Control Charts (section 6.3.3.2), 2026
Every source is cited at its DOI or page on the next page; the author's PDF gives the p-chart's lower limit as clipping to zero, which the site corrects to about 0.35%.
Sources and method
Where the claimscome from
The figures in this volume come from the sources below, each with its year. The scenes are constructed; the protocols are proposals; what is research is named as research.
- Assessing the impact of planned social changeDonald T. Campbell, Evaluation and Program Planning, 1979 · via Dartmouth occasional paper (1976), reprinted in the Journal of MultiDisciplinary Evaluation (2011)https://doi.org/10.1016/0149-7189(79)90048-X
- Problems of Monetary Management: The U.K. ExperienceCharles Goodhart, 1975 · via Bevan & Hood (2006), quoting the 1984 reprint
- ‘Improving ratings’: audit in the British University systemMarilyn Strathern, European Review, 1997https://www.cambridge.org/core/journals/european-review/article/improving-ratings-audit-in-the-british-university-system/FC2EE640C0C44E3DB87C29FB666E9AAB
- Multitask Principal-Agent Analyses: Incentive Contracts, Asset Ownership, and Job DesignBengt Holmström & Paul Milgrom, Journal of Law, Economics, & Organization 7 (special issue), 1991https://doi.org/10.1093/jleo/7.special_issue.24
- The Balanced Scorecard: Measures That Drive PerformanceRobert S. Kaplan & David P. Norton, Harvard Business Review, 1992
- What’s measured is what matters: targets and gaming in the English public health care systemGwyn Bevan & Christopher Hood, Public Administration, 2006https://doi.org/10.1111/j.1467-9299.2006.00600.x
- The Performance Paradox in the Public SectorSandra van Thiel & Frans L. Leeuw, Public Performance & Management Review 25(3), 2002https://doi.org/10.1080/15309576.2002.11643661
- Establishing Measures (Model for Improvement)Institute for Healthcare Improvement, 2026https://www.ihi.org/library/model-for-improvement/establishing-measures
- NIST/SEMATECH e-Handbook of Statistical Methods: What are Control Charts? (section 6.3.1)NIST & SEMATECH, 2026https://www.itl.nist.gov/div898/handbook/pmc/section3/pmc31.htm
- NIST/SEMATECH e-Handbook of Statistical Methods: Proportions Control Charts (section 6.3.3.2)NIST & SEMATECH, 2026https://www.itl.nist.gov/div898/handbook/pmc/section3/pmc332.htm
Management without theatre.
Every volume, one question about operations, followed from the floor to the protocol and tested against research.
All volumes
stivencatalyst.com/magazine/operational-treatise.html
Operational Treatise · Volume 6 · October 2026 · Stiven Catalyst
Click or swipe a page to turn it. The arrow keys work too.
Operational Treatise · Volume 6
The figures of the volume
The charts of the printed pages, with their sources. Invented examples are marked as such.
Source: Invented example by the editors, so the arithmetic can be checked; not a measurement
Source: Invented example by the editors, so the arithmetic can be checked; not a measurement
Source: Invented example by the editors, so the arithmetic can be checked; not a measurement
The whole text Read the volume as text For reading on a small screen, searching or a screen reader. The same words, without the page design.
Editorial
A green score can hide a bad day
Measurement is necessary. The problem begins when the number becomes easier to defend than the purpose it was supposed to serve.
Operations managers do not have the luxury of managing only by instinct. A departure must be on time or late. A load must be complete or incomplete. A room must be ready or not. Every shift creates facts that deserve a record. Yet those records become dangerous when an indicator designed to reveal the work is treated as a complete judgment on the people and the service. The author has worked with last-mile measures such as Delay, Damage, Incomplete and Loading Time, and with reporting and handovers in hospitality. These contexts explain why a KPI can be both useful and incomplete. This sixth volume does not claim that any named employer manipulated a target, hid a defect or punished staff on the basis of a misleading dashboard. Its operational scenes are constructed illustrations, clearly marked wherever an event or measurement is invented. We begin with a deceptively positive score. Campbell and Goodhart explain why high-pressure targets can weaken the measures intended to guide management. Holmström and Milgrom show the incentives problem when some tasks are measurable and others less visible. Bevan and Hood provide a documented public-service case of gaming risk. Statistical process control distinguishes a management target from evidence of a changed process. The final chapters put the measures back into a balanced, auditable decision.
Stiven Janaqi, Editor
How every chap ter is built
- The living scene. A shift, a ramp, a desk at 03:00: one piece of work followed as it actually happens, with the hand-off where it breaks. Scenes are constructed from real categories of work and say so.
- The conce
p tual and scientific breakdown. The mechanism behind the scene, named with the model that explains it, and the research that tests it: the study, its population, its year and its limits, before it is applied anywhere else. - The operating pro
t ocol for action. What a working team can try on Monday: fields, questions, a cadence and a count, each with an owner, a next step and a return of information to the people who do the work.
The reading contract
- Field. Real categories of operational work, no invented personal incidents.
- Evidence. Research setting, date, method and limits stated together.
- Action. A KPI decision must survive a customer-and-quality check.
Research note
What a KPI study is allowed t o say
A correlation between a target and a behaviour is not proof that every target causes manipulation.
This volume combines several kinds of evidence: theoretical papers on how control pressure or unequal measurement can alter behaviour, observational public-service research on documented risks in one institutional setting, statistical quality-control guidance on telling routine variation from unusual signals, and improvement guidance on practical families of measures. They produce no universal percentage for KPI gaming, establish no falsified result by anyone in the author's work, and do not show that a three-metric dashboard always prevents harmful incentives. They justify a disciplined set of questions for local verification.
- Observed. Publisher-identified finding, population, date and method.
- Modelled. Mathematical example with assumptions and reproducible inputs.
- Proposed. Editorial control, owner and test, awaiting local evidence.
A green score can be both mathematically correct and operationally inadequate if the definition excludes a relevant customer consequence. Likewise, a red score can be a legitimate warning without proving misconduct or an unusual process shift. The reader should ask what the numerator and denominator mean, who is excluded, when events are counted and what happens outside the visible boundary.
Our reading
This is an evidence-informed operational treatise, not a statistical study of the author's workplaces.
Campbell (1979), Holmström and Milgrom (1991), Bevan and Hood (2006), the NIST/SEMATECH e-Handbook and the IHI; all numerical operational cases are invented.
Sources: Donald T. Campbell, Evaluation and Program Planning, 1979 (via Dartmouth occasional paper (1976), reprinted in the Journal of MultiDisciplinary Evaluation (2011)); Bengt Holmström & Paul Milgrom, Journal of Law, Economics, & Organization 7 (special issue), 1991; Gwyn Bevan & Christopher Hood, Public Administration, 2006; NIST & SEMATECH, 2026; Institute for Healthcare Improvement, 2026
Chap ter I: The green score, the broken promise
Layer 1 · The living scene
The green score, the broken promise
The dashboard is satisfied. The receiving person is not.
Hypothetical last-mile scene, no documented incident
At a constructed loading station, a manager sees that departures are occurring faster than last week. The Loading Time indicator is green. The team has earned the result shown on its screen: the recorded interval from the defined start to the defined end is shorter. A delivery issue appears later. One part of an order has not reached the person who expected it. The departure statistic remains unchanged because the defect belongs to a different measure. Nothing in this scene proves that loading speed caused the missing item. The shortfall could have begun in preparation, recording, sorting, loading or a later handover. The managerial temptation is to tell the easy story: one measure improved and another person made a mistake. That is precisely the story that must be tested rather than announced.
The author's documented last-mile work included Loading Time, Incomplete, missing bags and mixed trolleys as categories of operational attention. The event, its sequence and its outcome here are fictional. We use them only to ask what a metric can certify, and what it cannot.
Our reading
A metric can be accurate within its boundary and still tell too little about the customer's experience.
Editorial composite of real operational categories; conceptual background in the IHI's outcome, process and balancing measures. The essay named below reads a machine's report the same way.
More in the essay: The report a machine wrote
Layer 2 · The conceptual and scientific breakdown
The measure is not the mission
Every indicator has a definition; every service has a larger purpose. A loading-time measure concerns one interval in a process. An incomplete-delivery measure concerns a different failure mode, and its denominator may count orders, bags or another unit. Both can be meaningful without being interchangeable. A percentage with an ambiguous denominator is not yet decision-grade evidence.
The Institute for Healthcare Improvement distinguishes outcome, process and balancing measures. Outcome asks whether the service produces the intended result. Process asks whether the critical steps are working. Balancing asks whether the intervention creates new trouble elsewhere. This is a useful design lens outside healthcare, but the actual measures and acceptance criteria must be defined within the local operation.
- Process. Loading interval, scan-completion rate or a defined on-time handover.
- Ou
t come. Complete, correct and timely service for the recipient. - Balancing. Missing items, rework, safety deviations or new downstream waiting.
It is tempting to merge these numbers into a single score. But a weighted average can conceal a severe outcome unless the weights, veto conditions and customer priorities are explicit. Some failures should never be traded away against faster throughput. The definition of an acceptable result comes before the dashboard design.
Our reading
Ask what changed for the customer before declaring that an internal target has been won.
IHI, Establishing Measures; the logistics mapping is editorial, not validated at an identified site.
Source: Institute for Healthcare Improvement, 2026
Layer 3 · The operating protocol for action
Read the green before you celebrate
A five-step review that tests a favourable KPI against the end-to-end service.
- Name the indica
t or boundary. Operational start, end, exclusions, time window, numerator, denominator and data source. - Check the underlying work. Are the events counted as good complete and usable downstream? Sample anonymised cases where permitted.
- Pair the cus
t omer out come. Read the service outcome and a balancing measure next to the improved process KPI. - Test plausible alternatives. Case mix, volume, cut-off rules, staffing and exceptional days, before assigning a cause.
- Document the decision. What was confirmed, what is still unknown, who will verify it and when the team will hear back.
When Loading Time improves, also read completeness, on-time service and safety records. Two numbers moving together prove no cause; check that they share time windows and units, since a same-day process number and a next-day customer result may need aligning.
Our reading
A green number should begin a short verification, not end the conversation.
Editorial operating protocol after the IHI's measurement guidance; no claim of a formal employer-wide implementation.
Source: Institute for Healthcare Improvement, 2026
Chap ter II: When a measure becomes a targe t
Layer 1 · The living scene
The targe t changes the room
A measurement programme can alter the very activity it is intended to observe.
Constructed team meeting, not a recorded discussion
In a fictional operations review, a manager announces that the only figure shown at the weekly meeting will be one rate of punctual departure. People naturally begin to focus their attention on the recorded departure event. Questions once asked about preparation accuracy, delayed information and recovery after a late start receive less time. The score remains useful, but the meeting has become narrower. No dishonest action is necessary for this shift to happen. People respond to what receives attention, praise and consequences. Staff may do exactly the work the formal measure encourages while leaving less measured responsibilities unattended. The risk is not a defect in the arithmetic; it is a defect in the design of the incentive system.
This is not an allegation about any named employer or person. The point is to introduce a documented theoretical concern: when we convert a diagnostic indicator into a strong control target, its relationship to the work can change.
Our reading
The stronger the consequence attached to one indicator, the more carefully its blind spots must be examined.
Constructed scenario; theory in Goodhart (1975), Campbell (1979) and Holmström and Milgrom (1991). The essay named below asks which KPIs a team trusts.
More in the essay: KPIs the team trusts
Layer 2 · The conceptual and scientific breakdown
Goodhar t is a warning, not a law of fate
The familiar slogan is a later generalisation of an earlier observation about statistical regularities.
Charles Goodhart observed in monetary-policy analysis that a regularity used for control can cease to behave as it did before control. A popular paraphrase, associated with Marilyn Strathern's discussion of audit culture, says that a measure can cease to be a good measure when it becomes a target. These are related formulations, not two quotations from the same original text. Neither means that every target must fail. Their use in this volume is to challenge the assumption that a measure remains neutral after rewards and penalties are attached. Donald Campbell's 1979 treatment of planned social change also reminds evaluators that observed indicators may fail to reveal whether an intervention really caused the intended improvement. In complex systems, changing conditions and other interventions may move the same measure. A good trend can be real, an artefact of changed definitions or an effect of other influences.
- Proxy. The number represents only some qualities of the outcome.
- Pressure. Visibility and consequences change incentives and attention.
- Validi
t y. Recheck whether the proxy still describes the outcome.
Our reading
The problem is not using a target. It is forgetting that the target changes the context in which the measure is produced.
Goodhart (1975) as quoted by Bevan and Hood (2006); Strathern (1997) for the paraphrase; Campbell (1979). The three cards are editorial.
Sources: Charles Goodhart, 1975 (via Bevan & Hood (2006), quoting the 1984 reprint); Marilyn Strathern, European Review, 1997; Donald T. Campbell, Evaluation and Program Planning, 1979 (via Dartmouth occasional paper (1976), reprinted in the Journal of MultiDisciplinary Evaluation (2011))
Layer 2 · The conceptual and scientific breakdown
What ge ts measured ge ts effor t
Multitask incentive theory explains why narrow scores can crowd out responsibilities that are difficult to quantify. Holmström and Milgrom's 1991 multitask principal-agent analysis studies how the design of rewards influences the allocation of effort across duties. In a job with several responsibilities, strong incentives tied to only the measurable ones can divert attention from the others. This is a theoretical mechanism, not an empirical measurement of the author's colleagues.
A dispatcher does more than watch one dashboard: they coordinate, verify exceptions and communicate. A night auditor does more than generate a report: open work must be conveyed accurately to the next shift. A wholesale account manager does more than accept orders: availability and promises must remain credible. In each setting, some valuable activity is harder to capture in a clean daily percentage.
- Last-mile: on-time depa
r tures are easyt o count. Downstream completeness is easy to miss. - Hotel handover: the repo
r t was sent. Whether the next shift can act is easy to miss. - Wholesale: orders acce
p ted. Promise fulfilment is easy to miss.
The rows are an editorial illustration of how task definitions can differ, not a claim that any of the three organisations paid incentives on these measures. A reasonable scorecard should include the harder-to-see responsibilities, through sampling or qualitative verification where numerical proxies are inadequate.
Our reading
When effort has several purposes, a single rewarded number rarely describes all of them.
Holmström and Milgrom, Journal of Law, Economics, & Organization 7 (special issue), 1991; the work examples are interpretive.
Source: Bengt Holmström & Paul Milgrom, Journal of Law, Economics, & Organization 7 (special issue), 1991
Layer 2 · The conceptual and scientific breakdown
When measurement becomes a game
Published evidence from public services illustrates risks without proving identical behaviour in private operations.
Gwyn Bevan and Christopher Hood studied target-based governance in the English public healthcare system and described reported success alongside measurement problems and gaming risk. Their 2006 paper examines a particular policy environment, with high-stakes public targets and accountability arrangements. Its context matters: hospital services, political governance and public reporting are not the same as a privately operated loading ramp or hotel shift. Sandra van Thiel and Frans Leeuw described the performance paradox in the public sector: growing quantities of performance information may coexist with declining insight into actual performance, tunnel vision or analysis paralysis. Again, this is not evidence that the author has witnessed gaming. It is a reason to examine what the chosen indicator excludes and how the organisation responds to it.
The practical response is not to accuse individuals whenever a score looks unusually good. Investigate the metric definition, any changes in eligibility or timing, the quality of supporting records, the incentives attached to the score and what independent customer outcomes say.
Our reading
A surprising score is a question for verification, not an accusation against the team.
Bevan and Hood, Public Administration 84(3), 2006; van Thiel and Leeuw, Public Performance & Management Review 25(3), 2002.
Sources: Gwyn Bevan & Christopher Hood, Public Administration, 2006; Sandra van Thiel & Frans L. Leeuw, Public Performance & Management Review 25(3), 2002
Layer 3 · The operating protocol for action
Keep the targe t from eating the measure
Five safeguards before an indicator is attached to praise, ranking or consequences.
- Keep a diagnostic copy. The measure used to learn stays separate from the number used to judge.
- Name what the proxy cannot see. The responsibilities that get no number, and how they will be sampled.
- Add a counter-measure. A balancing indicator that would worsen if the target were pursued too narrowly.
- Fre
e ze the definition. Eligibility, timing and exclusions versioned before the first comparison. - Review the incentive, not only the score. Ask periodically what the target has started to reward, and what it has stopped noticing.
An unusually good score deserves the same review as a bad one: the definition, the records behind it, any change in eligibility or timing, and what independent customer outcomes say. None of this presumes misconduct; it keeps the measure worth trusting.
Our reading
A target is safe to use only while someone still checks what it has stopped measuring.
Editorial protocol after Goodhart, Campbell, Holmström and Milgrom and Bevan and Hood; the author's PDF folds these safeguards into its research page.
Sources: Charles Goodhart, 1975 (via Bevan & Hood (2006), quoting the 1984 reprint); Donald T. Campbell, Evaluation and Program Planning, 1979 (via Dartmouth occasional paper (1976), reprinted in the Journal of MultiDisciplinary Evaluation (2011)); Bengt Holmström & Paul Milgrom, Journal of Law, Economics, & Organization 7 (special issue), 1991; Gwyn Bevan & Christopher Hood, Public Administration, 2006
Chap ter III: The hidden cost of one KPI
Layer 1 · The living scene
The fast process and the extra work
Local speed can improve while an adjacent task inherits additional effort.
Hypothetical service flow, no measured employer result
Imagine a team that reduces the time needed to close an incoming request. The dashboard shows more requests marked as processed before the deadline. A downstream colleague finds that some requests now arrive without information necessary to complete the service. The originating team may be doing the measured part faster, while the receiving team spends more time clarifying incomplete handovers. Neither the handover defect nor its cause is established by this short story. A proper inquiry would compare a sample of records before and after the change, verify whether the same type of requests were counted and distinguish a real process-design problem from a coincidence. The team needs a measure of work usable at the next step, not only the date at which the first step was marked finished.
This scenario applies to orders, shift handovers and support requests in principle. It is deliberately not a factual claim about specific guest complaints, transactions, route adjustments or a documented process intervention.
Our reading
Faster completion at the first desk is not necessarily faster delivery to the customer.
Hypothetical comparison; conceptual sources the IHI's balancing measures and Kaplan and Norton (1992). The essay named below follows a part of an order that went missing.
More in the essay: Where part of the order goes missing
Layer 2 · The conceptual and scientific breakdown
A balanced se t is not a crowded dashboard
The point is to protect the purpose of the work with complementary measures, not to measure everything. Kaplan and Norton introduced the Balanced Scorecard in 1992 to broaden attention beyond traditional financial measures, combining perspectives on customers, internal processes and organisational capability. It is a strategic management approach, not a rule that every operational dashboard must reproduce four boxes unchanged. A useful front-line scorecard can be simpler.
The IHI's outcome, process and balancing distinction provides a concrete test. If one team is asked to improve a process indicator, the review should include a result experienced by the customer and a countermeasure that can detect unwanted costs elsewhere. Measurement may also require a qualitative sample, because a tally of completed forms cannot tell whether the receiving colleague understands the open case.
- Ou
t come. The result a customer or receiving team actually values. - Process. A controllable step plausibly connected to that result.
- Balancing. What might deteriorate if the process score is pushed.
More measures can also create more noise. Choose a small family with different jobs; remove duplicates; define ownership; decide how often to review each. Any safety-critical exception should be visible in its own right rather than averaged away by a more favourable speed figure.
Our reading
A balanced scorecard is a discipline of looking at the whole result, not an excuse for multiplying targets.
Kaplan and Norton, Harvard Business Review, January–February 1992; IHI, Establishing Measures.
Sources: Robert S. Kaplan & David P. Norton, Harvard Business Review, 1992; Institute for Healthcare Improvement, 2026
Layer 2 · The conceptual and scientific breakdown
One measure improves. Another changes.
A completely synthetic numerical example shows why two indicators must be examined together: two periods of 1,000 orders each.
Synthetic example, authored for this volume; not employer data
Frequency per 1,000 orders, invented: Late, period A 80 · 8.0%, Late, period B 60 · 6.0%, Incomplete, period A 10 · 1.0%, Incomplete, period B 30 · 3.0%.
The late-order rate falls by two percentage points while the incomplete-order rate rises by two points. We have described two facts about the artificial table. We have not demonstrated that faster departures caused incomplete orders, nor decided whether one percentage point has the same value in the two outcomes. Also, a late and an incomplete order may be the same order: the counts cannot simply be added to infer a unique number of affected orders. A genuine analysis would need event definitions, overlap handling, confidence considerations, customer severity, comparable volume and evidence about the process change. Without those, the apparent trade-off is only a prompt for investigation.
Our reading
Do not add percentages with different meanings, and do not infer a cause from two lines on a chart.
Every value on this page is synthetic, authored for this volume; measure taxonomy after the IHI.
Source: Institute for Healthcare Improvement, 2026
Layer 3 · The operating protocol for action
Put a guardrail beside the goal
A practical protocol for reviewing an improvement without relocating its cost.
- State the primary goal. The customer effect and the operational metric intended to lead toward it.
- Name a possible side effect. One or two plausible downstream or safety consequences.
- Align the measurement scope. Match population, period and unit of analysis; record known missingness.
- Decide before the pilot. Review triggers and non-negotiable stop conditions where policy warrants them.
- Check both sides. The result, the balancing signal and a small sample of actual work.
- Preserve the distinction. Worked, partially worked or not yet knowable: record which.
For a hotel handover, a timely report is one thing; whether the next shift has enough actionable information is another. For last-mile loading, departure timing and completeness may deserve paired attention. These are design proposals, not already verified combined KPIs for the author's workplaces.
Our reading
You do not need a perfect dashboard to avoid celebrating a problem transferred to another team.
Editorial operating protocol from the IHI's measure families and Kaplan and Norton's balanced-performance lens.
Sources: Institute for Healthcare Improvement, 2026; Robert S. Kaplan & David P. Norton, Harvard Business Review, 1992
Chap ter IV: The red number and the wrong blame
Layer 1 · The living scene
The day the dashboard turns red
A worse number may require attention now. It does not always justify changing the process tomorrow.
Constructed manager review, no claimed event
A manager sees a red daily rate on a performance screen. It is above a target. The instinct is to ask who caused it, and then to call an immediate meeting. But one daily proportion contains several questions that the colour cannot answer: How many opportunities were counted? Has the definition changed? Does the process normally fluctuate? Is this a genuine exceptional event or one observation in an already unstable system? The answer also depends on the nature of the defect. A serious safety incident, a compliance breach or a direct risk to customers demands immediate action according to policy even if no statistical alarm has occurred. For ordinary process improvement, however, reacting to every red point as proof of an assignable cause can create needless changes and more variability.
The author has worked with daily performance discussions, loading deviations and hotel reports, but there is no verified personal case in which a particular red cell caused the precise sequence described here.
Our reading
A red colour is an invitation to verify. It is not a complete explanation.
Constructed scene; the statistical distinction follows the NIST/SEMATECH e-Handbook. The essay named below asks whether it was a bad day or a problem.
More in the essay: A bad day or a problem?
Layer 2 · The conceptual and scientific breakdown
A business targe t is not a control limit
Two horizontal lines can look identical on a chart and answer different questions. A business target expresses a desired service level. A statistical control limit is derived from a model of how a process varies when its underlying mechanism is sufficiently stable. A daily value may fail the target while remaining within expected variation; a sudden signal can occur while the value still meets the target.
NIST describes control charts as measurements plotted over time with a centre line and control limits. The limits are chosen according to statistical assumptions and the chart type. For proportions of nonconforming units, a p-chart may be appropriate if the counted opportunities and dependence assumptions support it. A target set by management is neither the centre line nor the upper control limit.
- Targ
e t. What performance we want or require. - Control limit. What the process model predicts as routine variation.
- Saf
e t y trigger. What policy requires immediate action regardless of the chart.
Some processes do not justify a Shewhart chart without more work. Varying case mix, serial dependence, changing denominators or an unstable baseline can invalidate a simple formula. Control charts are tools for disciplined investigation, not instant verdicts on individuals.
Our reading
Missed target, unusual signal and unsafe condition are three separate management questions.
NIST/SEMATECH e-Handbook, sections 6.3.1 and 6.3.3.2.
Sources: NIST & SEMATECH, NIST/SEMATECH e-Handbook of Statistical Methods: What are Control Charts? (section 6.3.1), 2026; NIST & SEMATECH, NIST/SEMATECH e-Handbook of Statistical Methods: Proportions Control Charts (section 6.3.3.2), 2026
Layer 2 · The conceptual and scientific breakdown
The red point inside the expected range
An illustrative p-chart calculation with fixed sample size and explicit assumptions: UCL = p₀ + 3√[p₀(1 − p₀)/n], with p₀ = 0.015 and n = 1,000 opportunities per day. The upper 3-sigma limit is about 0.0265 (2.65%); the lower limit is about 0.0035 (0.35%).
Synthetic baseline, assuming independent binomial counts
Daily share of incomplete orders, per cent, invented: Business target 1.00%, Baseline p₀ 1.50%, Observed day 23/1,000 = 2.30%, Upper control limit 2.65%.
The day at 2.30% fails the business target but, under this simplified chart, does not cross the upper control limit. That does not certify the day as acceptable: statistical evidence of a changed mechanism is a different question from service adequacy. The calculation assumes a stable historical proportion, independent opportunities and consistent definitions, conditions that real data must be checked for. The UCL is a conventional p-chart calculation, not an employer threshold, and no real baseline is disclosed.
Our reading
An undesirable rate can be ordinary for a poorly performing process. Routine does not mean good.
Synthetic p-chart example from the NIST proportions-chart formula: 3√(0.015 × 0.985 / 1,000) ≈ 0.0115, so UCL ≈ 2.65% and LCL ≈ 0.35%. No local baseline or test result is claimed.
Source: NIST & SEMATECH, 2026
Layer 3 · The operating protocol for action
Investigate the red without inventing a culprit
A proportionate response to a data signal, a service breach or a safety risk.
- Check immediate risk. Safety, guest-protection and compliance rules first, whenever a hazard is active.
- Validate the entry. Source, timestamp, denominator, inclusion rules, pending corrections.
- Locate the question. Target miss, unusual process signal, recurring customer harm, or several?
- Talk
t o the process owners. What conditions were present, from senders and receivers; no blame first. - Test an explanation. Comparable periods, case mix and direct observation before changing the routine.
- Close the response. Verified, unresolved, next action and who receives feedback.
A team should not have to defend itself against a different root-cause story each morning; nor may statistical caution excuse ignoring a dangerous condition or a chronic service failure. The decision fits the risk and the quality of the evidence.
Our reading
The right response is not always faster. It is better matched to what the signal actually tells us.
Editorial protocol informed by NIST control-chart guidance and common operational escalation principles.
Source: NIST & SEMATECH, 2026
Chap ter V: The scorecard that tells the truth
Layer 1 · The living scene
One average, two different days
When the mix of work changes, an aggregate KPI can tell the opposite story from its components.
Purely numerical illustration, no employer data
A manager reviews two periods of service. In each category of work, performance improves. The simpler requests are completed more reliably; the complex requests are also handled more reliably. Yet the overall on-time percentage falls. No one has falsified a count. The dashboard has changed because the proportion of difficult work has changed dramatically. The manager who reads only the total may conclude that the team has deteriorated. The colleague who reads the categories may conclude that the process has improved. Both can point to correct arithmetic. The missing information is the composition of the denominator. The next page makes the effect visible with synthetic integer counts that anyone can recalculate.
The editorial lesson extends across last-mile, hotel occupancy patterns and wholesale orders: different kinds of work do not necessarily require the same effort, create the same risk or occur in the same mix each day. A fair analysis must preserve the definition and case mix of each cohort.
Our reading
An average can be correct and still fail to describe the operational change that matters.
Conceptual mathematical illustration of aggregation effects; no implied observation from the author's workplaces. The essay named below explains why KPIs do not improve in Excel.
More in the essay: KPIs do not improve in Excel
Layer 2 · The conceptual and scientific breakdown
How both groups improve while the t otal falls
A recomputable example of an aggregation reversal caused by changed case mix. Success means on-time completion.
Synthetic example, authored for this volume; not employer data
On-time share by category and in total, invented counts: Standard work: Period A 90/100 = 90.0%, Period B 20/20 = 100%; Complex work: Period A 4/10 = 40.0%, Period B 80/100 = 80.0%; All work: Period A 94/110 = 85.5%, Period B 100/120 = 83.3%.
Both categories improve, yet the overall on-time share falls from about 85.5% to 83.3%, because the demanding category is a far larger share of period B. The totals are not like-for-like comparisons: the reversal is an arithmetic property of the weights, not a real trend. A metric that supports decisions about people should show whether the mix changed and report volumes; segment where risks differ, with sufficient samples and stable definitions, because an arbitrary split creates noise of its own.
Our reading
Before comparing two totals, ask whether they contain the same kind of work.
All numbers are invented; the computation was checked from integer numerators and denominators: 94/110 = 85.45%, 100/120 = 83.33%.
Layer 2 · The conceptual and scientific breakdown
A scorecard with a conscience
The measure family must connect operational action to the customer and make its exclusions visible. A useful scorecard is not a table in which every indicator has equal status. Some establish service adequacy; some show process health; some warn of side effects; some qualify interpretation by showing volume, case mix and coverage. A threshold can prompt review without becoming a statement of guilt.
- Ou
t come. Complete and timely service; customer-visible quality. - Process. Departure or handover steps that have a causal rationale.
- Balancing. Incomplete orders, rework, unsafe shortcuts or complaint recurrence.
- Context. Volume, case mix, exception exposure and seasonality.
- Data quali
t y. Coverage, exclusions, delays, corrections and definition changes.
Balanced Scorecard thinking can inform strategy, while IHI measure families help design local improvement. The manager can add a data-quality note: a well-defined rate based on partial records may be precise without being representative. The percentage of records with a valid status is therefore sometimes as important as the reported service rate. Personal identifiers, guest details and confidential operational records should not be placed in a general dashboard; aggregated or demonstrative figures can explain the method without exposing internal information.
Our reading
The scorecard should make a disputed number easier to investigate, not harder to challenge.
Conceptual synthesis after Kaplan and Norton (1992), the IHI's measurement guidance and NIST's data assumptions.
Sources: Robert S. Kaplan & David P. Norton, Harvard Business Review, 1992; Institute for Healthcare Improvement, 2026; NIST & SEMATECH, 2026
Layer 3 · The operating protocol for action
Define the KPI before defining success
A compact metric dictionary protects decisions from silent changes to the denominator.
- Purpose and user. Who needs the number, and which decision could it support?
- Unit and formula. Numerator, denominator, units, event boundary and time window.
- Source and freshness. The authoritative source, refresh schedule, known latency and ownership.
- Eligibili
t y and excep tions. Exclusions, cancellations, repeats, late entries and case-mix segmentation. - Companion measures. Pair the process metric with a customer result, balancing guardrail and data-quality check.
- Govern the changes. Version the definition, retain comparable history and announce changes before comparing periods.
Do not apply an invented definition of Delay or Incomplete to a company whose official metric dictionary has different rules. Nor should the meaning of a hotel report be inferred merely from its title. A professional publication may describe general structures, but a real decision requires the authorised local definition.
Our reading
The most important part of a KPI may be the small print that explains what is missing.
Editorial metric-dictionary protocol, not an existing approved data-governance standard of any employer.
Source: Institute for Healthcare Improvement, 2026
Chap ter VI: Be yond the targe t
Layer 1 · The living scene
The mee ting that asks one more question
A useful performance review asks for the service result after it sees the number.
Hypothetical management review, no claim of direct experience
A constructed leadership team arrives at a weekly review. One KPI is better than last week. The slides are ready; the celebration is almost immediate. Instead, the chair asks whether the rate is based on comparable work, whether the count is complete and whether any downstream indicator worsened. The analyst can answer two questions but not the third. A small sample is assigned to the process owner, and the outcome is left open until it can be checked. This is not indecision. It is a proportionate refusal to turn an incomplete statistic into a complete claim. The meeting still recognises what is known, and it still honours the people who improved a measured step. It simply avoids attributing a business result that the evidence has not established.
The fictional meeting describes the practice this volume advocates. It is not a reconstructed conversation with supervisors or colleagues from the author's career.
Our reading
The strongest dashboard is the one that makes an honest “we do not know yet” possible.
Constructed scenario, inspired by statistical process control, balanced measurement and evidence discipline. The essay named below is about talking to someone who made a mistake.
More in the essay: How to talk to someone who made a mistake
Layer 2 · The conceptual and scientific breakdown
Five questions before a verdict
A manager can take accountability for a decision without pretending the metric contains the entire explanation.
- Is it defined?. Can another competent reader reproduce the formula, population and period?
- Is it trustwo
r thy?. Are records complete, current and consistent with the physical or service process? - Is it different?. Is the change practically meaningful and, where appropriate, an unusual statistical signal?
- Is it balanced?. Did the customer result improve without unacceptable safety, quality or downstream costs?
- Is it actionable?. Does the responsible team have authority to change the condition causing the result?
The sequence matters. Starting with a new target before validating a denominator creates false urgency. Turning a signal into an accusation before comparing the process creates distrust. Adding ten new metrics without removing stale ones creates work but not insight. Every metric review should have an agreed route for corrections: a corrected number should not quietly replace the old one without an audit trail. If the measure is right but the process is poor, the problem belongs to process improvement; if the indicator is neither reliable nor useful, it may need redesign.
Our reading
A KPI deserves trust because its meaning and evidence can be inspected, not because it is displayed in colour.
Editorial framework drawn from Campbell (1979), NIST process-control methods and the IHI's measurement guidance.
Sources: Donald T. Campbell, Evaluation and Program Planning, 1979 (via Dartmouth occasional paper (1976), reprinted in the Journal of MultiDisciplinary Evaluation (2011)); NIST & SEMATECH, 2026; Institute for Healthcare Improvement, 2026
Layer 3 · The operating protocol for action
Be yond the targe t: an operating review
A proposed four-week pilot, with no assumption that every problem can be resolved in a month.
- Week 1 Define.
- Week 2 Validate.
- Week 3 Observe.
- Week 4 Review.
- Week 1: choose a real decision. One KPI behind a recurring managerial choice, with its official definition.
- Week 2: audit a small sample. Freshness, coverage, duplicates, timing and a companion service measure.
- Week 3: trace discrepancies. Observe work where a misleading reading may arise; protect staff privacy.
- Week 4: agree the decision rule. Owner, escalation conditions, follow-up date, a guardrail against side effects.
- A
f ter the pilot: compare and explain. Findings, unknowns, changes; the definition revised only with documented governance.
Four weeks are an editorial test cadence, not a proven duration or an employer procedure: a safety-critical finding is escalated at once, a structural redesign may take longer. The output is a more defensible choice and a team that knows what the number means.
Our reading
Measurement serves management only when management remains responsible for judgment.
Original editorial pilot after IHI and NIST guidance; not a certified or validated intervention.
Sources: Institute for Healthcare Improvement, 2026; NIST & SEMATECH, 2026
Field tool
The Honest KPI Card
One indicator, one decision and an explicit check on what the measure cannot see. Use blank or synthetic data in public examples.
- Purpose and decision who uses it, and what choice is it meant to support?
- Exact definition numerator, denominator, time window, exclusions and metric owner
- Source and freshness authoritative dataset, update lag and known gaps
- Signal or targ
e t? business threshold, control-chart assumptions or urgent risk trigger - Balance and cus
t omer impact what downstream quality, safety or service measure could worsen? - Action and feedback next verification, named owner, checkpoint and report-back
Do not add employee, guest or payment identifiers. If a question has no valid answer, record “not measured” or “not yet verified” rather than fabricating a precise result. One page is enough to expose the difference between a number and a decision.
Sources: Institute for Healthcare Improvement, 2026; NIST & SEMATECH, 2026; Robert S. Kaplan & David P. Norton, Harvard Business Review, 1992
Open the tool: KPI Diagnostic
Closing essay
Responsible for the purpose
The purpose of a metric is to improve the work, not to replace the work with an attractive description.
A manager needs numbers. Without them, recurring failures can remain anecdotal, improvement becomes difficult to test and the quieter parts of the organisation may never be seen. But measurement also creates a temptation. Once a target is placed on a wall, people begin to talk about it as though it were the purpose of the operation. A green cell offers relief. A red cell invites an explanation. Both feelings arrive before the evidence is necessarily complete. What matters is whether the number still connects to the service it was invented to describe. In the last-mile setting, that means remembering that loading, departure, completeness and customer outcome are linked but not interchangeable. In a hotel, the report and the handover must support work that continues across shifts. In wholesale, an accepted order and a reliable promise are separate accomplishments. The relevant measures differ, but the responsibility to check their meaning is shared.
Campbell reminds us that planned improvement is difficult to evaluate. Goodhart warns that applying pressure can alter the usefulness of a regularity. Holmström and Milgrom explain why disproportionate incentives on measured tasks can distort attention. Bevan and Hood describe risks in a documented public-service setting. IHI and NIST offer tools for building a more balanced and statistically honest review. None of these removes the manager's duty to listen to people, inspect the process and protect the customer. A metric need not be perfect to be useful. It needs a defined scope, a trustworthy source, a companion signal and a person willing to say what is not yet known. When it stops guiding a better decision, its colour becomes a decoration.
Our reading
A target can be achieved while the purpose of the work is lost. The manager is responsible for noticing the difference.
Editorial conclusion. No manipulation, hidden defect or sanction is attributed to any named employer.
Method
Studies, models and me thods
An evidence-informed synthesis, not a field experiment. The last-mile and hotel contexts reflect categories of work described by the author; every stated meeting, individual event and numerical operational dataset is explicitly synthetic.
- Theory. Goodhart (1975, via Bevan and Hood), Strathern (1997), Campbell (1979) and Holmström and Milgrom (1991) describe mechanisms, not measured rates.
- Observation. Bevan and Hood (2006) and van Thiel and Leeuw (2002) concern public services; their findings are not transferred as outcomes of logistics or hospitality.
- M
e thod. Kaplan and Norton (1992), the IHI's measure families and NIST's control-chart sections are design guidance; the p-chart is calculated under its stated assumptions. - Arithm
e tic. 80, 60, 10 and 30 per 1,000; UCL ≈ 2.65% and LCL ≈ 0.35% for p₀ = 0.015 and n = 1,000; 94/110 = 85.5% and 100/120 = 83.3%: all re-checked.
The Honest KPI Card and the four-week cycle are editorial proposals for local testing, not certified interventions. Editorial standard: a theory, an observation, a model and a proposal are named as such, and the sentence stops claiming where the evidence stops.
Every source is cited at its DOI or page on the next page; the author's PDF gives the p-chart's lower limit as clipping to zero, which the site corrects to about 0.35%.
Sources: Charles Goodhart, 1975 (via Bevan & Hood (2006), quoting the 1984 reprint); Marilyn Strathern, European Review, 1997; Donald T. Campbell, Evaluation and Program Planning, 1979 (via Dartmouth occasional paper (1976), reprinted in the Journal of MultiDisciplinary Evaluation (2011)); Bengt Holmström & Paul Milgrom, Journal of Law, Economics, & Organization 7 (special issue), 1991; Gwyn Bevan & Christopher Hood, Public Administration, 2006; Sandra van Thiel & Frans L. Leeuw, Public Performance & Management Review 25(3), 2002; Robert S. Kaplan & David P. Norton, Harvard Business Review, 1992; Institute for Healthcare Improvement, 2026; NIST & SEMATECH, NIST/SEMATECH e-Handbook of Statistical Methods: What are Control Charts? (section 6.3.1), 2026; NIST & SEMATECH, NIST/SEMATECH e-Handbook of Statistical Methods: Proportions Control Charts (section 6.3.3.2), 2026
Sources and method
Where the claims come from
The figures in this volume come from the sources below, each with its year. The scenes are constructed; the protocols are proposals; what is research is named as research.
- Donald T. Campbell, Evaluation and Program Planning, “Assessing the impact of planned social change”, 1979 (via Dartmouth occasional paper (1976), reprinted in the Journal of MultiDisciplinary Evaluation (2011)). https://doi.org/10.1016/0149-7189(79)90048-X
- Charles Goodhart, “Problems of Monetary Management: The U.K. Experience”, 1975 (via Bevan & Hood (2006), quoting the 1984 reprint).
- Marilyn Strathern, European Review, “‘Improving ratings’: audit in the British University system”, 1997. https://www.cambridge.org/core/journals/european-review/article/improving-ratings-audit-in-the-british-university-system/FC2EE640C0C44E3DB87C29FB666E9AAB
- Bengt Holmström & Paul Milgrom, Journal of Law, Economics, & Organization 7 (special issue), “Multitask Principal-Agent Analyses: Incentive Contracts, Asset Ownership, and Job Design”, 1991. https://doi.org/10.1093/jleo/7.special_issue.24
- Robert S. Kaplan & David P. Norton, Harvard Business Review, “The Balanced Scorecard: Measures That Drive Performance”, 1992.
- Gwyn Bevan & Christopher Hood, Public Administration, “What’s measured is what matters: targets and gaming in the English public health care system”, 2006. https://doi.org/10.1111/j.1467-9299.2006.00600.x
- Sandra van Thiel & Frans L. Leeuw, Public Performance & Management Review 25(3), “The Performance Paradox in the Public Sector”, 2002. https://doi.org/10.1080/15309576.2002.11643661
- Institute for Healthcare Improvement, “Establishing Measures (Model for Improvement)”, 2026. https://www.ihi.org/library/model-for-improvement/establishing-measures
- NIST & SEMATECH, “NIST/SEMATECH e-Handbook of Statistical Methods: What are Control Charts? (section 6.3.1)”, 2026. https://www.itl.nist.gov/div898/handbook/pmc/section3/pmc31.htm
- NIST & SEMATECH, “NIST/SEMATECH e-Handbook of Statistical Methods: Proportions Control Charts (section 6.3.3.2)”, 2026. https://www.itl.nist.gov/div898/handbook/pmc/section3/pmc332.htm
Edit orial me thod
Each figure was checked for its year, its publisher and what exactly it measures, at the full text where it could be opened. Where the publisher's page could not be opened, the figure was checked against independent summaries and is marked “via”. The editors' interpretation is marked “Our reading”. No figure of the author's own workplaces is claimed.
Operational Treatise · Operational treatise