The US National Safety Council calls a near miss an event that could have caused harm, where only a fortunate break in the chain of events prevented it. Foam broke off the same part of the shuttle's tank on six flights before the one that destroyed Columbia. In experiments by Catherine Tinsley and colleagues, people who heard of a hazard that had left no harm took more risk. James Phimister and colleagues follow a near miss through seven stages. Heinrich's pyramid of 1931 is still everywhere; its data cannot be checked.
Management Review · Second series · November 2026 · No. 63
Near misses: what almost happened
The foam that fell before Columbia's last flight, how the telling of a near miss changes a decision, seven stages from report to fix, what Heinrich's pyramid does and does not show, what to count, and a card for the event that almost happened.
- No.
- 63
- Pages
- 10
- Sources
- 8
- Topics
- KPIs
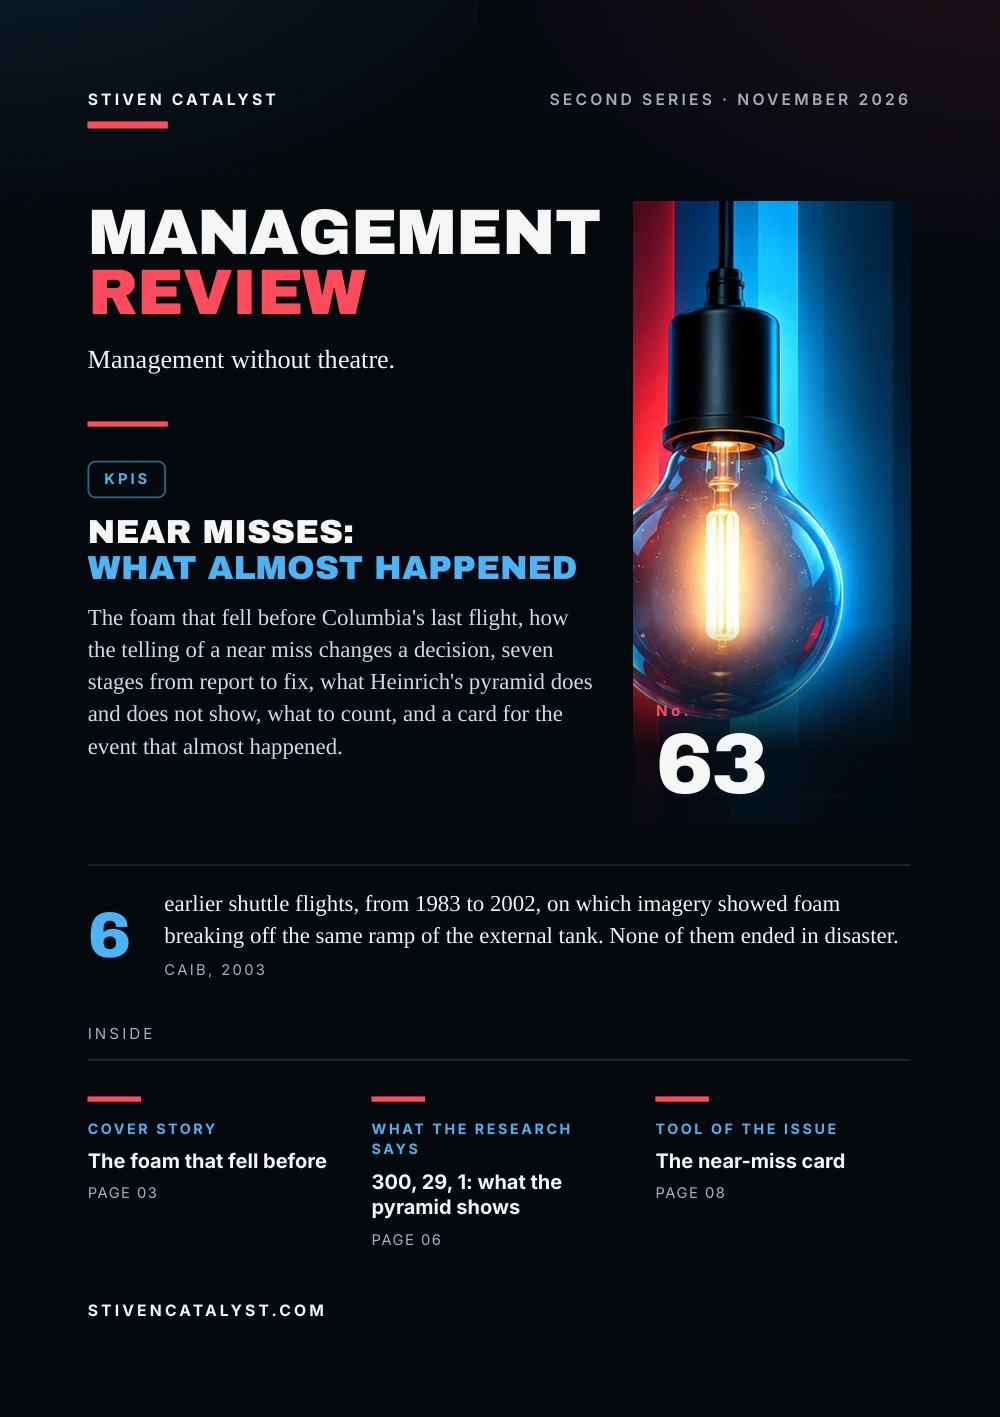
Stiven CatalystSecond series · November 2026
ManagementReview
Management without theatre.
KPIs
Near misses:what almost happened
The foam that fell before Columbia's last flight, how the telling of a near miss changes a decision, seven stages from report to fix, what Heinrich's pyramid does and does not show, what to count, and a card for the event that almost happened.

No.63
6
earlier shuttle flights, from 1983 to 2002, on which imagery showed foam breaking off the same ramp of the external tank. None of them ended in disaster.CAIB, 2003
stivencatalyst.com
No. 63 · KPIs
In this issue
Much of what goes wrong at work almost went wrong first. This issue is about the events that ended well by luck: how to notice them, why they so often reassure instead of warn, and what a team does with them before the luck runs out.
- 03Cover storyThe foam that fell before
- 04The numbersWhen luck reassures
- 05The modelSeven stages, report to fix
- 06What the research says300, 29, 1: what the pyramid shows
- 07How it is measuredCount the closing, not only the reports
- 08Tool of the issueThe near-miss card
- 09SourcesSources and method
How to read this issue
Figure
Every figure has its source and year at the foot of its page.
Our reading
Where the editors interpret rather than the research, it says so.
Practice
The steps and the card are proposals to try, not research results.
Cover story
The foam thatfell before
On 16 January 2003, 81.7 seconds after launch, foam broke off the left bipod ramp of Columbia's external tank and struck the left wing. On 1 February the shuttle broke up on re-entry; all seven crew died. The accident board found that the same ramp had shed foam before.
- 1983First known foam loss from the ramp. Logged as an in-flight anomaly, then closed.
- 1990–94Four more. Only 72 of 113 flights had imagery good enough to tell.
- 2002A large loss on STS-112, logged only as an “action” item.
- 2003The seventh known loss hits Columbia's wing.
Over 22 years, the Board wrote, foam strikes were normalised into a “maintenance” issue. NASA labelled them “in family”: a problem already experienced, analysed and understood.
Our reading
A near miss repeated often enough stops looking like a warning and starts looking like proof that all is well.
Source: Columbia Accident Investigation Board, 2003
Seven cases confirmed by imagery, about 10% of the 72 imaged flights. The Board called the pattern a normalisation of deviance.
The numbers
When luckreassures
Catherine Tinsley, Robin Dillon and Matthew Cronin asked 299 business students whether they would still take a non-refundable cruise that a hurricane had a 30% chance of hitting. Some read that their three earlier cruises had gone without trouble; others also knew someone whose cruise had been hit.
Would still go on the cruise, 2012
How the earlier escape was told mattered more than the reminder. The pattern also held in an evacuation task among 102 emergency managers.
Our reading
The same event, told as “nothing happened” or as “it almost happened”, leads to opposite decisions.
Source: Catherine H. Tinsley, Robin L. Dillon & Matthew A. Cronin, Management Science 58(9), 2012
Students in a scenario, not staff at work. Delays versus injury made no significant difference; the two kinds of near miss did.
The model
Seven stages,repor t t o fix
James Phimister and colleagues built their framework (2003) on more than 100 interviews at 20 chemical and pharmaceutical sites. It follows a near miss through seven stages, so that a site can find its weak links.
The seven stages
- Identification: someone sees that something almost happened
- Disclosure: it is reported
- Prioritisation and distribution: how serious, who takes it
- Causal analysis: why it happened
- Solution identification: what would stop it
- Dissemination: those affected hear of it
- Resolution: the change is made and the case closed
The National Safety Council's 2013 case study adds the conditions: reporting that is non-punitive, anonymous if the reporter wishes, and easy, with each near miss investigated for the weaknesses in the system behind it.
Our reading
Most programmes count stage 2. Near misses are lost at stage 1, when nobody sees them, and at stage 7, when nobody closes them.
Sources: James R. Phimister, Ulku Oktem, Paul R. Kleindorfer & Howard Kunreuther, Risk Analysis 23(3), 2003 (via Abstract at IDEAS/RePEc; stages as cited by Abdul Majid & Shariff (2020) and Zhang et al. (2023), Process Safety Progress); National Safety Council, 2013 (via Listed on OSHA's alliance page; PDF read from a copy)
We saw the article only as an abstract; the stage names follow two later papers that cite it. The reading is the editors'.
More in the essay6S without a poster: order you can see
What the research says
300, 29, 1: whatthe pyramid shows
In 1931 Herbert W. Heinrich estimated that of 330 accidents, 300 cause no injury, 29 a minor one and 1 a major one. Reviewing all four editions in 2011, Fred Manuele found no data behind the ratio that could be examined.
Heinrich's group of 330 accidents, 1931
A “major” injury was any case reported to an insurer. Later tests are mixed. On UK railways, only 3 of 21 types of cause differed between injuries, damage and near misses (Wright & van der Schaaf). In 25,000+ workplaces over 13 years, more minor incidents went with a higher chance of a fatal one, but the triangle's shape depended on how severity was classified (Yorio & Moore).
Our reading
Near misses are worth learning from because they often share causes with accidents. That does not make the ratio a law, or fewer small injuries a promise of fewer deaths.
Sources: H. W. Heinrich, McGraw-Hill, 1931 (via Quoted by Manuele, Professional Safety, 2011); Fred A. Manuele, Professional Safety 56(10), 2011; Linda Wright & Tjerk van der Schaaf, Journal of Hazardous Materials 111(1-3), 2004 (via Abstract at PubMed); Patrick L. Yorio & Susan M. Moore, Risk Analysis 38(4), 2018 (via Abstract at CDC Stacks and IDEAS/RePEc)
Heinrich is quoted from Manuele; we did not see the book. Manuele also cites US claims data: small claims fell faster than large ones.
How it is measured
Count the closing,not only the repor ts
The NSC treats near-miss reporting as a leading indicator, to be used alongside other measures and reported back to the organisation. It warns against rewarding managers for low recordable injury rates: that kind of incentive has been shown to suppress reporting.
Reports per month
Expect the count to rise first: more reports can mean more trust, not more danger.
Share closed
Reports with an agreed change carried out, out of all reports.
Days to feedback
From the report to the reporter hearing what happens next.
Repeats
The same near miss again after its case was closed.
Hypothetical example, one month in a parcel depot
- Reports
- 18, up from 12
- Changes
- 10 agreed, 6 carried out
- Feedback
- 5 of 18 reporters heard back within 7 days
The rising count is good news; the gap is in telling people what their report changed. The numbers are invented.
Sources: National Safety Council, 2013 (via Listed on OSHA's alliance page; PDF read from a copy); James R. Phimister, Ulku Oktem, Paul R. Kleindorfer & Howard Kunreuther, Risk Analysis 23(3), 2003 (via Abstract at IDEAS/RePEc; stages as cited by Abdul Majid & Shariff (2020) and Zhang et al. (2023), Process Safety Progress)
The four measures and the example are the editors', after the NSC case study and the stages of Phimister et al.
Tool of the issue
The near-misscard
One card per event, filled in the same day. Write it as something that almost happened, not as something that did not; describe the conditions, not the person.
01What happenedwhere, when, what you saw; no names
02What could have happenedthe worst realistic outcome, and what stopped it
03Whythe conditions behind it; ask why more than once
04What changesone change that removes the condition, not a reminder to be careful
05Who follows up, by whenone owner and a date
06Told backwhen the person who reported heard what changed
Sources: National Safety Council, 2013 (via Listed on OSHA's alliance page; PDF read from a copy); James R. Phimister, Ulku Oktem, Paul R. Kleindorfer & Howard Kunreuther, Risk Analysis 23(3), 2003 (via Abstract at IDEAS/RePEc; stages as cited by Abdul Majid & Shariff (2020) and Zhang et al. (2023), Process Safety Progress); Catherine H. Tinsley, Robin L. Dillon & Matthew A. Cronin, Management Science 58(9), 2012
A practice proposed by the editors, after the NSC case study, the seven stages of Phimister et al. and the near misses told as “almost happened” in Tinsley et al.
Open the tool: 5 Whysstivencatalyst.com/tools/five-whys/
Sources and method
Every figurehas a source.
The figures in this issue come from the sources below. The year shows how recent each one is.
- Columbia Accident Investigation Board Report, Volume IColumbia Accident Investigation Board, 2003https://s3.amazonaws.com/akamai.netstorage/anon.nasa-global/CAIB/CAIB_lowres_full.pdf
- How Near-Miss Events Amplify or Attenuate Risky Decision MakingCatherine H. Tinsley, Robin L. Dillon & Matthew A. Cronin, Management Science 58(9), 2012https://doi.org/10.1287/mnsc.1120.1517
- Near-Miss Incident Management in the Chemical Process IndustryJames R. Phimister, Ulku Oktem, Paul R. Kleindorfer & Howard Kunreuther, Risk Analysis 23(3), 2003 · via Abstract at IDEAS/RePEc; stages as cited by Abdul Majid & Shariff (2020) and Zhang et al. (2023), Process Safety Progresshttps://doi.org/10.1111/1539-6924.00326
- Near Miss Reporting Systems (case study, OSHA and NSC Alliance)National Safety Council, 2013 · via Listed on OSHA's alliance page; PDF read from a copyhttps://www.osha.gov/alliances/nsc/nsc
- Industrial Accident Prevention: A Scientific ApproachH. W. Heinrich, McGraw-Hill, 1931 · via Quoted by Manuele, Professional Safety, 2011
- Reviewing Heinrich: Dislodging Two Myths From the Practice of SafetyFred A. Manuele, Professional Safety 56(10), 2011https://aeasseincludes.assp.org/professionalsafety/pastissues/056/10/052_061_F2Manuele_1011Z.pdf
- Accident versus near miss causation: a critical review of the literature, an empirical test in the UK railway domain, and their implications for other sectorsLinda Wright & Tjerk van der Schaaf, Journal of Hazardous Materials 111(1-3), 2004 · via Abstract at PubMedhttps://doi.org/10.1016/j.jhazmat.2004.02.049
- Examining Factors that Influence the Existence of Heinrich's Safety Triangle Using Site-Specific H&S Data from More than 25,000 EstablishmentsPatrick L. Yorio & Susan M. Moore, Risk Analysis 38(4), 2018 · via Abstract at CDC Stacks and IDEAS/RePEchttps://doi.org/10.1111/risa.12869
Editorial method
Each figure was checked for its year, its publisher and what exactly it measures. Where the publisher's page could not be opened, the figure was checked against independent summaries and is marked “via”. The editors' interpretation is marked “Our reading”. Figures that could not be confirmed are not in the issue.
ManagementReview
Management without theatre.
Every issue, one management question, checked against the best research.
All issues
stivencatalyst.com/magazine/management-review.html
Management Review · No. 63 · November 2026 · Stiven Catalyst
Click or swipe a page to turn it. The arrow keys work too.
Management Review · No. 63
The figures of the issue
The charts of the printed pages, with their sources.
Source: Catherine H. Tinsley, Robin L. Dillon & Matthew A. Cronin, Management Science 58(9), 2012
Sources: H. W. Heinrich, McGraw-Hill, 1931 (via Quoted by Manuele, Professional Safety, 2011); Fred A. Manuele, Professional Safety 56(10), 2011
The whole text Read the issue as text For reading on a small screen, searching or a screen reader. The same words, without the page design.
In this issue
Much of what goes wrong at work almost went wrong first. This issue is about the events that ended well by luck: how to notice them, why they so often reassure instead of warn, and what a team does with them before the luck runs out.
The US National Safety Council calls a near miss an event that could have caused harm, where only a fortunate break in the chain of events prevented it. Foam broke off the same part of the shuttle's tank on six flights before the one that destroyed Columbia. In experiments by Catherine Tinsley and colleagues, people who heard of a hazard that had left no harm took more risk. James Phimister and colleagues follow a near miss through seven stages. Heinrich's pyramid of 1931 is still everywhere; its data cannot be checked.
Stiven Janaqi, Editor
Cover story
The foam that fell before
On 16 January 2003, 81.7 seconds after launch, foam broke off the left bipod ramp of Columbia's external tank and struck the left wing. On 1 February the shuttle broke up on re-entry; all seven crew died. The accident board found that the same ramp had shed foam before.
- 1983 First known foam loss from the ramp. Logged as an in-flight anomaly, then closed.
- 1990–94 Four more. Only 72 of 113 flights had imagery good enough to tell.
- 2002 A large loss on STS-112, logged only as an “action” item.
- 2003 The seventh known loss hits Columbia's wing.
Over 22 years, the Board wrote, foam strikes were normalised into a “maintenance” issue. NASA labelled them “in family”: a problem already experienced, analysed and understood.
Our reading
A near miss repeated often enough stops looking like a warning and starts looking like proof that all is well.
Seven cases confirmed by imagery, about 10% of the 72 imaged flights. The Board called the pattern a normalisation of deviance.
Source: Columbia Accident Investigation Board, 2003
The numbers
When luck reassures
Catherine Tinsley, Robin Dillon and Matthew Cronin asked 299 business students whether they would still take a non-refundable cruise that a hurricane had a 30% chance of hitting. Some read that their three earlier cruises had gone without trouble; others also knew someone whose cruise had been hit.
Would still go on the cruise, 2012: No trouble before, reminded of delays 58.5%, No trouble before, reminded of injury 50.8%, Knew someone hit, reminded of delays 39.0%, Knew someone hit, reminded of injury 32.8%.
How the earlier escape was told mattered more than the reminder. The pattern also held in an evacuation task among 102 emergency managers.
Our reading
The same event, told as “nothing happened” or as “it almost happened”, leads to opposite decisions.
Students in a scenario, not staff at work. Delays versus injury made no significant difference; the two kinds of near miss did.
Source: Catherine H. Tinsley, Robin L. Dillon & Matthew A. Cronin, Management Science 58(9), 2012
The model
Seven stages, repor t t o fix
James Phimister and colleagues built their framework (2003) on more than 100 interviews at 20 chemical and pharmaceutical sites. It follows a near miss through seven stages, so that a site can find its weak links.
The seven stages
- Identification: someone sees that something almost happened
- Disclosure: it is reported
- Prioritisation and distribution: how serious, who takes it
- Causal analysis: why it happened
- Solution identification: what would stop it
- Dissemination: those affected hear of it
- Resolution: the change is made and the case closed
The National Safety Council's 2013 case study adds the conditions: reporting that is non-punitive, anonymous if the reporter wishes, and easy, with each near miss investigated for the weaknesses in the system behind it.
Our reading
Most programmes count stage 2. Near misses are lost at stage 1, when nobody sees them, and at stage 7, when nobody closes them.
We saw the article only as an abstract; the stage names follow two later papers that cite it. The reading is the editors'.
Sources: James R. Phimister, Ulku Oktem, Paul R. Kleindorfer & Howard Kunreuther, Risk Analysis 23(3), 2003 (via Abstract at IDEAS/RePEc; stages as cited by Abdul Majid & Shariff (2020) and Zhang et al. (2023), Process Safety Progress); National Safety Council, 2013 (via Listed on OSHA's alliance page; PDF read from a copy)
More in the essay: 6S without a poster: order you can see
What the research says
300, 29, 1: what the pyramid shows
In 1931 Herbert W. Heinrich estimated that of 330 accidents, 300 cause no injury, 29 a minor one and 1 a major one. Reviewing all four editions in 2011, Fred Manuele found no data behind the ratio that could be examined.
Heinrich's group of 330 accidents, 1931: No injury 300, Minor 29, Major 1.
A “major” injury was any case reported to an insurer. Later tests are mixed. On UK railways, only 3 of 21 types of cause differed between injuries, damage and near misses (Wright & van der Schaaf). In 25,000+ workplaces over 13 years, more minor incidents went with a higher chance of a fatal one, but the triangle's shape depended on how severity was classified (Yorio & Moore).
Our reading
Near misses are worth learning from because they often share causes with accidents. That does not make the ratio a law, or fewer small injuries a promise of fewer deaths.
Heinrich is quoted from Manuele; we did not see the book. Manuele also cites US claims data: small claims fell faster than large ones.
Sources: H. W. Heinrich, McGraw-Hill, 1931 (via Quoted by Manuele, Professional Safety, 2011); Fred A. Manuele, Professional Safety 56(10), 2011; Linda Wright & Tjerk van der Schaaf, Journal of Hazardous Materials 111(1-3), 2004 (via Abstract at PubMed); Patrick L. Yorio & Susan M. Moore, Risk Analysis 38(4), 2018 (via Abstract at CDC Stacks and IDEAS/RePEc)
How it is measured
Count the closing, not only the repor ts
The NSC treats near-miss reporting as a leading indicator, to be used alongside other measures and reported back to the organisation. It warns against rewarding managers for low recordable injury rates: that kind of incentive has been shown to suppress reporting.
- Repo
r ts per month. Expect the count to rise first: more reports can mean more trust, not more danger. - Share closed. Reports with an agreed change carried out, out of all reports.
- Days
t o feedback. From the report to the reporter hearing what happens next. - Repeats. The same near miss again after its case was closed.
Hypothe tical example, one month in a parcel depot
- Repo
r ts: 18, up from 12 - Changes: 10 agreed, 6 carried out
- Feedback: 5 of 18 reporters heard back within 7 days
The rising count is good news; the gap is in telling people what their report changed. The numbers are invented.
The four measures and the example are the editors', after the NSC case study and the stages of Phimister et al.
Sources: National Safety Council, 2013 (via Listed on OSHA's alliance page; PDF read from a copy); James R. Phimister, Ulku Oktem, Paul R. Kleindorfer & Howard Kunreuther, Risk Analysis 23(3), 2003 (via Abstract at IDEAS/RePEc; stages as cited by Abdul Majid & Shariff (2020) and Zhang et al. (2023), Process Safety Progress)
Tool of the issue
The near-miss card
One card per event, filled in the same day. Write it as something that almost happened, not as something that did not; describe the conditions, not the person.
- What happened where, when, what you saw; no names
- What could have happened the worst realistic outcome, and what stopped it
- Why the conditions behind it; ask why more than once
- What changes one change that removes the condition, not a reminder to be careful
- Who follows up, by when one owner and a date
T old back when the person who reported heard what changed
A practice proposed by the editors, after the NSC case study, the seven stages of Phimister et al. and the near misses told as “almost happened” in Tinsley et al.
Sources: National Safety Council, 2013 (via Listed on OSHA's alliance page; PDF read from a copy); James R. Phimister, Ulku Oktem, Paul R. Kleindorfer & Howard Kunreuther, Risk Analysis 23(3), 2003 (via Abstract at IDEAS/RePEc; stages as cited by Abdul Majid & Shariff (2020) and Zhang et al. (2023), Process Safety Progress); Catherine H. Tinsley, Robin L. Dillon & Matthew A. Cronin, Management Science 58(9), 2012
Open the tool: 5 Whys
Sources and method
Every figure has a source.
The figures in this issue come from the sources below. The year shows how recent each one is.
- Columbia Accident Investigation Board, “Columbia Accident Investigation Board Report, Volume I”, 2003. https://s3.amazonaws.com/akamai.netstorage/anon.nasa-global/CAIB/CAIB_lowres_full.pdf
- Catherine H. Tinsley, Robin L. Dillon & Matthew A. Cronin, Management Science 58(9), “How Near-Miss Events Amplify or Attenuate Risky Decision Making”, 2012. https://doi.org/10.1287/mnsc.1120.1517
- James R. Phimister, Ulku Oktem, Paul R. Kleindorfer & Howard Kunreuther, Risk Analysis 23(3), “Near-Miss Incident Management in the Chemical Process Industry”, 2003 (via Abstract at IDEAS/RePEc; stages as cited by Abdul Majid & Shariff (2020) and Zhang et al. (2023), Process Safety Progress). https://doi.org/10.1111/1539-6924.00326
- National Safety Council, “Near Miss Reporting Systems (case study, OSHA and NSC Alliance)”, 2013 (via Listed on OSHA's alliance page; PDF read from a copy). https://www.osha.gov/alliances/nsc/nsc
- H. W. Heinrich, McGraw-Hill, “Industrial Accident Prevention: A Scientific Approach”, 1931 (via Quoted by Manuele, Professional Safety, 2011).
- Fred A. Manuele, Professional Safety 56(10), “Reviewing Heinrich: Dislodging Two Myths From the Practice of Safety”, 2011. https://aeasseincludes.assp.org/professionalsafety/pastissues/056/10/052_061_F2Manuele_1011Z.pdf
- Linda Wright & Tjerk van der Schaaf, Journal of Hazardous Materials 111(1-3), “Accident versus near miss causation: a critical review of the literature, an empirical test in the UK railway domain, and their implications for other sectors”, 2004 (via Abstract at PubMed). https://doi.org/10.1016/j.jhazmat.2004.02.049
- Patrick L. Yorio & Susan M. Moore, Risk Analysis 38(4), “Examining Factors that Influence the Existence of Heinrich's Safety Triangle Using Site-Specific H&S Data from More than 25,000 Establishments”, 2018 (via Abstract at CDC Stacks and IDEAS/RePEc). https://doi.org/10.1111/risa.12869
Edit orial me thod
Each figure was checked for its year, its publisher and what exactly it measures. Where the publisher's page could not be opened, the figure was checked against independent summaries and is marked “via”. The editors' interpretation is marked “Our reading”. Figures that could not be confirmed are not in the issue.
Management Review · Monthly edition