Pierre Wack, who headed Shell's business environment division from 1971, found that good scenarios were not enough: they had to change how managers saw the world. In Bain's surveys, the tool's use rose to 70% in 2002 and fell to 19% by 2017. Paul Schoemaker shows how to cross two uncertainties into four worlds. In field studies by MIT researchers, experts changed most of their judgments but not their confidence, and leaned more towards flexible options. A longitudinal study links preparing for the future with better results.
Management Review · Second series · November 2026 · No. 64
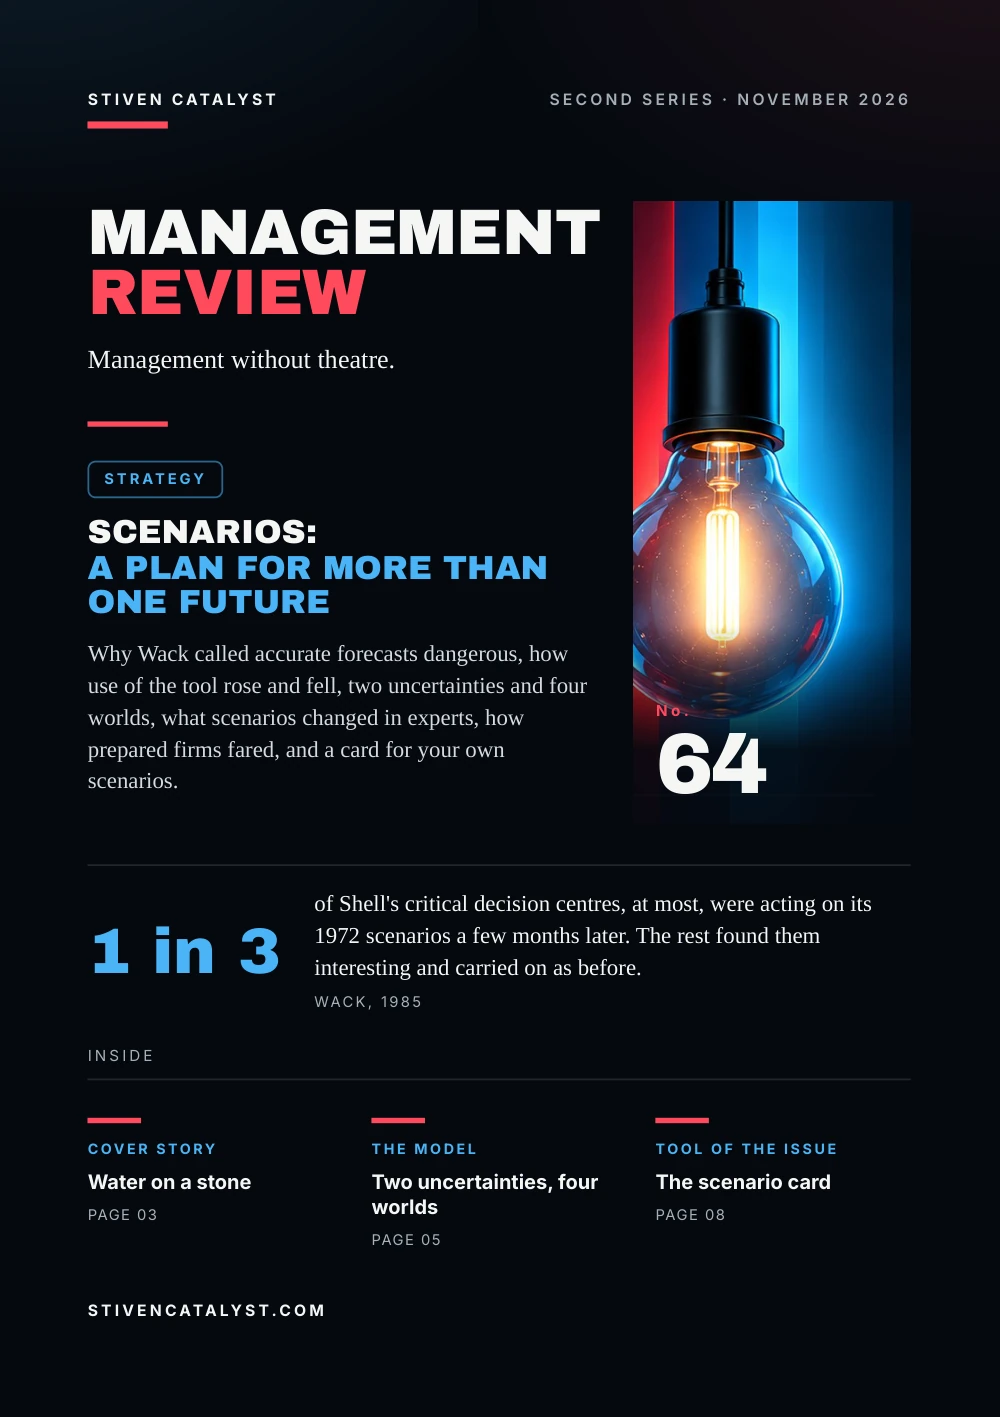
Scenarios: a plan for more than one future
Why Wack called accurate forecasts dangerous, how use of the tool rose and fell, two uncertainties and four worlds, what scenarios changed in experts, how prepared firms fared, and a card for your own scenarios.
- No.
- 64
- Pages
- 10
- Sources
- 8
- Topics
- Strategy
Stiven CatalystSecond series · November 2026
ManagementReview
Management without theatre.
Strategy
Scenarios:a plan for more than one future
Why Wack called accurate forecasts dangerous, how use of the tool rose and fell, two uncertainties and four worlds, what scenarios changed in experts, how prepared firms fared, and a card for your own scenarios.

No.64
1 in 3
of Shell's critical decision centres, at most, were acting on its 1972 scenarios a few months later. The rest found them interesting and carried on as before.Wack, 1985
stivencatalyst.com
No. 64 · Strategy
In this issue
Most plans rest on one forecast, and most of the time that is enough. This issue is about the times it is not: how to plan for several futures at once, without pretending to know which one will come.
- 03Cover storyWater on a stone
- 04The numbersIn fashion after the shock
- 05The modelTwo uncertainties, four worlds
- 06What the research saysNot more sure, more flexible
- 07How it is measuredPrepared or not
- 08Tool of the issueThe scenario card
- 09SourcesSources and method
How to read this issue
Figure
Every figure has its source and year at the foot of its page.
Our reading
Where the editors interpret rather than the research, it says so.
Practice
The steps and the card are proposals to try, not research results.
Cover story
Wateron a st one
Pierre Wack headed the business environment division of Shell's planning department from 1971 to 1981. In 1985 he opened his account in Harvard Business Review with a warning about forecasts:
“Forecasts are not always wrong; more often than not, they can be reasonably accurate. And that is what makes them so dangerous.”
They fail, he wrote, when they are needed most: when the environment shifts. Shell's first scenarios only combined obvious uncertainties and gave managers nothing to act on. Those of 1972 caught top management's attention, yet months later no more than a third of the critical decision centres were acting on them. Without changing the picture of reality in managers' heads, scenarios were like water on a stone.
01
First generation
the obvious uncertainties, quantified: good for questions, not for decisions
02
Predetermined
events that have happened, whose consequences have not yet unfolded
03
Microcosm
the decision maker's mental model, the real target of a scenario
Our reading
A scenario that nobody acts on is a report. Its test is whether someone decides differently.
Source: Pierre Wack, Harvard Business Review 63(5), 1985
All of this is Wack's own account. Of 1973 the article says only that Shell was prepared for the eventuality, if not the timing, of the oil crisis.
More in the essayHigh-volume days: the standard under pressure
The numbers
In fashionaf ter the shock
Since 1993 Bain & Company has asked executives around the world which management tools they used in the past year. Scenario and contingency planning counts as one tool. The share of respondents who used it:
Executives using scenario and contingency planning, Bain surveys
Bain links the rise after 2001 to the attacks of 11 September; in 2007 Darrell Rigby added Hurricane Katrina. In 2017 managers named it one of the two tools whose use would grow most. They had said the same in 2014, Bain notes, and neither tool then made the top ten.
Our reading
A tool picked up after a shock and put away in calm years is being used as insurance, not as a way of thinking.
Sources: Darrell Rigby, Bain & Company (first published on Forbes.com), 2007; Darrell Rigby & Barbara Bilodeau, Bain & Company, 2007; Darrell Rigby & Barbara Bilodeau, Bain & Company, 2018; Paul J.H. Schoemaker, Sloan Management Review 36(2), 1995
Self-reports, with a different sample each time (1,268 managers in 2017). The tool joins scenarios with contingency plans, which Schoemaker keeps apart: a contingency plan looks at one uncertainty, scenarios at several together.
The model
Two uncer tainties,four worlds
Paul Schoemaker of the Wharton School sets out ten steps, from the scope to the trends and uncertainties to decision scenarios. One shortcut: cross the two most important uncertainties. Anglo American did so in South Africa in 1984:
US and USSRUS and Japan
Imperial Twilight
Unrest in the Middle East and the spread of AIDS fitted this world better than the others.
arms race · trade accommodationDropped
Judged implausible: the US would not take on both at once.
arms race · trade conflictIndustrial Renaissance
A name captures the essence of a world and makes the story easy to remember.
détente · trade accommodationProtracted Transition
For each world, Anglo estimated growth and which countries would succeed.
détente · trade conflictSchoemaker's four tests of a scenario set
- relevant: it connects with the users' mental maps and concerns
- internally consistent, and seen to be so
- archetypal: generically different futures, not variations on one theme
- each a state that can last for some time, not a passing moment
Source: Paul J.H. Schoemaker, Sloan Management Review 36(2), 1995
The steps, the tests and the Anglo American case are as Schoemaker reports them (1995); the short notes in the cells are the editors' summary.
What the research says
Not more sure,more flexible
Shardul Phadnis and colleagues at MIT tested scenarios with field experts, from carrier owners to state planners, judging real US transport investments 30 years ahead. In one workshop, 27 experts chose how flexibly to invest:
Share of 351 recommendations, by option
In another workshop, 71.3% of judgments changed after one scenario, yet after all of them average confidence was the same (0.811 and 0.814). Earlier tests used students: Schoemaker's 68 MBA students widened their ranges by about half; Meissner and Wulf found less framing bias among 252.
Our reading
Scenarios made the experts neither surer nor less sure. They kept more doors open.
Sources: Shardul Phadnis, Chris Caplice, Yossi Sheffi & Mahender Singh, Strategic Management Journal 36(9), 2015; Paul J.H. Schoemaker, Sloan Management Review 36(2), 1995; Philip Meissner & Torsten Wulf, Technological Forecasting and Social Change 80(4), 2013 (via Abstract at IDEAS/RePEc; Phadnis et al., 2015)
No control group: the workshop was the treatment. The shifts were significant except for the most flexible option (p = 0.056).
How it is measured
Preparedor not
René Rohrbeck and Menes Etingue Kum measured in 2008 how prepared 83 large European firms were for the future: how much foresight their environment called for, against how mature their practices were. In 2015 they looked at the results.
83 European firms, 2008
The vigilant firms averaged 16% profitability, against 12% for their industries. Their market value grew by 75% from 2008 to 2015, against 25% for the sample; the firms with more practice than they needed shrank by 6%.
Hypothetical example, a parcel depot, one year ahead
- World
- “Busy and short-handed”: volume up, drivers hard to find
- Signal
- applicants per opening, checked every month
- Trigger
- below 2 for two months: start training reserves
The case and the numbers are invented.
Sources: René Rohrbeck & Menes Etingue Kum, Technological Forecasting and Social Change 129, 2018; Paul J.H. Schoemaker, Sloan Management Review 36(2), 1995
Profitability for 70 firms, market value for 42 listed ones; foresight is wider than scenarios. A signal per scenario follows Schoemaker.
Tool of the issue
The scenariocard
One decision, one horizon. Write down what is already certain before what is not, give each world a name, and decide now which signal will tell you that it is coming.
01Decision and horizonwhat we must decide, and how far ahead we look
02What is already certaintrends everyone in the room accepts; the rest goes below
03Two uncertaintiesthe two that matter most, each with two plausible outcomes
04Four worldsa name for each; strike one out only if it cannot happen
05Movesuseful in every world and wasteful in none; then those for one world only
06Signals and reviewone early sign per world, who watches it, the date we look again
Sources: Pierre Wack, Harvard Business Review 63(5), 1985; Paul J.H. Schoemaker, Sloan Management Review 36(2), 1995; Shardul Phadnis, Chris Caplice, Yossi Sheffi & Mahender Singh, Strategic Management Journal 36(9), 2015
A practice proposed by the editors, after Wack's predetermined elements, Schoemaker's two uncertainties and early indicators, and the robust investments of Phadnis et al. The control chart helps tell a real signal from noise.
Open the tool: Sigma & Control Chartstivencatalyst.com/tools/sigma-control-chart/
Sources and method
Every figurehas a source.
The figures in this issue come from the sources below. The year shows how recent each one is.
- Scenarios: Uncharted Waters AheadPierre Wack, Harvard Business Review 63(5), 1985https://hbr.org/1985/09/scenarios-uncharted-waters-ahead
- The next best thing to a crystal ballDarrell Rigby, Bain & Company (first published on Forbes.com), 2007https://www.bain.com/insights/the-next-best-thing-to-a-crystal-ball/
- Management Tools and Trends 2007Darrell Rigby & Barbara Bilodeau, Bain & Company, 2007https://www.bain.cn/pdfs/200906150356217586.pdf
- Management Tools & Trends (survey of 1,268 managers, fall 2017)Darrell Rigby & Barbara Bilodeau, Bain & Company, 2018https://www.bain.com/insights/management-tools-and-trends-2017/
- Scenario Planning: A Tool for Strategic ThinkingPaul J.H. Schoemaker, Sloan Management Review 36(2), 1995https://sloanreview.mit.edu/article/scenario-planning-a-tool-for-strategic-thinking/
- Effect of scenario planning on field experts' judgment of long-range investment decisionsShardul Phadnis, Chris Caplice, Yossi Sheffi & Mahender Singh, Strategic Management Journal 36(9), 2015https://doi.org/10.1002/smj.2293
- Cognitive benefits of scenario planning: Its impact on biases and decision qualityPhilip Meissner & Torsten Wulf, Technological Forecasting and Social Change 80(4), 2013 · via Abstract at IDEAS/RePEc; Phadnis et al., 2015https://doi.org/10.1016/j.techfore.2012.09.011
- Corporate foresight and its impact on firm performance: A longitudinal analysisRené Rohrbeck & Menes Etingue Kum, Technological Forecasting and Social Change 129, 2018https://doi.org/10.1016/j.techfore.2017.12.013
Editorial method
Each figure was checked for its year, its publisher and what exactly it measures. Where the publisher's page could not be opened, the figure was checked against independent summaries and is marked “via”. The editors' interpretation is marked “Our reading”. Figures that could not be confirmed are not in the issue.
ManagementReview
Management without theatre.
Every issue, one management question, checked against the best research.
All issues
stivencatalyst.com/magazine/management-review.html
Management Review · No. 64 · November 2026 · Stiven Catalyst
Click or swipe a page to turn it. The arrow keys work too.
Management Review · No. 64
The figures of the issue
The charts of the printed pages, with their sources.
Sources: Darrell Rigby, Bain & Company (first published on Forbes.com), 2007; Darrell Rigby & Barbara Bilodeau, Bain & Company, 2007; Darrell Rigby & Barbara Bilodeau, Bain & Company, 2018
Source: Shardul Phadnis, Chris Caplice, Yossi Sheffi & Mahender Singh, Strategic Management Journal 36(9), 2015
Source: René Rohrbeck & Menes Etingue Kum, Technological Forecasting and Social Change 129, 2018
The whole text Read the issue as text For reading on a small screen, searching or a screen reader. The same words, without the page design.
In this issue
Most plans rest on one forecast, and most of the time that is enough. This issue is about the times it is not: how to plan for several futures at once, without pretending to know which one will come.
Pierre Wack, who headed Shell's business environment division from 1971, found that good scenarios were not enough: they had to change how managers saw the world. In Bain's surveys, the tool's use rose to 70% in 2002 and fell to 19% by 2017. Paul Schoemaker shows how to cross two uncertainties into four worlds. In field studies by MIT researchers, experts changed most of their judgments but not their confidence, and leaned more towards flexible options. A longitudinal study links preparing for the future with better results.
Stiven Janaqi, Editor
Cover story
Water on a st one
Pierre Wack headed the business environment division of Shell's planning department from 1971 to 1981. In 1985 he opened his account in Harvard Business Review with a warning about forecasts:
Forecasts are not always wrong; more often than not, they can be reasonably accurate. And that is what makes them so dangerous.
They fail, he wrote, when they are needed most: when the environment shifts. Shell's first scenarios only combined obvious uncertainties and gave managers nothing to act on. Those of 1972 caught top management's attention, yet months later no more than a third of the critical decision centres were acting on them. Without changing the picture of reality in managers' heads, scenarios were like water on a stone.
- First generation. the obvious uncertainties, quantified: good for questions, not for decisions
- Pred
e termined. events that have happened, whose consequences have not yet unfolded - Microcosm. the decision maker's mental model, the real target of a scenario
Our reading
A scenario that nobody acts on is a report. Its test is whether someone decides differently.
All of this is Wack's own account. Of 1973 the article says only that Shell was prepared for the eventuality, if not the timing, of the oil crisis.
Source: Pierre Wack, Harvard Business Review 63(5), 1985
More in the essay: High-volume days: the standard under pressure
The numbers
In fashion af ter the shock
Since 1993 Bain & Company has asked executives around the world which management tools they used in the past year. Scenario and contingency planning counts as one tool. The share of respondents who used it:
Executives using scenario and contingency planning, Bain surveys: 1993 38%, 2002 70%, 2006 69%, 2017 19%.
Bain links the rise after 2001 to the attacks of 11 September; in 2007 Darrell Rigby added Hurricane Katrina. In 2017 managers named it one of the two tools whose use would grow most. They had said the same in 2014, Bain notes, and neither tool then made the top ten.
Our reading
A tool picked up after a shock and put away in calm years is being used as insurance, not as a way of thinking.
Self-reports, with a different sample each time (1,268 managers in 2017). The tool joins scenarios with contingency plans, which Schoemaker keeps apart: a contingency plan looks at one uncertainty, scenarios at several together.
Sources: Darrell Rigby, Bain & Company (first published on Forbes.com), 2007; Darrell Rigby & Barbara Bilodeau, Bain & Company, 2007; Darrell Rigby & Barbara Bilodeau, Bain & Company, 2018; Paul J.H. Schoemaker, Sloan Management Review 36(2), 1995
The model
Two uncer tainties, four worlds
Paul Schoemaker of the Wharton School sets out ten steps, from the scope to the trends and uncertainties to decision scenarios. One shortcut: cross the two most important uncertainties. Anglo American did so in South Africa in 1984:
US and USSR × US and Japan:
- Imperial Twilight (arms race · trade accommodation). Unrest in the Middle East and the spread of AIDS fitted this world better than the others.
- Dropped (arms race · trade conflict). Judged implausible: the US would not take on both at once.
- Industrial Renaissance (détente · trade accommodation). A name captures the essence of a world and makes the story easy to remember.
- Protracted Transition (détente · trade conflict). For each world, Anglo estimated growth and which countries would succeed.
Schoemaker's four tests of a scenario se t
- relevant: it connects with the users' mental maps and concerns
- internally consistent, and seen to be so
- archetypal: generically different futures, not variations on one theme
- each a state that can last for some time, not a passing moment
The steps, the tests and the Anglo American case are as Schoemaker reports them (1995); the short notes in the cells are the editors' summary.
Source: Paul J.H. Schoemaker, Sloan Management Review 36(2), 1995
What the research says
Not more sure, more flexible
Shardul Phadnis and colleagues at MIT tested scenarios with field experts, from carrier owners to state planners, judging real US transport investments 30 years ahead. In one workshop, 27 experts chose how flexibly to invest:
Share of 351 recommendations, by option: Specific projects (least flexible): Before 65.2%, After the scenarios 50.1%; Option 3: Before 12.3%, After the scenarios 23.1%; Funds only (most flexible): Before 7.4%, After the scenarios 11.4%.
In another workshop, 71.3% of judgments changed after one scenario, yet after all of them average confidence was the same (0.811 and 0.814). Earlier tests used students: Schoemaker's 68 MBA students widened their ranges by about half; Meissner and Wulf found less framing bias among 252.
Our reading
Scenarios made the experts neither surer nor less sure. They kept more doors open.
No control group: the workshop was the treatment. The shifts were significant except for the most flexible option (p = 0.056).
Sources: Shardul Phadnis, Chris Caplice, Yossi Sheffi & Mahender Singh, Strategic Management Journal 36(9), 2015; Paul J.H. Schoemaker, Sloan Management Review 36(2), 1995; Philip Meissner & Torsten Wulf, Technological Forecasting and Social Change 80(4), 2013 (via Abstract at IDEAS/RePEc; Phadnis et al., 2015)
How it is measured
Prepared or not
René Rohrbeck and Menes Etingue Kum measured in 2008 how prepared 83 large European firms were for the future: how much foresight their environment called for, against how mature their practices were. In 2015 they looked at the results.
83 European firms, 2008: Vigilant: practice matches need 36%, More practice than needed 16%, Vulnerable or in danger: too little 48%.
The vigilant firms averaged 16% profitability, against 12% for their industries. Their market value grew by 75% from 2008 to 2015, against 25% for the sample; the firms with more practice than they needed shrank by 6%.
Hypothe tical example, a parcel depot, one year ahead
- World: “Busy and short-handed”: volume up, drivers hard to find
- Signal: applicants per opening, checked every month
- Trigger: below 2 for two months: start training reserves
The case and the numbers are invented.
Profitability for 70 firms, market value for 42 listed ones; foresight is wider than scenarios. A signal per scenario follows Schoemaker.
Sources: René Rohrbeck & Menes Etingue Kum, Technological Forecasting and Social Change 129, 2018; Paul J.H. Schoemaker, Sloan Management Review 36(2), 1995
Tool of the issue
The scenario card
One decision, one horizon. Write down what is already certain before what is not, give each world a name, and decide now which signal will tell you that it is coming.
- Decision and horizon what we must decide, and how far ahead we look
- What is already ce
r tain trends everyone in the room accepts; the rest goes below - Two unce
r tainties the two that matter most, each with two plausible outcomes - Four worlds a name for each; strike one out only if it cannot happen
- Moves useful in every world and wasteful in none; then those for one world only
- Signals and review one early sign per world, who watches it, the date we look again
A practice proposed by the editors, after Wack's predetermined elements, Schoemaker's two uncertainties and early indicators, and the robust investments of Phadnis et al. The control chart helps tell a real signal from noise.
Sources: Pierre Wack, Harvard Business Review 63(5), 1985; Paul J.H. Schoemaker, Sloan Management Review 36(2), 1995; Shardul Phadnis, Chris Caplice, Yossi Sheffi & Mahender Singh, Strategic Management Journal 36(9), 2015
Open the tool: Sigma & Control Chart
Sources and method
Every figure has a source.
The figures in this issue come from the sources below. The year shows how recent each one is.
- Pierre Wack, Harvard Business Review 63(5), “Scenarios: Uncharted Waters Ahead”, 1985. https://hbr.org/1985/09/scenarios-uncharted-waters-ahead
- Darrell Rigby, Bain & Company (first published on Forbes.com), “The next best thing to a crystal ball”, 2007. https://www.bain.com/insights/the-next-best-thing-to-a-crystal-ball/
- Darrell Rigby & Barbara Bilodeau, Bain & Company, “Management Tools and Trends 2007”, 2007. https://www.bain.cn/pdfs/200906150356217586.pdf
- Darrell Rigby & Barbara Bilodeau, Bain & Company, “Management Tools & Trends (survey of 1,268 managers, fall 2017)”, 2018. https://www.bain.com/insights/management-tools-and-trends-2017/
- Paul J.H. Schoemaker, Sloan Management Review 36(2), “Scenario Planning: A Tool for Strategic Thinking”, 1995. https://sloanreview.mit.edu/article/scenario-planning-a-tool-for-strategic-thinking/
- Shardul Phadnis, Chris Caplice, Yossi Sheffi & Mahender Singh, Strategic Management Journal 36(9), “Effect of scenario planning on field experts' judgment of long-range investment decisions”, 2015. https://doi.org/10.1002/smj.2293
- Philip Meissner & Torsten Wulf, Technological Forecasting and Social Change 80(4), “Cognitive benefits of scenario planning: Its impact on biases and decision quality”, 2013 (via Abstract at IDEAS/RePEc; Phadnis et al., 2015). https://doi.org/10.1016/j.techfore.2012.09.011
- René Rohrbeck & Menes Etingue Kum, Technological Forecasting and Social Change 129, “Corporate foresight and its impact on firm performance: A longitudinal analysis”, 2018. https://doi.org/10.1016/j.techfore.2017.12.013
Edit orial me thod
Each figure was checked for its year, its publisher and what exactly it measures. Where the publisher's page could not be opened, the figure was checked against independent summaries and is marked “via”. The editors' interpretation is marked “Our reading”. Figures that could not be confirmed are not in the issue.
Management Review · Monthly edition