V. A. Graicunas counted a manager's relationships and found that a fifth subordinate more than doubles them. In Gallup's data the average US manager now has 12.1 direct reports, while the median stays at five or six. Luther Gulick saw the answer in the work itself. Studies of nurse managers show what wide spans cost, and Gallup finds that the weekly conversation counts for more than the size of the team.
Management Review · Second series · November 2026 · No. 57
How many people can one manager lead?
Graicunas's count of relationships, the average and the median team in Gallup's data, what the work decides, what wide spans cost in hospitals, the weekly conversation, and a card for one span.
- No.
- 57
- Pages
- 10
- Sources
- 8
- Topics
- Role
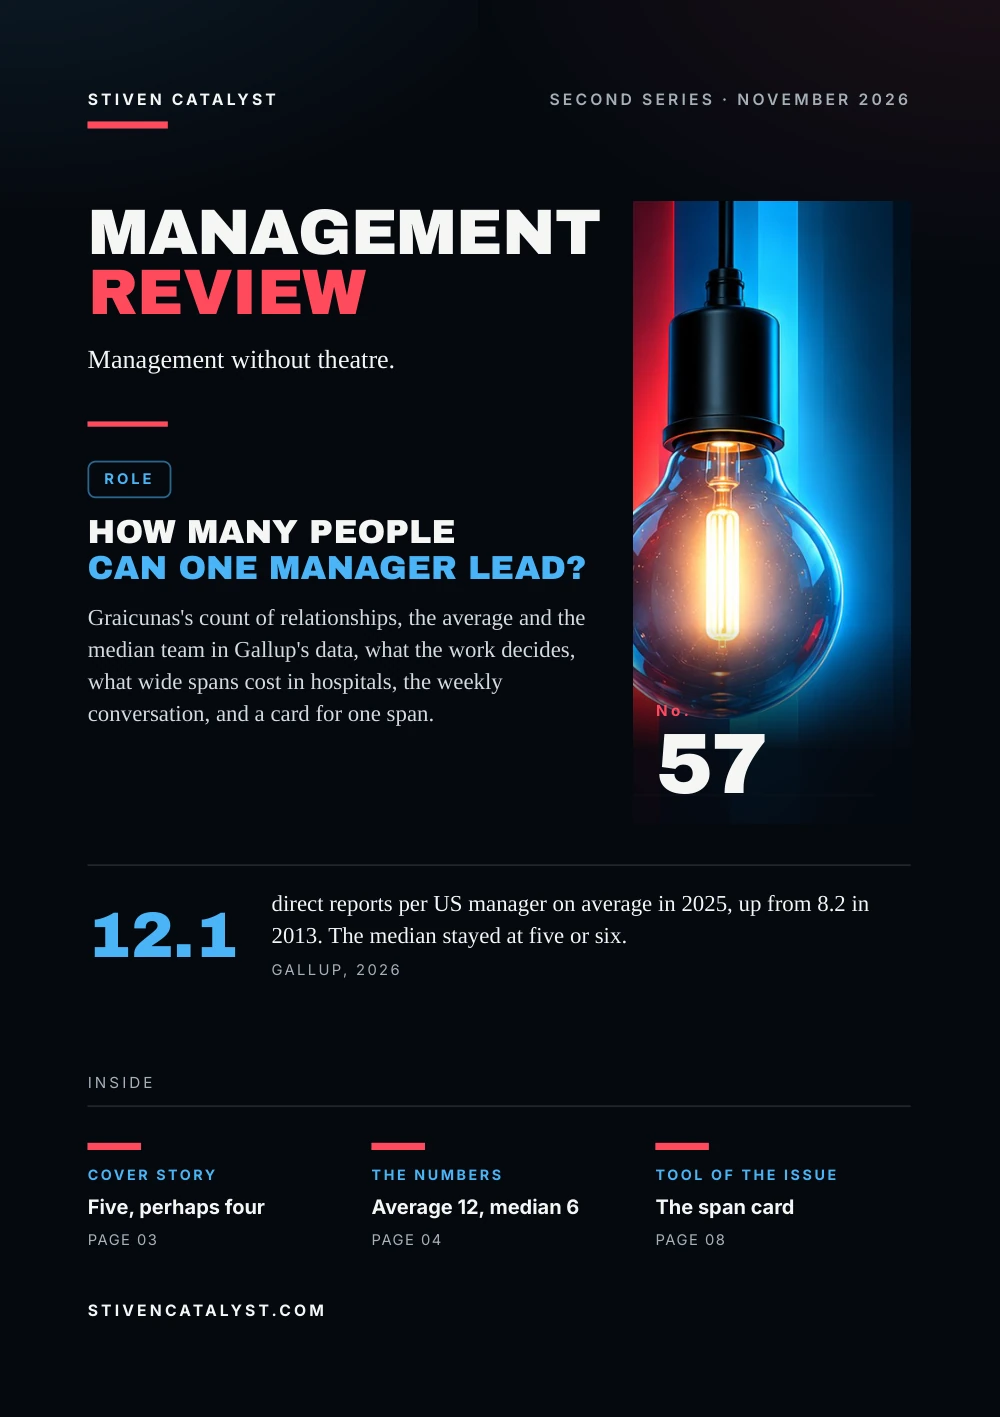
Stiven CatalystSecond series · November 2026
ManagementReview
Management without theatre.
Role
How many peoplecan one manager lead?
Graicunas's count of relationships, the average and the median team in Gallup's data, what the work decides, what wide spans cost in hospitals, the weekly conversation, and a card for one span.

No.57
12.1
direct reports per US manager on average in 2025, up from 8.2 in 2013. The median stayed at five or six.Gallup, 2026
stivencatalyst.com
No. 57 · Role
In this issue
Organisations are removing layers of management, and the managers who remain lead more people. How many is too many? This issue follows a question that was first answered with a formula in 1933 and is still answered with averages today.
- 03Cover storyFive, perhaps four
- 04The numbersAverage 12, median 6
- 05The modelThe work decides
- 06What the research saysWhat a wide span costs
- 07How it is measuredCount the conversations
- 08Tool of the issueThe span card
- 09SourcesSources and method
How to read this issue
Figure
Every figure has its source and year at the foot of its page.
Our reading
Where the editors interpret rather than the research, it says so.
Practice
The steps and the card are proposals to try, not research results.
Cover story
Five,perhaps four
In 1933 V. A. Graicunas, a management consultant in Paris, set out to show why no superior should be directly responsible for too many subordinates. Supervisors, he wrote, measure their burden by the people they supervise one to one. They should count the relationships.
Possible relationships of one manager, by number of direct subordinates (Graicunas, 1933)
With two subordinates, Dick and Harry, Tom has six: one with each, one with each while the other is there, and what each thinks of the other. A fifth subordinate takes the count from 44 to 100: “an increase in complexity of 127 per cent in return for a 20 per cent increase in working capacity”. His limit: five at most, most probably four.
Our reading
The formula counts what could happen, not what does. Its point still holds: what grows fastest is not the number of people but the ties between them.
Source: V. A. Graicunas, Bulletin of the International Management Institute; reprinted in Gulick & Urwick (eds.), Papers on the Science of Administration (1937), 1933
Graicunas's widest count: direct, group and cross relationships. He made an exception for routine work in which tasks hardly touch. Paper of 1933, read in the 1937 reprint.
The numbers
Average 12,median 6
Gallup asks managers and leaders in the US: “How many people report directly to you?” Since 2013 the average has risen by nearly half; in the last year alone it went from 10.9 to 12.1.
Average number of direct reports, managers and leaders in the US
The median stayed at five or six in every year. A minority of very large teams pulls the average up: 37% of managers lead fewer than five people, 13% lead 25 or more. Gallup links the latest rise to companies cutting middle-management roles. At the top the trend is older: in over 300 large US firms, the CEO's direct reports rose from 4.5 on average in 1986 to 6.8 in 1998.
Our reading
An average of 12 says little about any one manager. Most lead a small team; a few carry very large ones.
Sources: Jim Harter, Gallup, 2026; Raghuram G. Rajan & Julie Wulf, Review of Economics and Statistics 88(4), 2006 (via NBER Working Paper 9633 (2003, revised 2020))
Gallup Panel, US: 2,402 to 8,795 managers and leaders a year; margin for each average ±0.5 to ±0.8. The 1986–1998 figures come from a pay survey of large firms (Rajan & Wulf).
The model
The workdecides
Luther Gulick, who published Graicunas's paper in New York in 1937, gave no single number. Because the span is limited, a leader directs a few, who direct others, down to the last person. How many depends on the work: several score if it is routine and in one room, only a few if it is varied and scattered.
A wider span holds when
- the work is routine and repeats
- results are easy to measure
- everyone does the same kind of work
- people work in one place
- tasks hardly touch each other
A narrower span when
- the work is varied and qualitative
- results are hard to see
- each person does a different job
- people are scattered
- each one's work interlocks with the others'
Lyndall Urwick put the limit at five, or at most six, people whose work is interrelated. Sir Ian Hamilton, a general whom Graicunas and Gulick both quote, advised groups of three near the top of an organisation and groups of six near its foot.
Our reading
A span is not a number to copy from another team. It follows from how alike the work is and how much each job depends on the others.
Sources: Luther Gulick, in Gulick & Urwick (eds.), Papers on the Science of Administration, Institute of Public Administration, Columbia University, 1937; L. Urwick, in Gulick & Urwick (eds.), Papers on the Science of Administration, Institute of Public Administration, Columbia University, 1937; V. A. Graicunas, Bulletin of the International Management Institute; reprinted in Gulick & Urwick (eds.), Papers on the Science of Administration (1937), 1933
Gulick, Urwick and Graicunas in Papers on the Science of Administration (1937). The two lists are the editors' summary of Gulick; the last line of each follows Graicunas's exception for work that does not interlock.
More in the essayLeading people without losing the person
What the research says
What a wide spancosts
Hospital restructuring left many nurse managers with far more units and staff. Amy Sanchez McCutcheon and colleagues studied 51 units in seven Canadian hospitals: 41 managers, 717 nurses and 680 patients.
The wider the span, the lower the nurses' job satisfaction and the patients' satisfaction. Wide spans also weakened the good effect of the best leadership styles: as spans grew, no style made up for them.
15 / 40employees per manager: two thresholds above which engagement was worse, in a large US health system
4 of 4areas with better engagement scores a year after a manager post was added
A 2023 review of 21 studies found the same pattern: wide spans came with overload for the manager and with staff who felt they could not reach their leader. Where hospitals added administrative support, managers gained time to train staff and to be with patients.
Our reading
Good leadership does not stretch without limit. Past some size the manager is simply not there often enough.
Sources: Amy Sanchez McCutcheon, Diane Doran, Martin Evans, Linda McGillis Hall & Dorothy Pringle, Nursing Leadership 22(3), 2009; Deb Cathcart, Susan Jeska, Joan Karnas, Sue E. Miller, Judy Pechacek & Lolita Rheault, Journal of Nursing Administration 34(9), 2004 (via Abstract at Europe PMC; the thresholds from Boned-Galán et al. (2023)); Angel Boned-Galán, Nieves López-Ibort & Ana Gascón-Catalán, Nursing Reports 13(4), 2023; Jim Harter, Gallup, 2026
Studies of nurse managers, most of them surveys at one point in time: they show associations. The two thresholds come from the 2023 review, not from the 2004 abstract. In Gallup's data, the most talented managers stay more engaged with large teams.
How it is measured
Count theconversations
Gallup asked 44,025 US employees how big their team is and whether they had received meaningful feedback in the past week. The size of the team made little difference. The weekly conversation did.
Engaged employees by team size, with and without meaningful feedback in the past week
The manager's own work counts too. 97% of US managers also do individual work; the median is 40% of their time. Above that share, their own engagement falls as the team grows: from 36% with fewer than five reports to 32% with 25 or more.
Source: Jim Harter, Gallup, 2026
Gallup's employee data, 2022–2024, count the team a person mainly works on, not the manager's direct reports. “With” means they strongly agreed (5 of 5). A survey: it shows an association, not a cause.
Tool of the issue
The spancard
One manager, one card. Fill it in for your own team, or together with a manager who reports to you, and read the last two lines first.
01Direct reportshow many report to you directly; how many more through them
02How alike the work isthe same tasks for all, or a different job for each
03How it interlockscan each work alone, or does one wait for another
04Coaching neededwho is new, who is learning a task, who runs alone
05Time for my own workshare of the week spent doing, not leading (Gallup's median: 40%)
06Last week's conversationswith how many of them; who has had none for a month
Sources: Luther Gulick, in Gulick & Urwick (eds.), Papers on the Science of Administration, Institute of Public Administration, Columbia University, 1937; V. A. Graicunas, Bulletin of the International Management Institute; reprinted in Gulick & Urwick (eds.), Papers on the Science of Administration (1937), 1933; Jim Harter, Gallup, 2026
A practice proposed by the editors, after Gulick and Graicunas on the work, and Gallup on the manager's own work and the weekly conversation. The card sets no ideal number. The handover tool helps to give open issues an owner instead of carrying them yourself.
Open the tool: Shift Handoverstivencatalyst.com/tools/shift-handover/
Sources and method
Every figurehas a source.
The figures in this issue come from the sources below. The year shows how recent each one is.
- Relationship in OrganizationV. A. Graicunas, Bulletin of the International Management Institute; reprinted in Gulick & Urwick (eds.), Papers on the Science of Administration (1937), 1933https://archive.org/details/papersonscienceo00guli
- Span of Control: What's the Optimal Team Size for Managers?Jim Harter, Gallup, 2026https://www.gallup.com/workplace/700718/span-control-optimal-team-size-managers.aspx
- The Flattening Firm: Evidence from Panel Data on the Changing Nature of Corporate HierarchiesRaghuram G. Rajan & Julie Wulf, Review of Economics and Statistics 88(4), 2006 · via NBER Working Paper 9633 (2003, revised 2020)https://doi.org/10.1162/rest.88.4.759
- Notes on the Theory of OrganizationLuther Gulick, in Gulick & Urwick (eds.), Papers on the Science of Administration, Institute of Public Administration, Columbia University, 1937https://archive.org/details/papersonscienceo00guli
- Organization as a Technical ProblemL. Urwick, in Gulick & Urwick (eds.), Papers on the Science of Administration, Institute of Public Administration, Columbia University, 1937https://archive.org/details/papersonscienceo00guli
- Effects of Leadership and Span of Control on Nurses' Job Satisfaction and Patient SatisfactionAmy Sanchez McCutcheon, Diane Doran, Martin Evans, Linda McGillis Hall & Dorothy Pringle, Nursing Leadership 22(3), 2009https://doi.org/10.12927/cjnl.2009.21154
- Span of Control MattersDeb Cathcart, Susan Jeska, Joan Karnas, Sue E. Miller, Judy Pechacek & Lolita Rheault, Journal of Nursing Administration 34(9), 2004 · via Abstract at Europe PMC; the thresholds from Boned-Galán et al. (2023)https://doi.org/10.1097/00005110-200409000-00004
- Nurse Manager Span of Control in Hospital Settings: An Integrative ReviewAngel Boned-Galán, Nieves López-Ibort & Ana Gascón-Catalán, Nursing Reports 13(4), 2023https://doi.org/10.3390/nursrep13040131
Editorial method
Each figure was checked for its year, its publisher and what exactly it measures. Where the publisher's page could not be opened, the figure was checked against independent summaries and is marked “via”. The editors' interpretation is marked “Our reading”. Figures that could not be confirmed are not in the issue.
ManagementReview
Management without theatre.
Every issue, one management question, checked against the best research.
All issues
stivencatalyst.com/magazine/management-review.html
Management Review · No. 57 · November 2026 · Stiven Catalyst
Click or swipe a page to turn it. The arrow keys work too.
Management Review · No. 57
The figures of the issue
The charts of the printed pages, with their sources.
Source: V. A. Graicunas, Bulletin of the International Management Institute; reprinted in Gulick & Urwick (eds.), Papers on the Science of Administration (1937), 1933
Source: Jim Harter, Gallup, 2026
Source: Jim Harter, Gallup, 2026
The whole text Read the issue as text For reading on a small screen, searching or a screen reader. The same words, without the page design.
In this issue
Organisations are removing layers of management, and the managers who remain lead more people. How many is too many? This issue follows a question that was first answered with a formula in 1933 and is still answered with averages today.
V. A. Graicunas counted a manager's relationships and found that a fifth subordinate more than doubles them. In Gallup's data the average US manager now has 12.1 direct reports, while the median stays at five or six. Luther Gulick saw the answer in the work itself. Studies of nurse managers show what wide spans cost, and Gallup finds that the weekly conversation counts for more than the size of the team.
Stiven Janaqi, Editor
Cover story
Five, perhaps four
In 1933 V. A. Graicunas, a management consultant in Paris, set out to show why no superior should be directly responsible for too many subordinates. Supervisors, he wrote, measure their burden by the people they supervise one to one. They should count the relationships.
Possible relationships of one manager, by number of direct subordinates (Graicunas, 1933): 2 6, 3 18, 4 44, 5 100, 6 222, 7 490, 8 1,080.
With two subordinates, Dick and Harry, Tom has six: one with each, one with each while the other is there, and what each thinks of the other. A fifth subordinate takes the count from 44 to 100: “an increase in complexity of 127 per cent in return for a 20 per cent increase in working capacity”. His limit: five at most, most probably four.
Our reading
The formula counts what could happen, not what does. Its point still holds: what grows fastest is not the number of people but the ties between them.
Graicunas's widest count: direct, group and cross relationships. He made an exception for routine work in which tasks hardly touch. Paper of 1933, read in the 1937 reprint.
Source: V. A. Graicunas, Bulletin of the International Management Institute; reprinted in Gulick & Urwick (eds.), Papers on the Science of Administration (1937), 1933
The numbers
Average 12, median 6
Gallup asks managers and leaders in the US: “How many people report directly to you?” Since 2013 the average has risen by nearly half; in the last year alone it went from 10.9 to 12.1.
Average number of direct reports, managers and leaders in the US: 2013 8.2, 2019 9.1, 2022 10.5, 2023 10.6, 2024 10.9, 2025 12.1.
The median stayed at five or six in every year. A minority of very large teams pulls the average up: 37% of managers lead fewer than five people, 13% lead 25 or more. Gallup links the latest rise to companies cutting middle-management roles. At the top the trend is older: in over 300 large US firms, the CEO's direct reports rose from 4.5 on average in 1986 to 6.8 in 1998.
Our reading
An average of 12 says little about any one manager. Most lead a small team; a few carry very large ones.
Gallup Panel, US: 2,402 to 8,795 managers and leaders a year; margin for each average ±0.5 to ±0.8. The 1986–1998 figures come from a pay survey of large firms (Rajan & Wulf).
Sources: Jim Harter, Gallup, 2026; Raghuram G. Rajan & Julie Wulf, Review of Economics and Statistics 88(4), 2006 (via NBER Working Paper 9633 (2003, revised 2020))
The model
The work decides
Luther Gulick, who published Graicunas's paper in New York in 1937, gave no single number. Because the span is limited, a leader directs a few, who direct others, down to the last person. How many depends on the work: several score if it is routine and in one room, only a few if it is varied and scattered.
A wider span holds when
- the work is routine and repeats
- results are easy to measure
- everyone does the same kind of work
- people work in one place
- tasks hardly touch each other
A narrower span when
- the work is varied and qualitative
- results are hard to see
- each person does a different job
- people are scattered
- each one's work interlocks with the others'
Lyndall Urwick put the limit at five, or at most six, people whose work is interrelated. Sir Ian Hamilton, a general whom Graicunas and Gulick both quote, advised groups of three near the top of an organisation and groups of six near its foot.
Our reading
A span is not a number to copy from another team. It follows from how alike the work is and how much each job depends on the others.
Gulick, Urwick and Graicunas in Papers on the Science of Administration (1937). The two lists are the editors' summary of Gulick; the last line of each follows Graicunas's exception for work that does not interlock.
Sources: Luther Gulick, in Gulick & Urwick (eds.), Papers on the Science of Administration, Institute of Public Administration, Columbia University, 1937; L. Urwick, in Gulick & Urwick (eds.), Papers on the Science of Administration, Institute of Public Administration, Columbia University, 1937; V. A. Graicunas, Bulletin of the International Management Institute; reprinted in Gulick & Urwick (eds.), Papers on the Science of Administration (1937), 1933
More in the essay: Leading people without losing the person
What the research says
What a wide span costs
Hospital restructuring left many nurse managers with far more units and staff. Amy Sanchez McCutcheon and colleagues studied 51 units in seven Canadian hospitals: 41 managers, 717 nurses and 680 patients.
The wider the span, the lower the nurses' job satisfaction and the patients' satisfaction. Wide spans also weakened the good effect of the best leadership styles: as spans grew, no style made up for them.
- 15 / 40 employees per manager: two thresholds above which engagement was worse, in a large US health system
- 4 of 4 areas with better engagement scores a year after a manager post was added
A 2023 review of 21 studies found the same pattern: wide spans came with overload for the manager and with staff who felt they could not reach their leader. Where hospitals added administrative support, managers gained time to train staff and to be with patients.
Our reading
Good leadership does not stretch without limit. Past some size the manager is simply not there often enough.
Studies of nurse managers, most of them surveys at one point in time: they show associations. The two thresholds come from the 2023 review, not from the 2004 abstract. In Gallup's data, the most talented managers stay more engaged with large teams.
Sources: Amy Sanchez McCutcheon, Diane Doran, Martin Evans, Linda McGillis Hall & Dorothy Pringle, Nursing Leadership 22(3), 2009; Deb Cathcart, Susan Jeska, Joan Karnas, Sue E. Miller, Judy Pechacek & Lolita Rheault, Journal of Nursing Administration 34(9), 2004 (via Abstract at Europe PMC; the thresholds from Boned-Galán et al. (2023)); Angel Boned-Galán, Nieves López-Ibort & Ana Gascón-Catalán, Nursing Reports 13(4), 2023; Jim Harter, Gallup, 2026
How it is measured
Count the conversations
Gallup asked 44,025 US employees how big their team is and whether they had received meaningful feedback in the past week. The size of the team made little difference. The weekly conversation did.
Engaged employees by team size, with and without meaningful feedback in the past week: Fewer than 5: Without 22%, With weekly feedback 67%; 5 to 9: Without 25%, With weekly feedback 69%; 10 to 24: Without 26%, With weekly feedback 70%; 25 or more: Without 22%, With weekly feedback 68%.
The manager's own work counts too. 97% of US managers also do individual work; the median is 40% of their time. Above that share, their own engagement falls as the team grows: from 36% with fewer than five reports to 32% with 25 or more.
Gallup's employee data, 2022–2024, count the team a person mainly works on, not the manager's direct reports. “With” means they strongly agreed (5 of 5). A survey: it shows an association, not a cause.
Source: Jim Harter, Gallup, 2026
Tool of the issue
The span card
One manager, one card. Fill it in for your own team, or together with a manager who reports to you, and read the last two lines first.
- Direct repo
r ts how many report to you directly; how many more through them - How alike the work is the same tasks for all, or a different job for each
- How it interlocks can each work alone, or does one wait for another
- Coaching needed who is new, who is learning a task, who runs alone
- Time for my own work share of the week spent doing, not leading (Gallup's median: 40%)
- Last week's conversations with how many of them; who has had none for a month
A practice proposed by the editors, after Gulick and Graicunas on the work, and Gallup on the manager's own work and the weekly conversation. The card sets no ideal number. The handover tool helps to give open issues an owner instead of carrying them yourself.
Sources: Luther Gulick, in Gulick & Urwick (eds.), Papers on the Science of Administration, Institute of Public Administration, Columbia University, 1937; V. A. Graicunas, Bulletin of the International Management Institute; reprinted in Gulick & Urwick (eds.), Papers on the Science of Administration (1937), 1933; Jim Harter, Gallup, 2026
Open the tool: Shift Handover
Sources and method
Every figure has a source.
The figures in this issue come from the sources below. The year shows how recent each one is.
- V. A. Graicunas, Bulletin of the International Management Institute; reprinted in Gulick & Urwick (eds.), Papers on the Science of Administration (1937), “Relationship in Organization”, 1933. https://archive.org/details/papersonscienceo00guli
- Jim Harter, Gallup, “Span of Control: What's the Optimal Team Size for Managers?”, 2026. https://www.gallup.com/workplace/700718/span-control-optimal-team-size-managers.aspx
- Raghuram G. Rajan & Julie Wulf, Review of Economics and Statistics 88(4), “The Flattening Firm: Evidence from Panel Data on the Changing Nature of Corporate Hierarchies”, 2006 (via NBER Working Paper 9633 (2003, revised 2020)). https://doi.org/10.1162/rest.88.4.759
- Luther Gulick, in Gulick & Urwick (eds.), Papers on the Science of Administration, Institute of Public Administration, Columbia University, “Notes on the Theory of Organization”, 1937. https://archive.org/details/papersonscienceo00guli
- L. Urwick, in Gulick & Urwick (eds.), Papers on the Science of Administration, Institute of Public Administration, Columbia University, “Organization as a Technical Problem”, 1937. https://archive.org/details/papersonscienceo00guli
- Amy Sanchez McCutcheon, Diane Doran, Martin Evans, Linda McGillis Hall & Dorothy Pringle, Nursing Leadership 22(3), “Effects of Leadership and Span of Control on Nurses' Job Satisfaction and Patient Satisfaction”, 2009. https://doi.org/10.12927/cjnl.2009.21154
- Deb Cathcart, Susan Jeska, Joan Karnas, Sue E. Miller, Judy Pechacek & Lolita Rheault, Journal of Nursing Administration 34(9), “Span of Control Matters”, 2004 (via Abstract at Europe PMC; the thresholds from Boned-Galán et al. (2023)). https://doi.org/10.1097/00005110-200409000-00004
- Angel Boned-Galán, Nieves López-Ibort & Ana Gascón-Catalán, Nursing Reports 13(4), “Nurse Manager Span of Control in Hospital Settings: An Integrative Review”, 2023. https://doi.org/10.3390/nursrep13040131
Edit orial me thod
Each figure was checked for its year, its publisher and what exactly it measures. Where the publisher's page could not be opened, the figure was checked against independent summaries and is marked “via”. The editors' interpretation is marked “Our reading”. Figures that could not be confirmed are not in the issue.
Management Review · Monthly edition