Mike Rother and John Shook took a simple Toyota diagram and made it a method. In an oncology day hospital in Spain, a map showed patients spending most of the day waiting for a laboratory and a pharmacy whose work took minutes. A review of 80 healthcare publications found that many maps stop at the current state. Karen Martin and Mike Osterling measure a flow with three numbers and a ratio, and the card at the end is for your first map on paper.
Management Review · Second series · November 2026 · No. 56
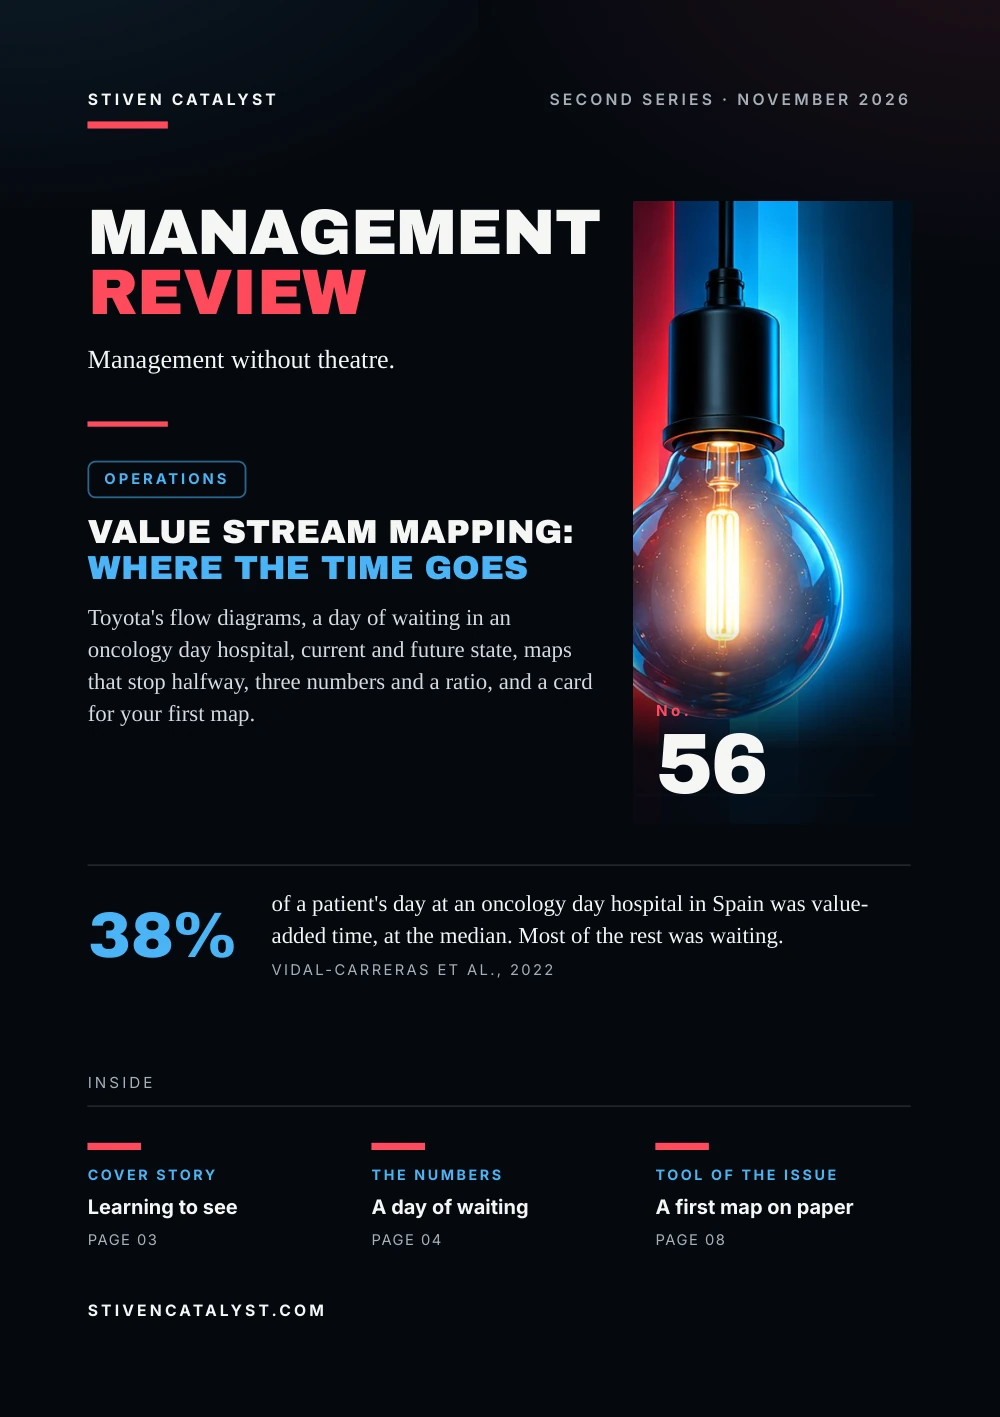
Value stream mapping: where the time goes
Toyota's flow diagrams, a day of waiting in an oncology day hospital, current and future state, maps that stop halfway, three numbers and a ratio, and a card for your first map.
- No.
- 56
- Pages
- 10
- Sources
- 8
- Topics
- Operations
Stiven CatalystSecond series · November 2026
ManagementReview
Management without theatre.
Operations
Value stream mapping:where the time goes
Toyota's flow diagrams, a day of waiting in an oncology day hospital, current and future state, maps that stop halfway, three numbers and a ratio, and a card for your first map.

No.56
38%
of a patient's day at an oncology day hospital in Spain was value-added time, at the median. Most of the rest was waiting.Vidal-Carreras et al., 2022
stivencatalyst.com
No. 56 · Operations
In this issue
Work is usually managed department by department, and each department can look efficient. The time the customer waits sits between them. This issue is about drawing one flow from end to end, seeing how much of its time is work, and drawing the next state before changing anything.
- 03Cover storyLearning to see
- 04The numbersA day of waiting
- 05The modelCurrent state, future state
- 06What the research saysMaps without a future
- 07How it is measuredThree numbers and a ratio
- 08Tool of the issueA first map on paper
- 09SourcesSources and method
How to read this issue
Figure
Every figure has its source and year at the foot of its page.
Our reading
Where the editors interpret rather than the research, it says so.
Practice
The steps and the card are proposals to try, not research results.
Cover story
Learningt o see
In 1998 Mike Rother and John Shook wrote that a simple tool had been right under their noses. At Toyota it was called material and information flow mapping and was used to draw the current and future state of a process. Rother noticed it studying Toyota; Shook had known it for over ten years without thinking it important.
“The challenge lies in seeing it.”
Wherever there is a product for a customer, they write, there is a value stream. Dan Jones and Jim Womack describe the difficulty from their own walks: most managers want to stand in one place and look at their machine, their department, their plant. These often do well on the usual measures. When the managers follow the product instead, the whole stream turns out to perform poorly.
Our reading
A department can be on target while the customer waits. The map changes the question from how busy each step is to how long the product sits between steps.
Sources: Mike Rother & John Shook, Lean Enterprise Institute, 1999 (via Lean Enterprise Institute, introduction and Part I excerpts); Dan Jones & Jim Womack, Lean Enterprise Institute, 2011 (via Lean Enterprise Institute, introduction excerpt)
From the authors' introduction of May 1998; the workbook appeared at the Lean Enterprise Institute in 1999. The quote is confirmed only in secondary sources. Jones and Womack: Seeing the Whole Value Stream (2011).
The numbers
A dayof waiting
Pilar Vidal-Carreras and colleagues mapped the day of adults receiving chemotherapy at the oncology day hospital of a large public hospital in Spain: a blood test, a visit to the oncologist, then the treatment. Patients waited 300 minutes; the median stay was 446.
Value-added time as a share of the stay, median
The laboratory could test a sample in under 15 minutes, yet the next appointment was an hour later. A dose took 15 minutes to prepare on average, yet the pharmacy would not promise it in less than three hours: requests from the whole hospital arrived at once, with no priority.
Our reading
The work was quick. The day was long because of the time between departments, which no department owned.
Source: Pilar I. Vidal-Carreras, Julio J. Garcia-Sabater & Juan A. Marin-Garcia, International Journal of Environmental Research and Public Health 19(7), 2022
The future states are designs, not yet in place: the gains are projected, not measured. One hospital; the number of patients observed is not given.
The model
Current state,future state
Rother and Shook map one product family from door to door. They follow its path from the customer back to the supplier and draw two flows: the material, and the information that tells each step what to do next.
- 01
Product family
Chosen from the customer end: what, how much, how often?
- 02
Current state
Drawn on the floor, walking the flow.
- 03
Future state
How value should flow. The most important map.
- 04
Plan
One page on how to get there, reviewed regularly.
The arrows run both ways: ideas for the future come up while mapping the present. In their words, “a current state without a future state is not much use.” One person with authority across departments, a value-stream manager, leads the work: improving the flow is “management doing kaizen”, while teams improve their own steps.
Our reading
On a map, most boxes look busy. The map is worth drawing for the lines between the boxes.
Source: Mike Rother & John Shook, Lean Enterprise Institute, 1999 (via Lean Enterprise Institute, introduction and Part I excerpts)
Steps and quotes follow Part I of Learning to See, an excerpt published by the Lean Enterprise Institute. The reading is the editors'.
More in the essayWhere part of the order goes missing
What the research says
Mapswithout a future
Juan Marin-Garcia and colleagues reviewed 80 publications on value stream mapping in healthcare from 2015 to 2019. Twenty spoke of a map but drew none. For the other 60, the team checked what the map showed.
What the 60 drawn maps show
No study reported a negative or barely noticeable result; the authors ask whether publication bias plays a part. Reviewing 131 articles from five sectors (1999–2016), Wenchi Shou and colleagues conclude that the key is what value and waste mean in each kind of flow, and whether classic lean metrics fit it.
Our reading
A current-state map is a photograph. Only the future state turns it into a decision.
Sources: Juan A. Marin-Garcia, Pilar I. Vidal-Carreras & Julio J. Garcia-Sabater, International Journal of Environmental Research and Public Health 18(3), 2021; Wenchi Shou, Jun Wang, Peng Wu, Xiangyu Wang & Heap-Yih Chong, International Journal of Production Research 55(13), 2017 (via Abstract at Semantic Scholar and Western Sydney University)
Waiting and the lead-time line are read from a figure; the other two follow the text (the figure shows 21 and 18). Shou's sectors: manufacturing, health care, construction, product development, services.
How it is measured
Three numbersand a ratio
Karen Martin and Mike Osterling map office and service work. For every step on the map they note two times and one measure of quality; a timeline under the steps adds them up.
01
Process time
the time it takes to actually do the work
02
Lead time
from the moment work is available to a step until it is passed on
03
%C&A
percent complete and accurate: how often the next step can use the work without correcting, adding or clarifying
Work that arrives at 1 pm and leaves at 3 pm has a lead time of two hours, even if it takes 20 minutes. The activity ratio is the sum of the process times divided by the sum of the lead times.
Hypothetical example, a customer refund in an office
- Process time
- 80 minutes over five steps
- Lead time
- 4 working days, 1,920 minutes
- Activity ratio
- 80 / 1,920 = 4.2%
Faster work would save minutes; the days are in the queues. The numbers are invented.
Sources: Karen Martin & Mike Osterling, McGraw-Hill Education, 2014 (via Karen Martin, "Value Stream Mapping: Lead Time" (author's blog, 2014)); Karen Martin & Associates, Institute of Industrial Engineers, 2009; Lean Enterprise Institute, 2014
The times, the formula and the two-hour case follow Martin (2014), %C&A her 2009 slides. The LEI lexicon likewise calls processing time a small fraction of lead time. The example is the editors'.
Tool of the issue
A first mapon paper
One flow, a pencil and a walk. Start where the customer receives the work and go back step by step; write down what you see and time it yourself.
01The flowwhich product or request, for which customer, how many a day
02Stepsone box per step, from the customer back; process time under each
03Waitingbetween the steps: how many wait, for how long
04Informationwho tells each step what to do next, and how
05The timelinetotal lead time, total process time, activity ratio
06One change for the future statewhere the flow should not wait; who leads it, by when
Sources: Mike Rother & John Shook, Lean Enterprise Institute, 1999 (via Lean Enterprise Institute, introduction and Part I excerpts); Karen Martin & Mike Osterling, McGraw-Hill Education, 2014 (via Karen Martin, "Value Stream Mapping: Lead Time" (author's blog, 2014))
A practice proposed by the editors, after Rother & Shook and Martin & Osterling.
Open the tool: Delay Analyzerstivencatalyst.com/tools/delay-analyzer/
Sources and method
Every figurehas a source.
The figures in this issue come from the sources below. The year shows how recent each one is.
- Learning to SeeMike Rother & John Shook, Lean Enterprise Institute, 1999 · via Lean Enterprise Institute, introduction and Part I excerptshttps://www.lean.org/wp-content/uploads/2021/01/Learning-to-See-part1.pdf
- Lean Lexicon: value-stream mapping; production lead time, processing time, value-creating timeLean Enterprise Institute, 2014https://www.lean.org/lexicon-terms/value-stream-mapping/
- Seeing the Whole Value StreamDan Jones & Jim Womack, Lean Enterprise Institute, 2011 · via Lean Enterprise Institute, introduction excerpthttps://www.lean.org/wp-content/uploads/2021/01/seeing-the-whole-introduction.pdf
- Applying Value Stream Mapping to Improve the Delivery of Patient Care in the Oncology Day HospitalPilar I. Vidal-Carreras, Julio J. Garcia-Sabater & Juan A. Marin-Garcia, International Journal of Environmental Research and Public Health 19(7), 2022https://doi.org/10.3390/ijerph19074265
- The Role of Value Stream Mapping in Healthcare Services: A Scoping ReviewJuan A. Marin-Garcia, Pilar I. Vidal-Carreras & Julio J. Garcia-Sabater, International Journal of Environmental Research and Public Health 18(3), 2021https://doi.org/10.3390/ijerph18030951
- A cross-sector review on the use of value stream mappingWenchi Shou, Jun Wang, Peng Wu, Xiangyu Wang & Heap-Yih Chong, International Journal of Production Research 55(13), 2017 · via Abstract at Semantic Scholar and Western Sydney Universityhttps://doi.org/10.1080/00207543.2017.1311031
- Value Stream Mapping: How to Visualize Work and Align Leadership for Organizational TransformationKaren Martin & Mike Osterling, McGraw-Hill Education, 2014 · via Karen Martin, "Value Stream Mapping: Lead Time" (author's blog, 2014)https://www.goodreads.com/author_blog_posts/6062479-value-stream-mapping-lead-time
- Metrics-Based Process Mapping (webinar slides)Karen Martin & Associates, Institute of Industrial Engineers, 2009https://www.iise.org/uploadedfiles/Webcasts/2009%20Webinar%20Metrics-Based%20Process%20Mapping.pdf
Editorial method
Each figure was checked for its year, its publisher and what exactly it measures. Where the publisher's page could not be opened, the figure was checked against independent summaries and is marked “via”. The editors' interpretation is marked “Our reading”. Figures that could not be confirmed are not in the issue.
ManagementReview
Management without theatre.
Every issue, one management question, checked against the best research.
All issues
stivencatalyst.com/magazine/management-review.html
Management Review · No. 56 · November 2026 · Stiven Catalyst
Click or swipe a page to turn it. The arrow keys work too.
Management Review · No. 56
The figures of the issue
The charts of the printed pages, with their sources.
Source: Pilar I. Vidal-Carreras, Julio J. Garcia-Sabater & Juan A. Marin-Garcia, International Journal of Environmental Research and Public Health 19(7), 2022
Source: Juan A. Marin-Garcia, Pilar I. Vidal-Carreras & Julio J. Garcia-Sabater, International Journal of Environmental Research and Public Health 18(3), 2021
The whole text Read the issue as text For reading on a small screen, searching or a screen reader. The same words, without the page design.
In this issue
Work is usually managed department by department, and each department can look efficient. The time the customer waits sits between them. This issue is about drawing one flow from end to end, seeing how much of its time is work, and drawing the next state before changing anything.
Mike Rother and John Shook took a simple Toyota diagram and made it a method. In an oncology day hospital in Spain, a map showed patients spending most of the day waiting for a laboratory and a pharmacy whose work took minutes. A review of 80 healthcare publications found that many maps stop at the current state. Karen Martin and Mike Osterling measure a flow with three numbers and a ratio, and the card at the end is for your first map on paper.
Stiven Janaqi, Editor
Cover story
Learning t o see
In 1998 Mike Rother and John Shook wrote that a simple tool had been right under their noses. At Toyota it was called material and information flow mapping and was used to draw the current and future state of a process. Rother noticed it studying Toyota; Shook had known it for over ten years without thinking it important.
The challenge lies in seeing it.
Wherever there is a product for a customer, they write, there is a value stream. Dan Jones and Jim Womack describe the difficulty from their own walks: most managers want to stand in one place and look at their machine, their department, their plant. These often do well on the usual measures. When the managers follow the product instead, the whole stream turns out to perform poorly.
Our reading
A department can be on target while the customer waits. The map changes the question from how busy each step is to how long the product sits between steps.
From the authors' introduction of May 1998; the workbook appeared at the Lean Enterprise Institute in 1999. The quote is confirmed only in secondary sources. Jones and Womack: Seeing the Whole Value Stream (2011).
Sources: Mike Rother & John Shook, Lean Enterprise Institute, 1999 (via Lean Enterprise Institute, introduction and Part I excerpts); Dan Jones & Jim Womack, Lean Enterprise Institute, 2011 (via Lean Enterprise Institute, introduction excerpt)
The numbers
A day of waiting
Pilar Vidal-Carreras and colleagues mapped the day of adults receiving chemotherapy at the oncology day hospital of a large public hospital in Spain: a blood test, a visit to the oncologist, then the treatment. Patients waited 300 minutes; the median stay was 446.
Value-added time as a share of the stay, median: Current state 38.1%, Future state 2, projected 57.4%, Future state 1, projected 75.2%.
The laboratory could test a sample in under 15 minutes, yet the next appointment was an hour later. A dose took 15 minutes to prepare on average, yet the pharmacy would not promise it in less than three hours: requests from the whole hospital arrived at once, with no priority.
Our reading
The work was quick. The day was long because of the time between departments, which no department owned.
The future states are designs, not yet in place: the gains are projected, not measured. One hospital; the number of patients observed is not given.
Source: Pilar I. Vidal-Carreras, Julio J. Garcia-Sabater & Juan A. Marin-Garcia, International Journal of Environmental Research and Public Health 19(7), 2022
The model
Current state, future state
Rother and Shook map one product family from door to door. They follow its path from the customer back to the supplier and draw two flows: the material, and the information that tells each step what to do next.
- Product family. Chosen from the customer end: what, how much, how often?
- Current state. Drawn on the floor, walking the flow.
- Future state. How value should flow. The most important map.
- Plan. One page on how to get there, reviewed regularly.
The arrows run both ways: ideas for the future come up while mapping the present. In their words, “a current state without a future state is not much use.” One person with authority across departments, a value-stream manager, leads the work: improving the flow is “management doing kaizen”, while teams improve their own steps.
Our reading
On a map, most boxes look busy. The map is worth drawing for the lines between the boxes.
Steps and quotes follow Part I of Learning to See, an excerpt published by the Lean Enterprise Institute. The reading is the editors'.
Source: Mike Rother & John Shook, Lean Enterprise Institute, 1999 (via Lean Enterprise Institute, introduction and Part I excerpts)
More in the essay: Where part of the order goes missing
What the research says
Maps without a future
Juan Marin-Garcia and colleagues reviewed 80 publications on value stream mapping in healthcare from 2015 to 2019. Twenty spoke of a map but drew none. For the other 60, the team checked what the map showed.
What the 60 drawn maps show: Waiting 38 of 60, A lead-time line 22 of 60, A future state 20 of 60, The information flow 19 of 60.
No study reported a negative or barely noticeable result; the authors ask whether publication bias plays a part. Reviewing 131 articles from five sectors (1999–2016), Wenchi Shou and colleagues conclude that the key is what value and waste mean in each kind of flow, and whether classic lean metrics fit it.
Our reading
A current-state map is a photograph. Only the future state turns it into a decision.
Waiting and the lead-time line are read from a figure; the other two follow the text (the figure shows 21 and 18). Shou's sectors: manufacturing, health care, construction, product development, services.
Sources: Juan A. Marin-Garcia, Pilar I. Vidal-Carreras & Julio J. Garcia-Sabater, International Journal of Environmental Research and Public Health 18(3), 2021; Wenchi Shou, Jun Wang, Peng Wu, Xiangyu Wang & Heap-Yih Chong, International Journal of Production Research 55(13), 2017 (via Abstract at Semantic Scholar and Western Sydney University)
How it is measured
Three numbers and a ratio
Karen Martin and Mike Osterling map office and service work. For every step on the map they note two times and one measure of quality; a timeline under the steps adds them up.
- Process time. the time it takes to actually do the work
- Lead time. from the moment work is available to a step until it is passed on
- %C&A. percent complete and accurate: how often the next step can use the work without correcting, adding or clarifying
Work that arrives at 1 pm and leaves at 3 pm has a lead time of two hours, even if it takes 20 minutes. The activity ratio is the sum of the process times divided by the sum of the lead times.
Hypothe tical example, a cust omer refund in an office
- Process time: 80 minutes over five steps
- Lead time: 4 working days, 1,920 minutes
- Activi
t y ratio: 80 / 1,920 = 4.2%
Faster work would save minutes; the days are in the queues. The numbers are invented.
The times, the formula and the two-hour case follow Martin (2014), %C&A her 2009 slides. The LEI lexicon likewise calls processing time a small fraction of lead time. The example is the editors'.
Sources: Karen Martin & Mike Osterling, McGraw-Hill Education, 2014 (via Karen Martin, "Value Stream Mapping: Lead Time" (author's blog, 2014)); Karen Martin & Associates, Institute of Industrial Engineers, 2009; Lean Enterprise Institute, 2014
Tool of the issue
A first map on paper
One flow, a pencil and a walk. Start where the customer receives the work and go back step by step; write down what you see and time it yourself.
- The flow which product or request, for which customer, how many a day
- Steps one box per step, from the customer back; process time under each
- Waiting between the steps: how many wait, for how long
- Information who tells each step what to do next, and how
- The timeline total lead time, total process time, activity ratio
- One change for the future state where the flow should not wait; who leads it, by when
A practice proposed by the editors, after Rother & Shook and Martin & Osterling.
Sources: Mike Rother & John Shook, Lean Enterprise Institute, 1999 (via Lean Enterprise Institute, introduction and Part I excerpts); Karen Martin & Mike Osterling, McGraw-Hill Education, 2014 (via Karen Martin, "Value Stream Mapping: Lead Time" (author's blog, 2014))
Open the tool: Delay Analyzer
Sources and method
Every figure has a source.
The figures in this issue come from the sources below. The year shows how recent each one is.
- Mike Rother & John Shook, Lean Enterprise Institute, “Learning to See”, 1999 (via Lean Enterprise Institute, introduction and Part I excerpts). https://www.lean.org/wp-content/uploads/2021/01/Learning-to-See-part1.pdf
- Lean Enterprise Institute, “Lean Lexicon: value-stream mapping; production lead time, processing time, value-creating time”, 2014. https://www.lean.org/lexicon-terms/value-stream-mapping/
- Dan Jones & Jim Womack, Lean Enterprise Institute, “Seeing the Whole Value Stream”, 2011 (via Lean Enterprise Institute, introduction excerpt). https://www.lean.org/wp-content/uploads/2021/01/seeing-the-whole-introduction.pdf
- Pilar I. Vidal-Carreras, Julio J. Garcia-Sabater & Juan A. Marin-Garcia, International Journal of Environmental Research and Public Health 19(7), “Applying Value Stream Mapping to Improve the Delivery of Patient Care in the Oncology Day Hospital”, 2022. https://doi.org/10.3390/ijerph19074265
- Juan A. Marin-Garcia, Pilar I. Vidal-Carreras & Julio J. Garcia-Sabater, International Journal of Environmental Research and Public Health 18(3), “The Role of Value Stream Mapping in Healthcare Services: A Scoping Review”, 2021. https://doi.org/10.3390/ijerph18030951
- Wenchi Shou, Jun Wang, Peng Wu, Xiangyu Wang & Heap-Yih Chong, International Journal of Production Research 55(13), “A cross-sector review on the use of value stream mapping”, 2017 (via Abstract at Semantic Scholar and Western Sydney University). https://doi.org/10.1080/00207543.2017.1311031
- Karen Martin & Mike Osterling, McGraw-Hill Education, “Value Stream Mapping: How to Visualize Work and Align Leadership for Organizational Transformation”, 2014 (via Karen Martin, "Value Stream Mapping: Lead Time" (author's blog, 2014)). https://www.goodreads.com/author_blog_posts/6062479-value-stream-mapping-lead-time
- Karen Martin & Associates, Institute of Industrial Engineers, “Metrics-Based Process Mapping (webinar slides)”, 2009. https://www.iise.org/uploadedfiles/Webcasts/2009%20Webinar%20Metrics-Based%20Process%20Mapping.pdf
Edit orial me thod
Each figure was checked for its year, its publisher and what exactly it measures. Where the publisher's page could not be opened, the figure was checked against independent summaries and is marked “via”. The editors' interpretation is marked “Our reading”. Figures that could not be confirmed are not in the issue.
Management Review · Monthly edition