
In this issue
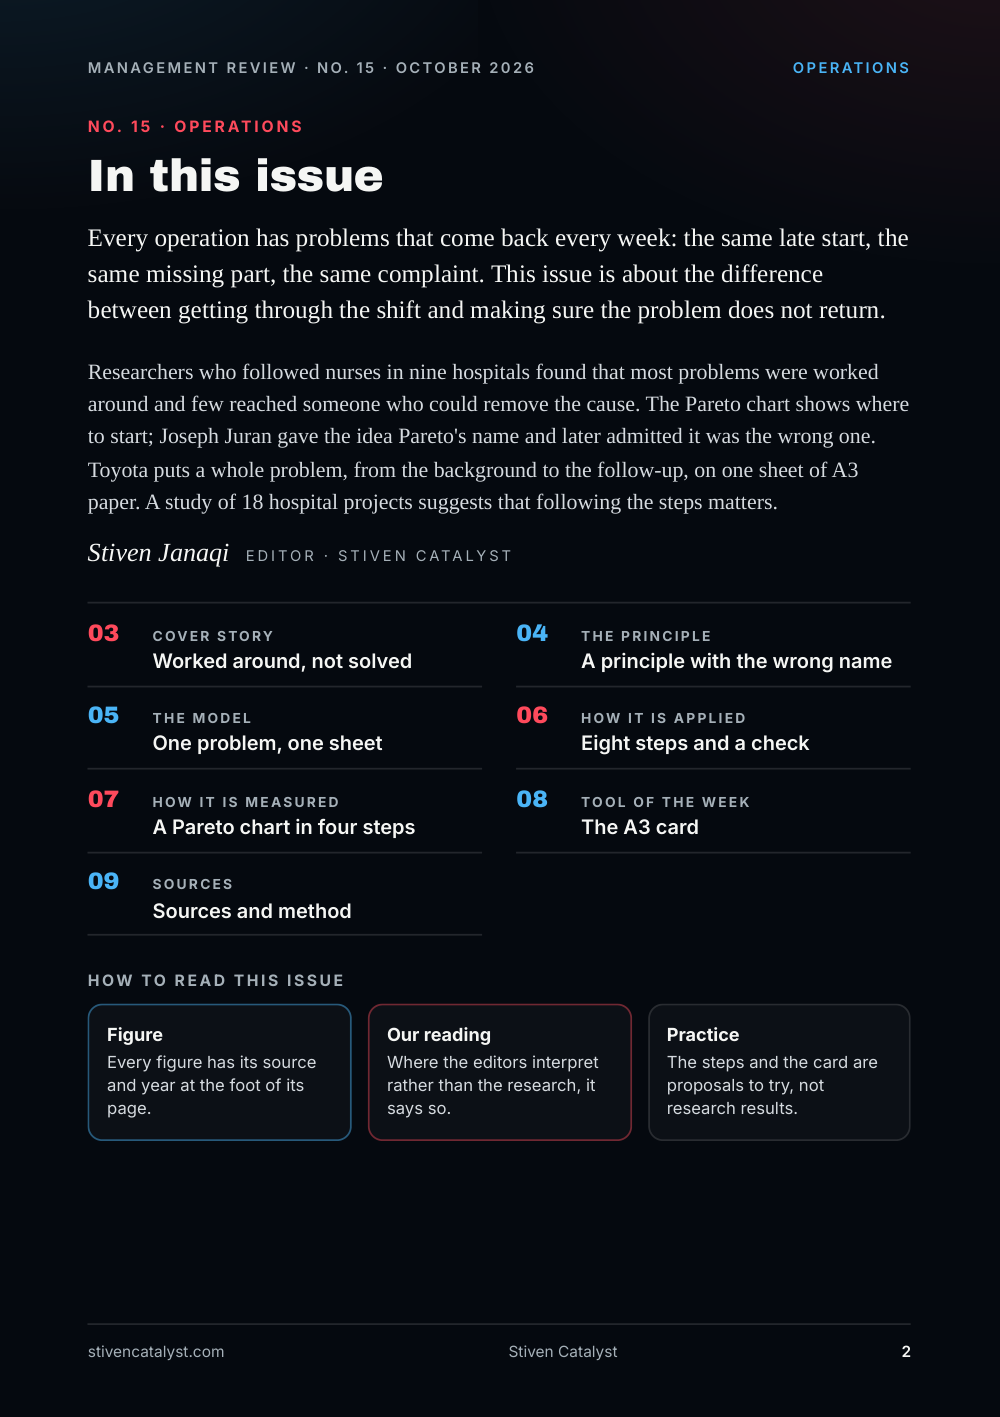
Every operation has problems that come back every week: the same late start, the same missing part, the same complaint. This issue is about the difference between getting through the shift and making sure the problem does not return.
Researchers who followed nurses in nine hospitals found that most problems were worked around and few reached someone who could remove the cause. The Pareto chart shows where to start; Joseph Juran gave the idea Pareto's name and later admitted it was the wrong one. Toyota puts a whole problem, from the background to the follow-up, on one sheet of A3 paper. A study of 18 hospital projects suggests that following the steps matters.
Stiven Janaqi, Editor
Cover story
Worked around, not solved
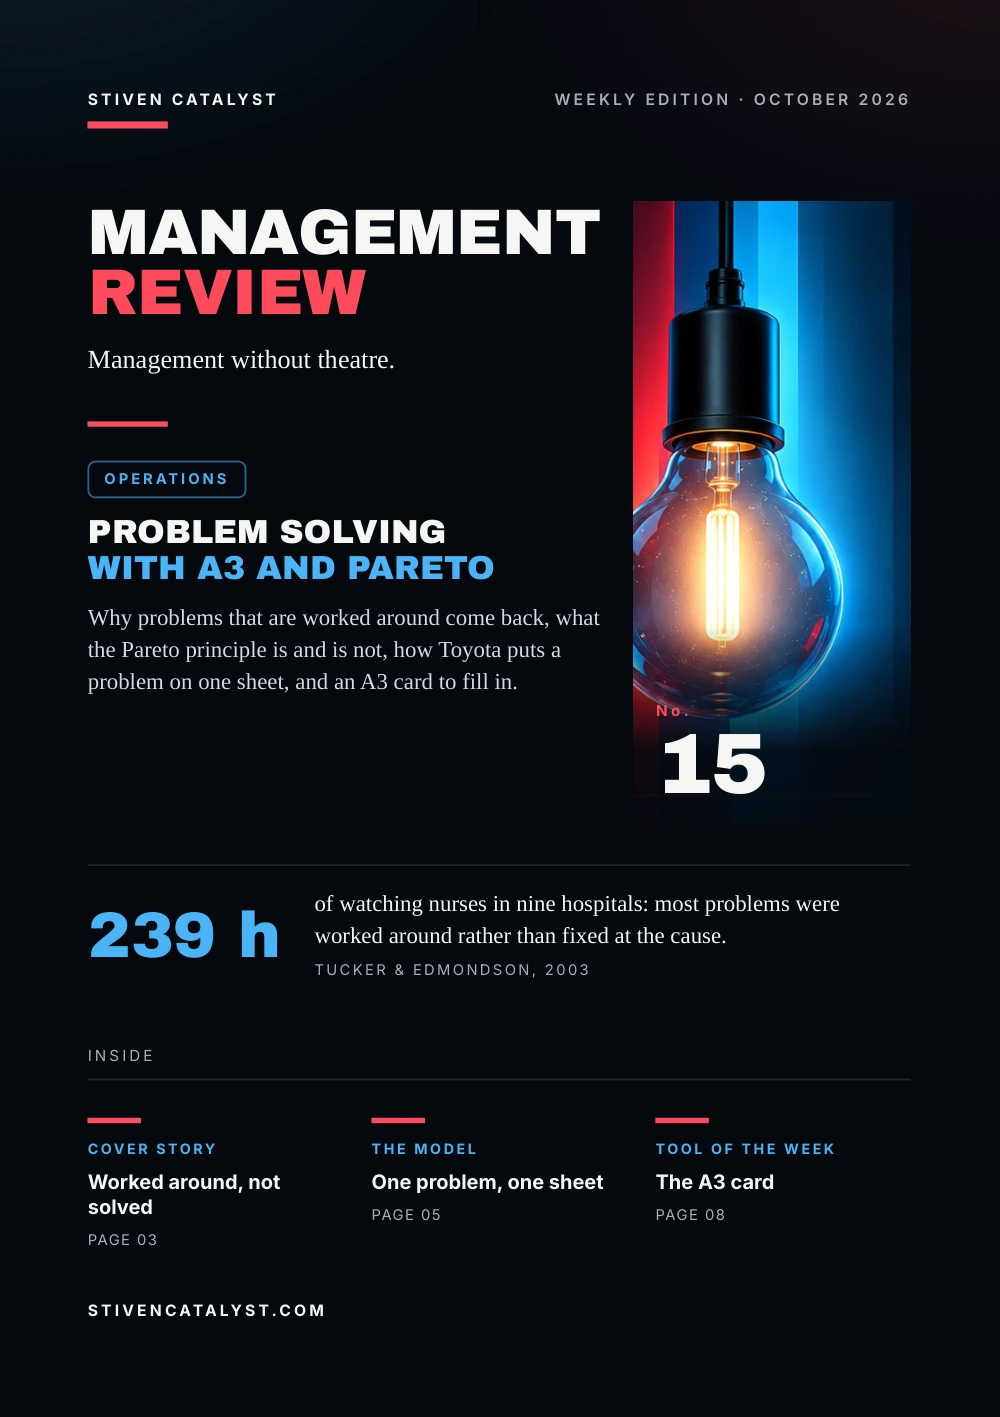
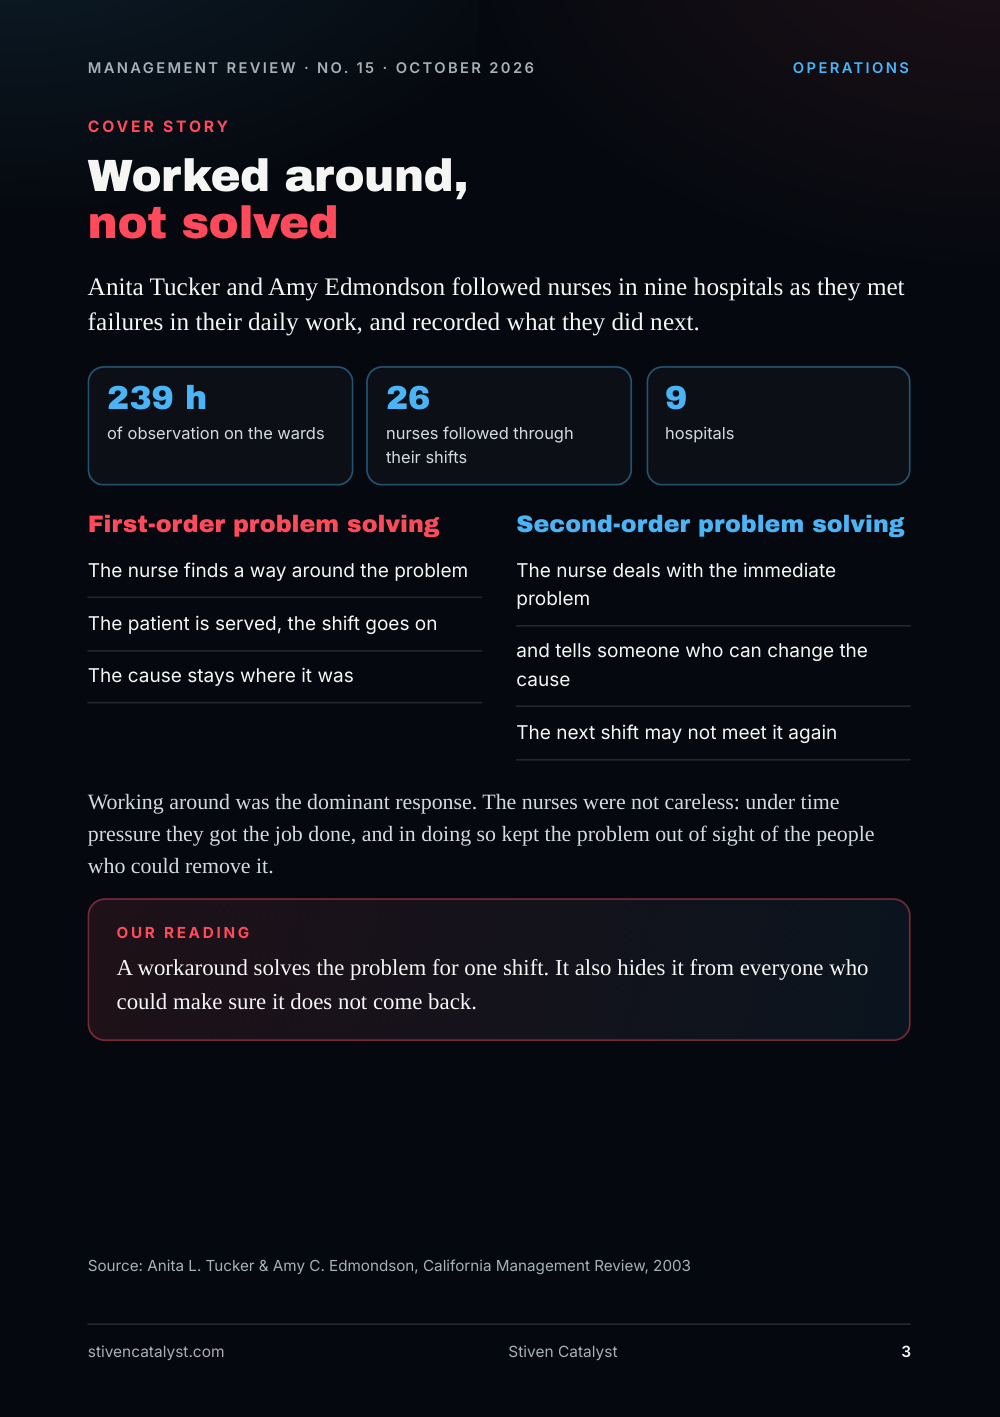
Anita Tucker and Amy Edmondson followed nurses in nine hospitals as they met failures in their daily work, and recorded what they did next.
- 239 h of observation on the wards
- 26 nurses followed through their shifts
- 9 hospitals
First-order problem solving
- The nurse finds a way around the problem
- The patient is served, the shift goes on
- The cause stays where it was
Second-order problem solving
- The nurse deals with the immediate problem
- and tells someone who can change the cause
- The next shift may not meet it again
Working around was the dominant response. The nurses were not careless: under time pressure they got the job done, and in doing so kept the problem out of sight of the people who could remove it.
Our reading
A workaround solves the problem for one shift. It also hides it from everyone who could make sure it does not come back.
Source: Anita L. Tucker & Amy C. Edmondson, California Management Review, 2003
The principle
A principle with the wrong name
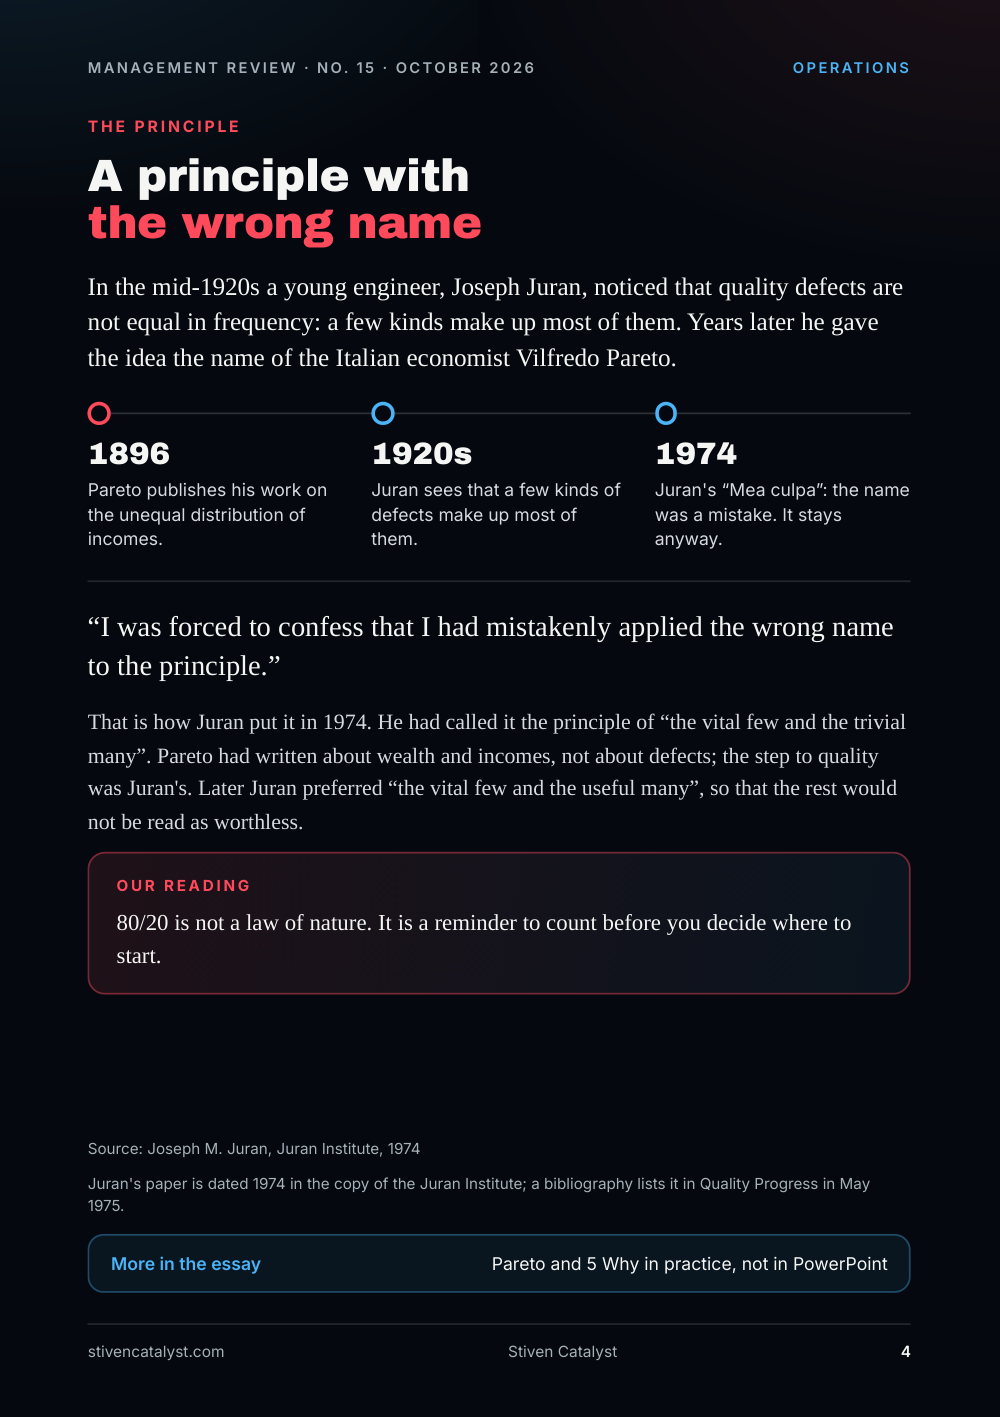
In the mid-1920s a young engineer, Joseph Juran, noticed that quality defects are not equal in frequency: a few kinds make up most of them. Years later he gave the idea the name of the Italian economist Vilfredo Pareto.
- 1896 Pareto publishes his work on the unequal distribution of incomes.
- 1920s Juran sees that a few kinds of defects make up most of them.
- 1974 Juran's “Mea culpa”: the name was a mistake. It stays anyway.
I was forced to confess that I had mistakenly applied the wrong name to the principle.
That is how Juran put it in 1974. He had called it the principle of “the vital few and the trivial many”. Pareto had written about wealth and incomes, not about defects; the step to quality was Juran's. Later Juran preferred “the vital few and the useful many”, so that the rest would not be read as worthless.
Our reading
80/20 is not a law of nature. It is a reminder to count before you decide where to start.
Juran's paper is dated 1974 in the copy of the Juran Institute; a bibliography lists it in Quality Progress in May 1975.
Source: Joseph M. Juran, Juran Institute, 1974
More in the essay: Pareto and 5 Why in practice, not in PowerPoint
The model
One problem, one shee t
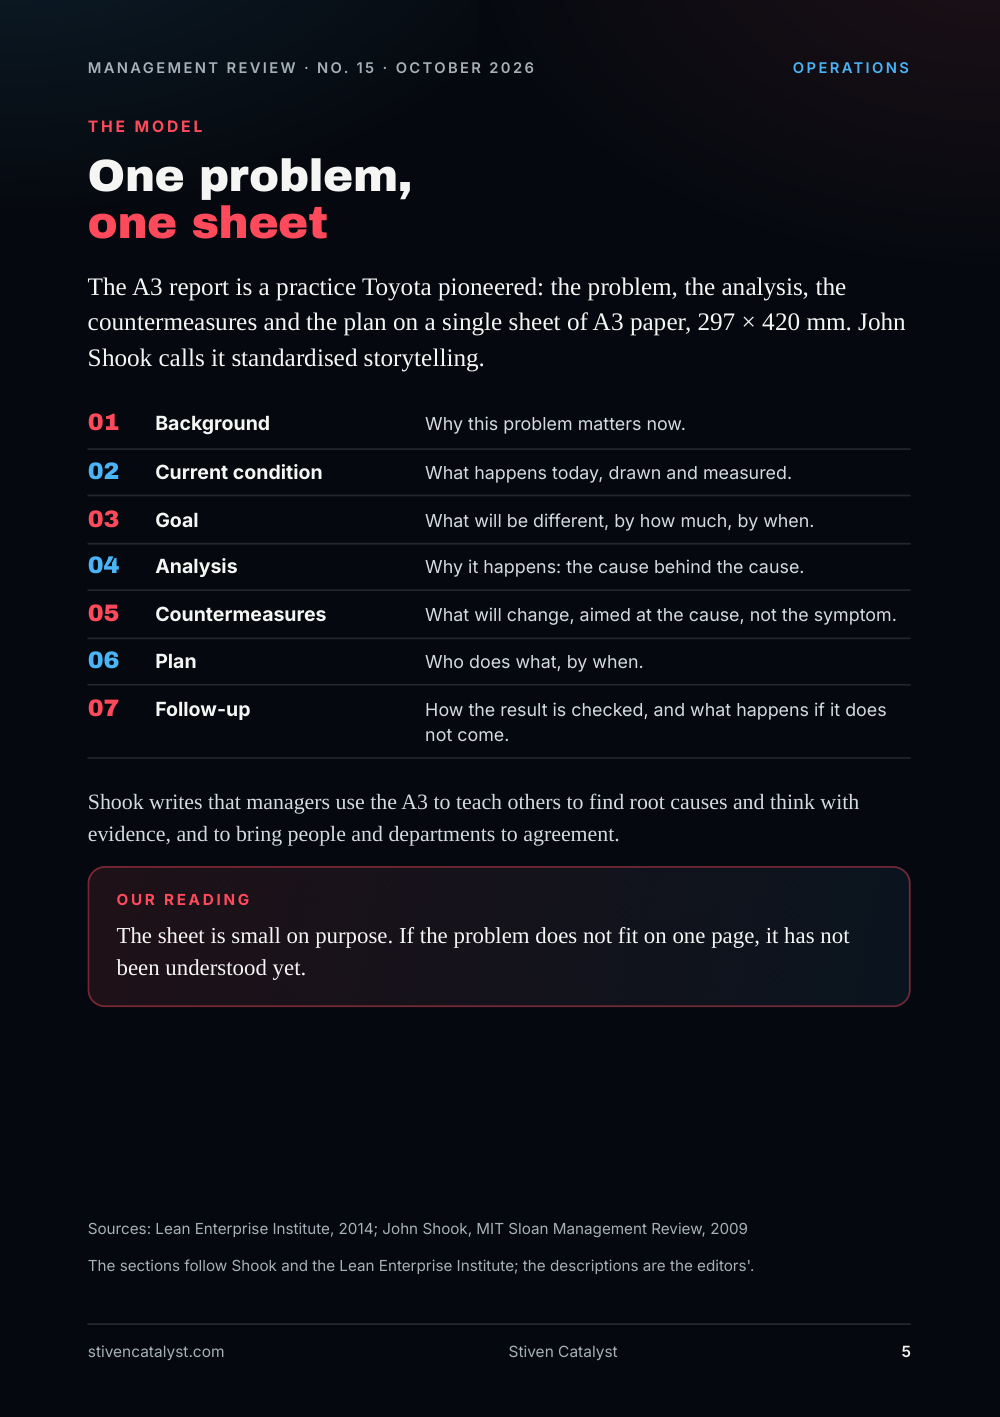
The A3 report is a practice Toyota pioneered: the problem, the analysis, the countermeasures and the plan on a single sheet of A3 paper, 297 × 420 mm. John Shook calls it standardised storytelling.
- Background. Why this problem matters now.
- Current condition. What happens today, drawn and measured.
- Goal. What will be different, by how much, by when.
- Analysis. Why it happens: the cause behind the cause.
- Countermeasures. What will change, aimed at the cause, not the symptom.
- Plan. Who does what, by when.
- Follow-up. How the result is checked, and what happens if it does not come.
Shook writes that managers use the A3 to teach others to find root causes and think with evidence, and to bring people and departments to agreement.
Our reading
The sheet is small on purpose. If the problem does not fit on one page, it has not been understood yet.
The sections follow Shook and the Lean Enterprise Institute; the descriptions are the editors'.
Sources: Lean Enterprise Institute, 2014; John Shook, MIT Sloan Management Review, 2009
How it is applied
Eight steps and a check
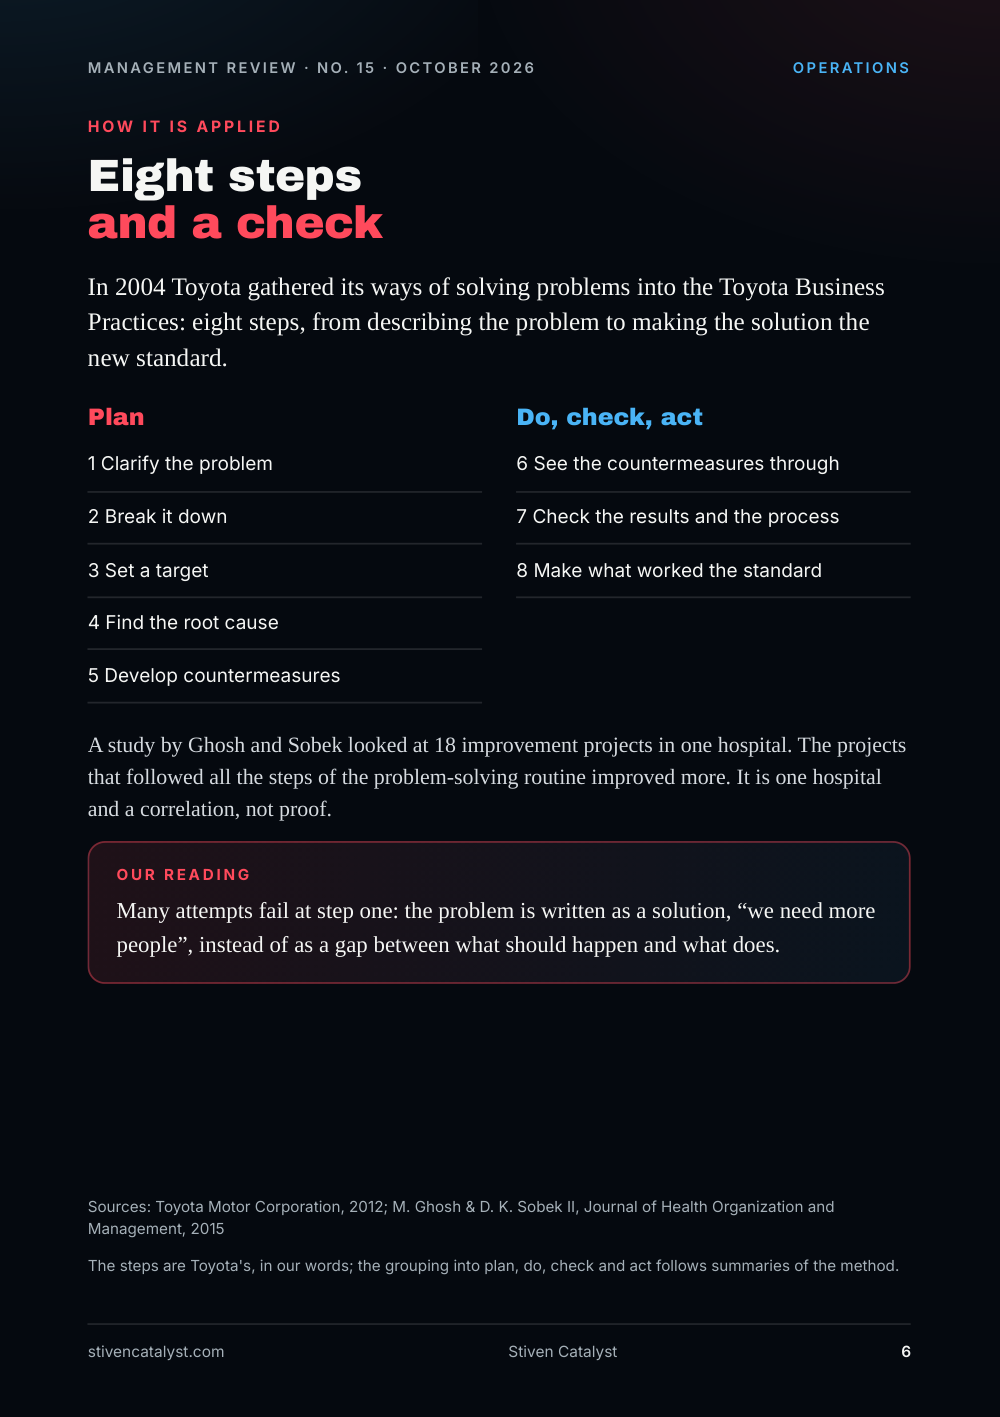
In 2004 Toyota gathered its ways of solving problems into the Toyota Business Practices: eight steps, from describing the problem to making the solution the new standard.
Plan
- 1 Clarify the problem
- 2 Break it down
- 3 Set a target
- 4 Find the root cause
- 5 Develop countermeasures
Do, check, act
- 6 See the countermeasures through
- 7 Check the results and the process
- 8 Make what worked the standard
A study by Ghosh and Sobek looked at 18 improvement projects in one hospital. The projects that followed all the steps of the problem-solving routine improved more. It is one hospital and a correlation, not proof.
Our reading
Many attempts fail at step one: the problem is written as a solution, “we need more people”, instead of as a gap between what should happen and what does.
The steps are Toyota's, in our words; the grouping into plan, do, check and act follows summaries of the method.
Sources: Toyota Motor Corporation, 2012; M. Ghosh & D. K. Sobek II, Journal of Health Organization and Management, 2015
How it is measured
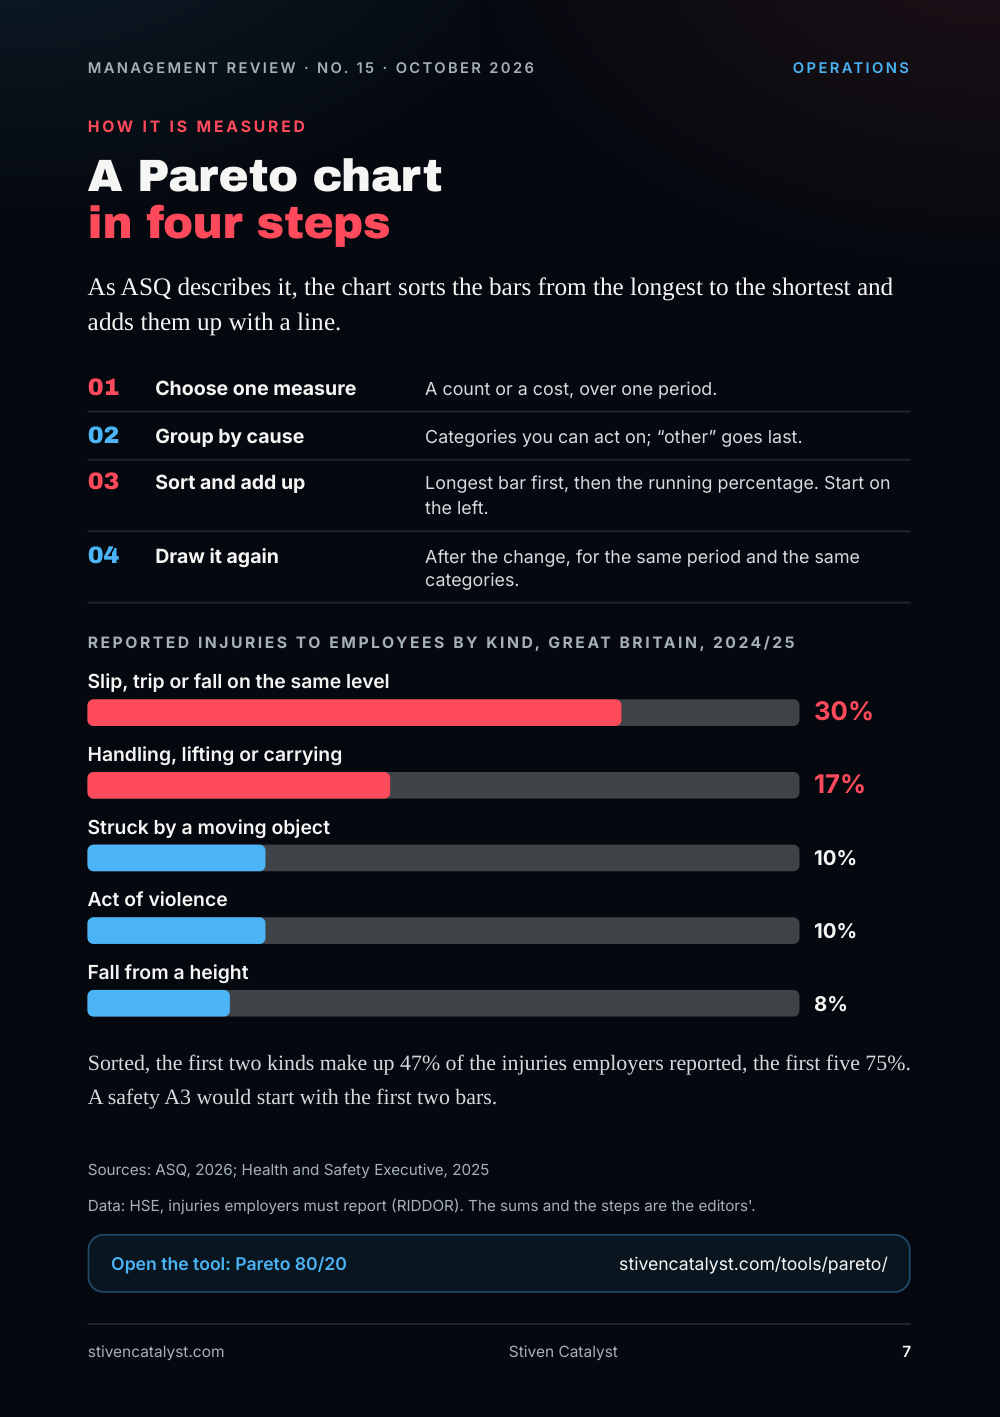
A Pare t o char t in four steps
As ASQ describes it, the chart sorts the bars from the longest to the shortest and adds them up with a line.
- Choose one measure. A count or a cost, over one period.
- Group by cause. Categories you can act on; “other” goes last.
- So
r t and add up. Longest bar first, then the running percentage. Start on the left. - Draw it again. After the change, for the same period and the same categories.
Reported injuries to employees by kind, Great Britain, 2024/25: Slip, trip or fall on the same level 30%, Handling, lifting or carrying 17%, Struck by a moving object 10%, Act of violence 10%, Fall from a height 8%.
Sorted, the first two kinds make up 47% of the injuries employers reported, the first five 75%. A safety A3 would start with the first two bars.
Data: HSE, injuries employers must report (RIDDOR). The sums and the steps are the editors'.
Sources: ASQ, 2026; Health and Safety Executive, 2025
Open the tool: Pareto 80/20
Tool of the week
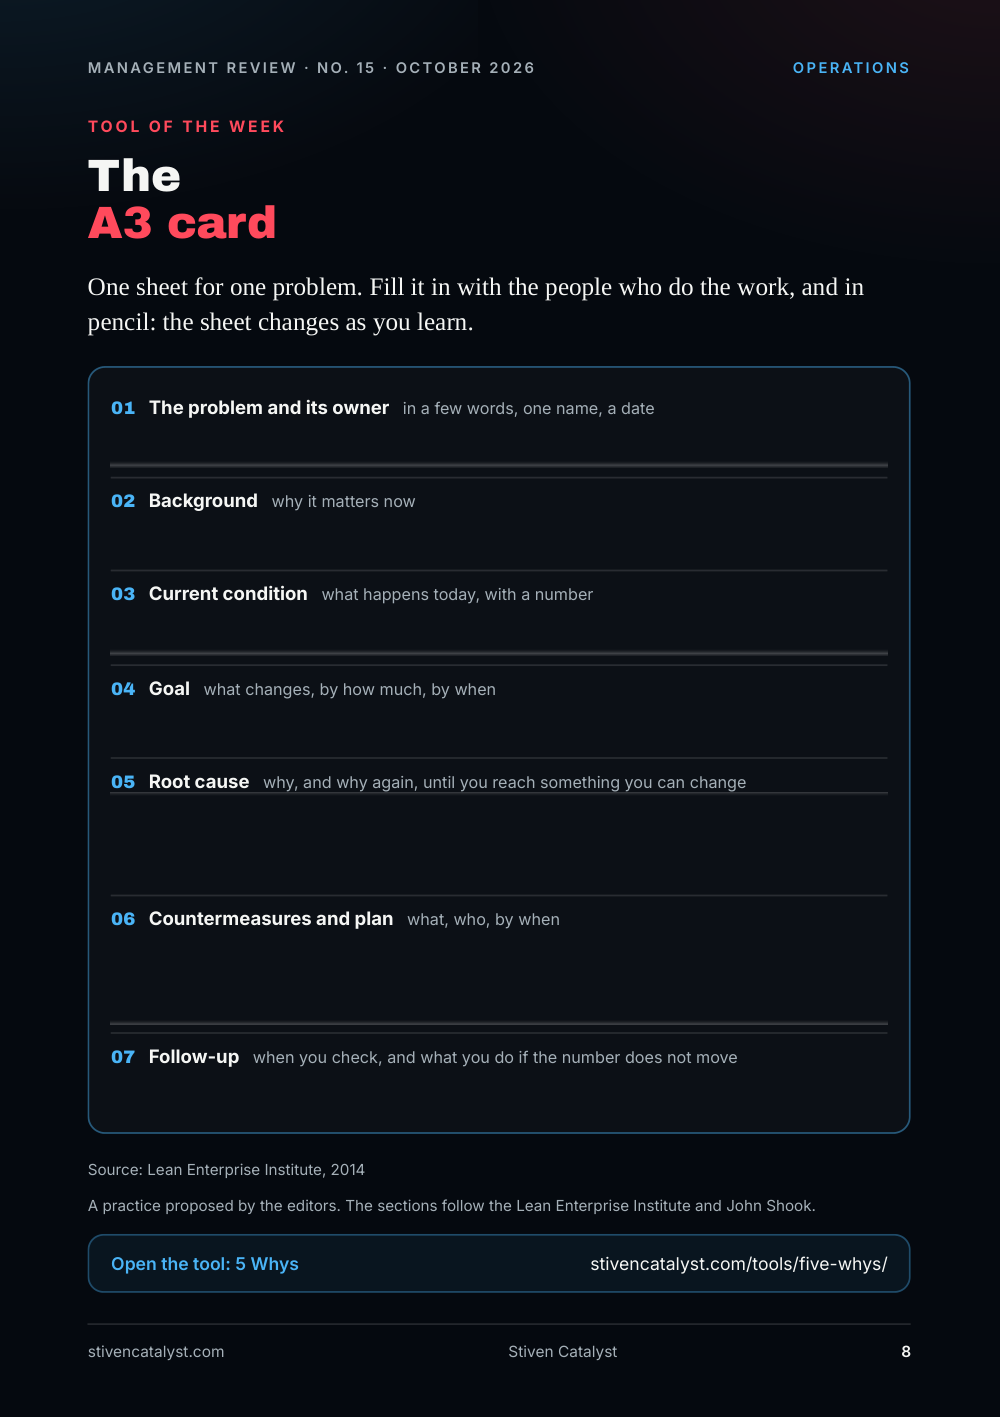
The A3 card
One sheet for one problem. Fill it in with the people who do the work, and in pencil: the sheet changes as you learn.
- The problem and its owner in a few words, one name, a date
- Background why it matters now
- Current condition what happens today, with a number
- Goal what changes, by how much, by when
- Root cause why, and why again, until you reach something you can change
- Countermeasures and plan what, who, by when
- Follow-up when you check, and what you do if the number does not move
A practice proposed by the editors. The sections follow the Lean Enterprise Institute and John Shook.
Source: Lean Enterprise Institute, 2014
Open the tool: 5 Whys
Sources and method
Every figure has a source.
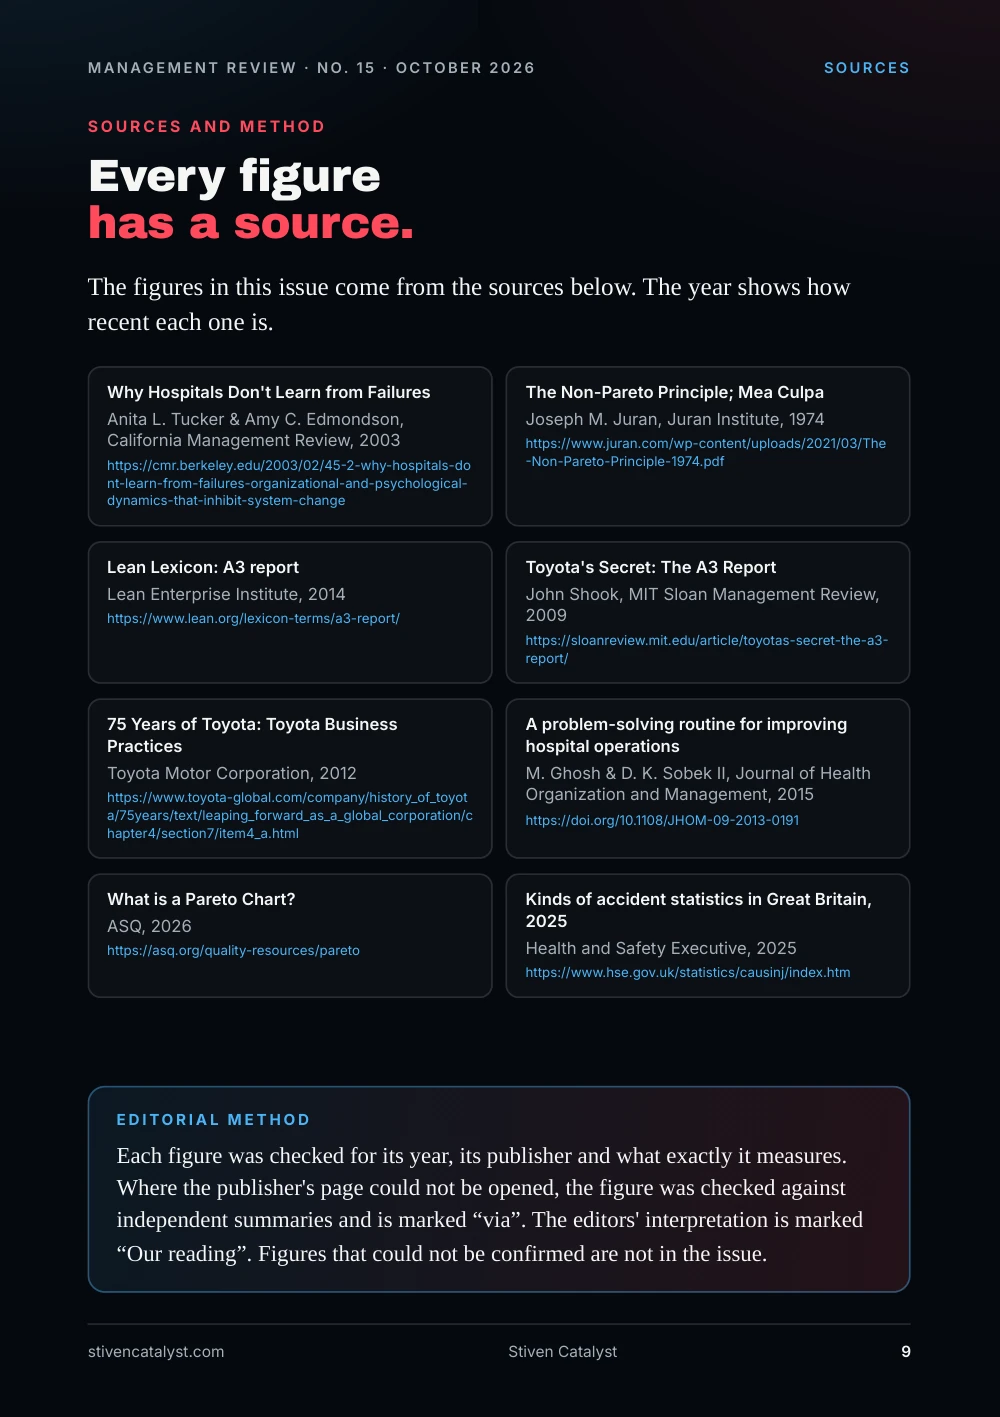
The figures in this issue come from the sources below. The year shows how recent each one is.
- Anita L. Tucker & Amy C. Edmondson, California Management Review, “Why Hospitals Don't Learn from Failures”, 2003. https://cmr.berkeley.edu/2003/02/45-2-why-hospitals-dont-learn-from-failures-organizational-and-psychological-dynamics-that-inhibit-system-change
- Joseph M. Juran, Juran Institute, “The Non-Pareto Principle; Mea Culpa”, 1974. https://www.juran.com/wp-content/uploads/2021/03/The-Non-Pareto-Principle-1974.pdf
- Lean Enterprise Institute, “Lean Lexicon: A3 report”, 2014. https://www.lean.org/lexicon-terms/a3-report/
- John Shook, MIT Sloan Management Review, “Toyota's Secret: The A3 Report”, 2009. https://sloanreview.mit.edu/article/toyotas-secret-the-a3-report/
- Toyota Motor Corporation, “75 Years of Toyota: Toyota Business Practices”, 2012. https://www.toyota-global.com/company/history_of_toyota/75years/text/leaping_forward_as_a_global_corporation/chapter4/section7/item4_a.html
- M. Ghosh & D. K. Sobek II, Journal of Health Organization and Management, “A problem-solving routine for improving hospital operations”, 2015. https://doi.org/10.1108/JHOM-09-2013-0191
- ASQ, “What is a Pareto Chart?”, 2026. https://asq.org/quality-resources/pareto
- Health and Safety Executive, “Kinds of accident statistics in Great Britain, 2025”, 2025. https://www.hse.gov.uk/statistics/causinj/index.htm
Edit orial me thod
Each figure was checked for its year, its publisher and what exactly it measures. Where the publisher's page could not be opened, the figure was checked against independent summaries and is marked “via”. The editors' interpretation is marked “Our reading”. Figures that could not be confirmed are not in the issue.