
In this issue
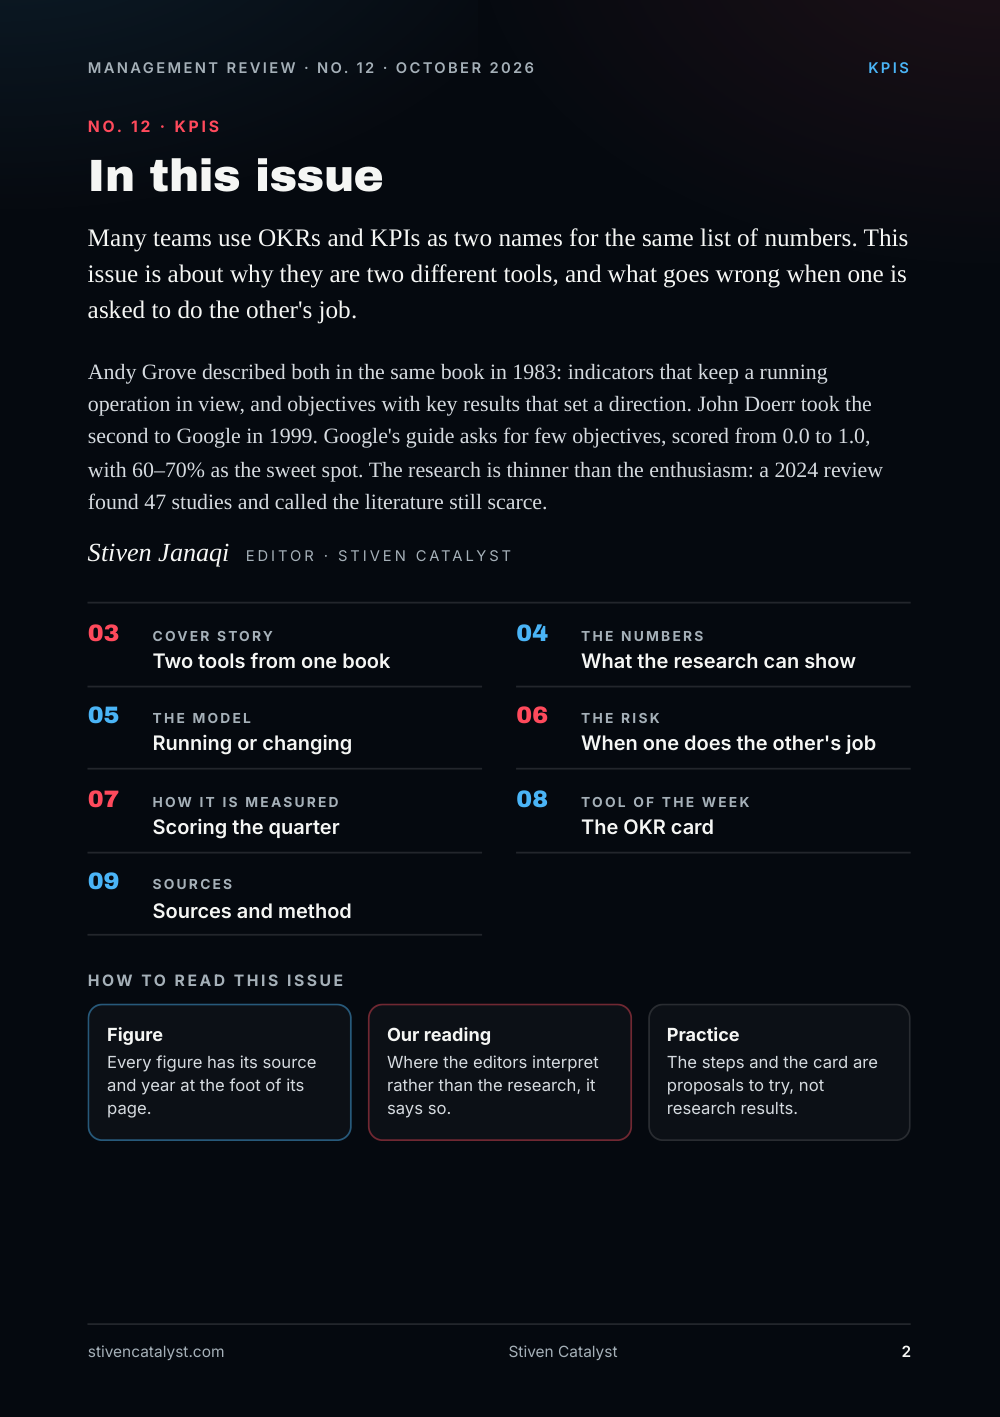
Many teams use OKRs and KPIs as two names for the same list of numbers. This issue is about why they are two different tools, and what goes wrong when one is asked to do the other's job.
Andy Grove described both in the same book in 1983: indicators that keep a running operation in view, and objectives with key results that set a direction. John Doerr took the second to Google in 1999. Google's guide asks for few objectives, scored from 0.0 to 1.0, with 60–70% as the sweet spot. The research is thinner than the enthusiasm: a 2024 review found 47 studies and called the literature still scarce.
Stiven Janaqi, Editor
Cover story
Two t ools from one book
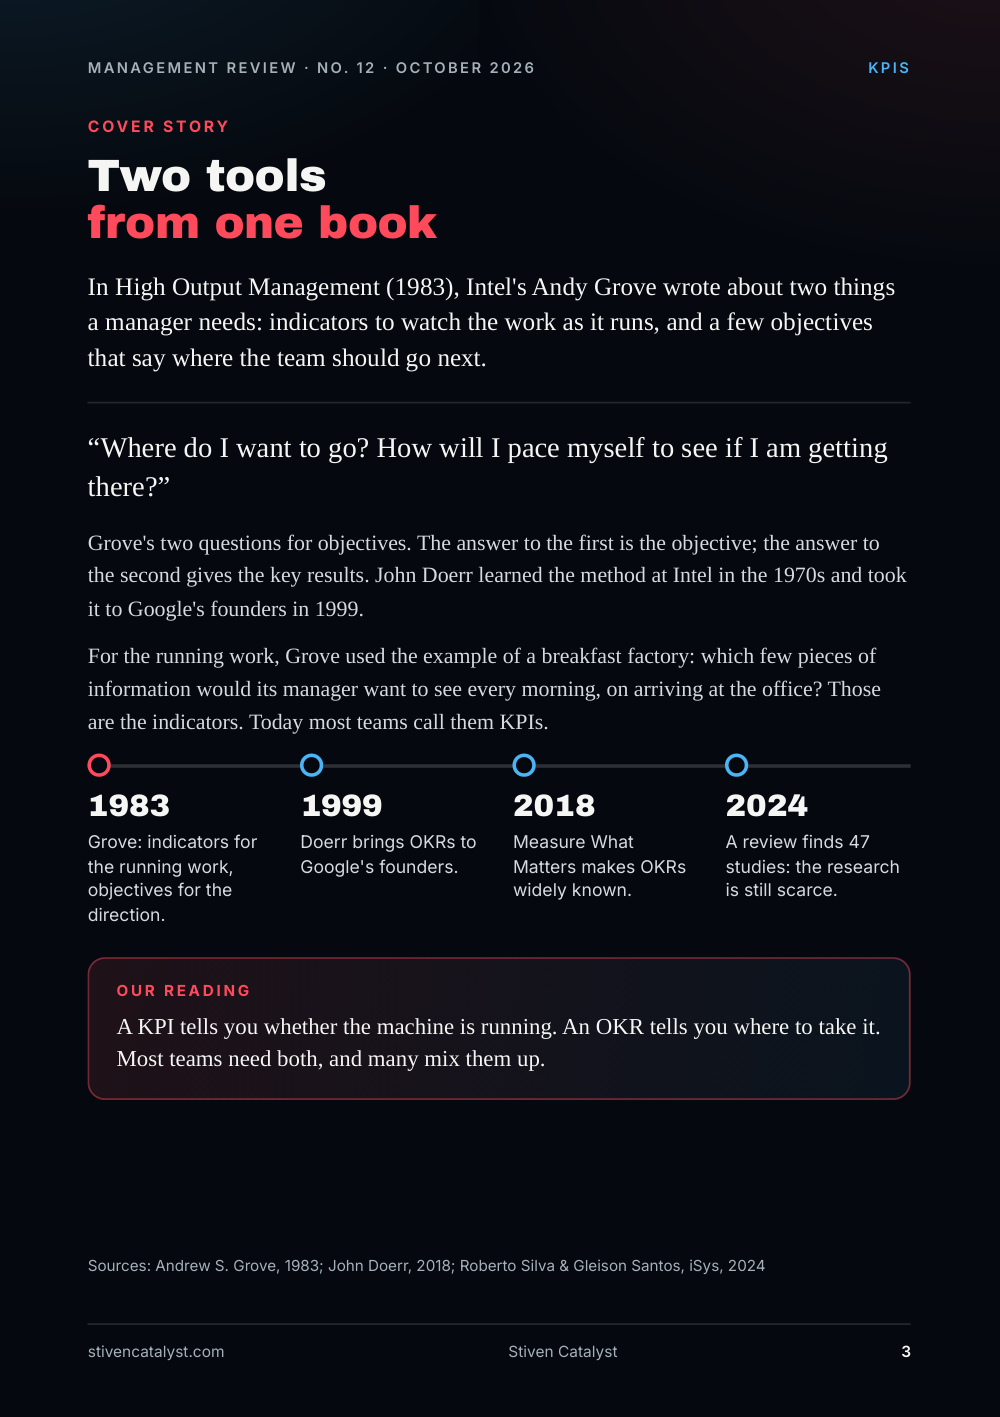
In High Output Management (1983), Intel's Andy Grove wrote about two things a manager needs: indicators to watch the work as it runs, and a few objectives that say where the team should go next.
Where do I want to go? How will I pace myself to see if I am getting there?
Grove's two questions for objectives. The answer to the first is the objective; the answer to the second gives the key results. John Doerr learned the method at Intel in the 1970s and took it to Google's founders in 1999.
For the running work, Grove used the example of a breakfast factory: which few pieces of information would its manager want to see every morning, on arriving at the office? Those are the indicators. Today most teams call them KPIs.
- 1983 Grove: indicators for the running work, objectives for the direction.
- 1999 Doerr brings OKRs to Google's founders.
- 2018 Measure What Matters makes OKRs widely known.
- 2024 A review finds 47 studies: the research is still scarce.
Our reading
A KPI tells you whether the machine is running. An OKR tells you where to take it. Most teams need both, and many mix them up.
Sources: Andrew S. Grove, 1983; John Doerr, 2018; Roberto Silva & Gleison Santos, iSys, 2024
The numbers
What the research can show
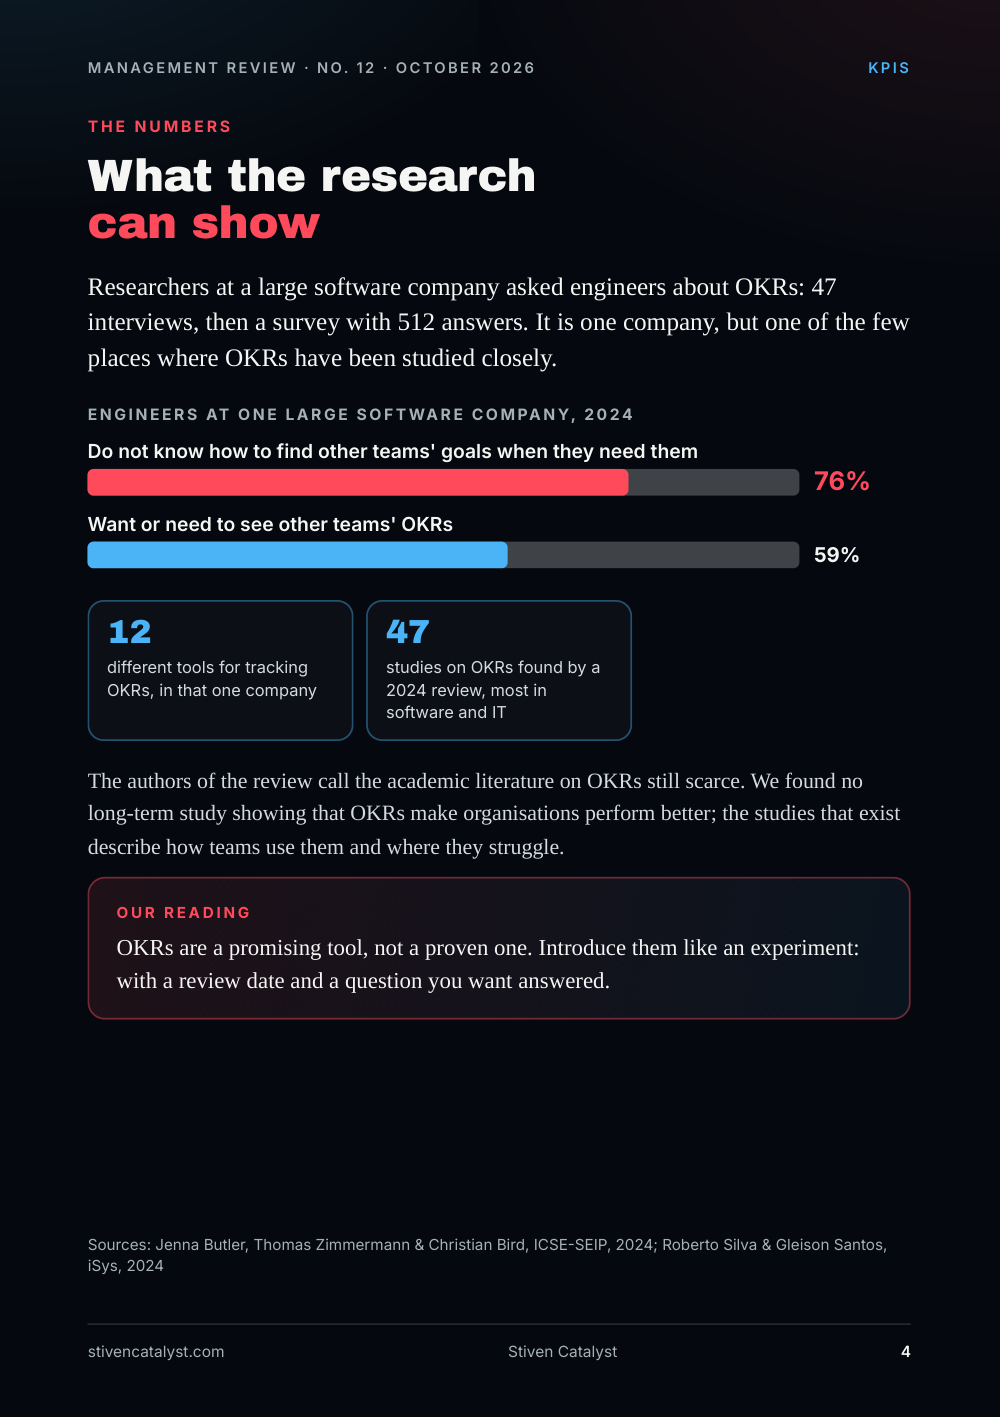
Researchers at a large software company asked engineers about OKRs: 47 interviews, then a survey with 512 answers. It is one company, but one of the few places where OKRs have been studied closely.
Engineers at one large software company, 2024: Do not know how to find other teams' goals when they need them 76%, Want or need to see other teams' OKRs 59%.
- 12 different tools for tracking OKRs, in that one company
- 47 studies on OKRs found by a 2024 review, most in software and IT
The authors of the review call the academic literature on OKRs still scarce. We found no long-term study showing that OKRs make organisations perform better; the studies that exist describe how teams use them and where they struggle.
Our reading
OKRs are a promising tool, not a proven one. Introduce them like an experiment: with a review date and a question you want answered.
Sources: Jenna Butler, Thomas Zimmermann & Christian Bird, ICSE-SEIP, 2024; Roberto Silva & Gleison Santos, iSys, 2024
The model
Running or changing
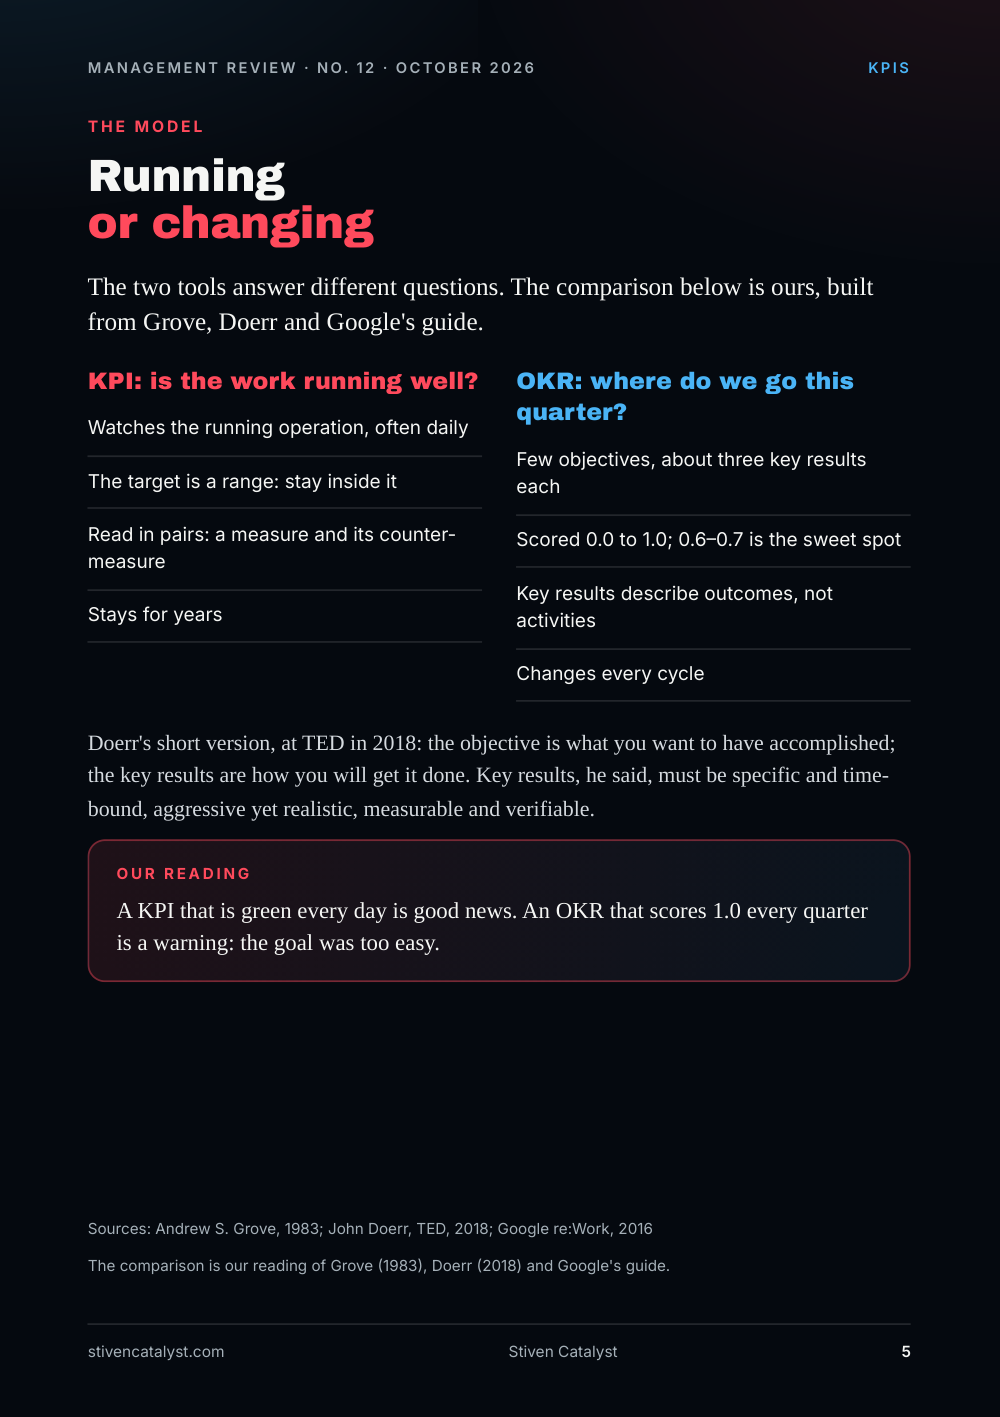
The two tools answer different questions. The comparison below is ours, built from Grove, Doerr and Google's guide.
KPI: is the work running well?
- Watches the running operation, often daily
- The target is a range: stay inside it
- Read in pairs: a measure and its counter-measure
- Stays for years
OKR: where do we go this quar ter?
- Few objectives, about three key results each
- Scored 0.0 to 1.0; 0.6–0.7 is the sweet spot
- Key results describe outcomes, not activities
- Changes every cycle
Doerr's short version, at TED in 2018: the objective is what you want to have accomplished; the key results are how you will get it done. Key results, he said, must be specific and time-bound, aggressive yet realistic, measurable and verifiable.
Our reading
A KPI that is green every day is good news. An OKR that scores 1.0 every quarter is a warning: the goal was too easy.
The comparison is our reading of Grove (1983), Doerr (2018) and Google's guide.
Sources: Andrew S. Grove, 1983; John Doerr, TED, 2018; Google re:Work, 2016
The risk
When one does the other's job
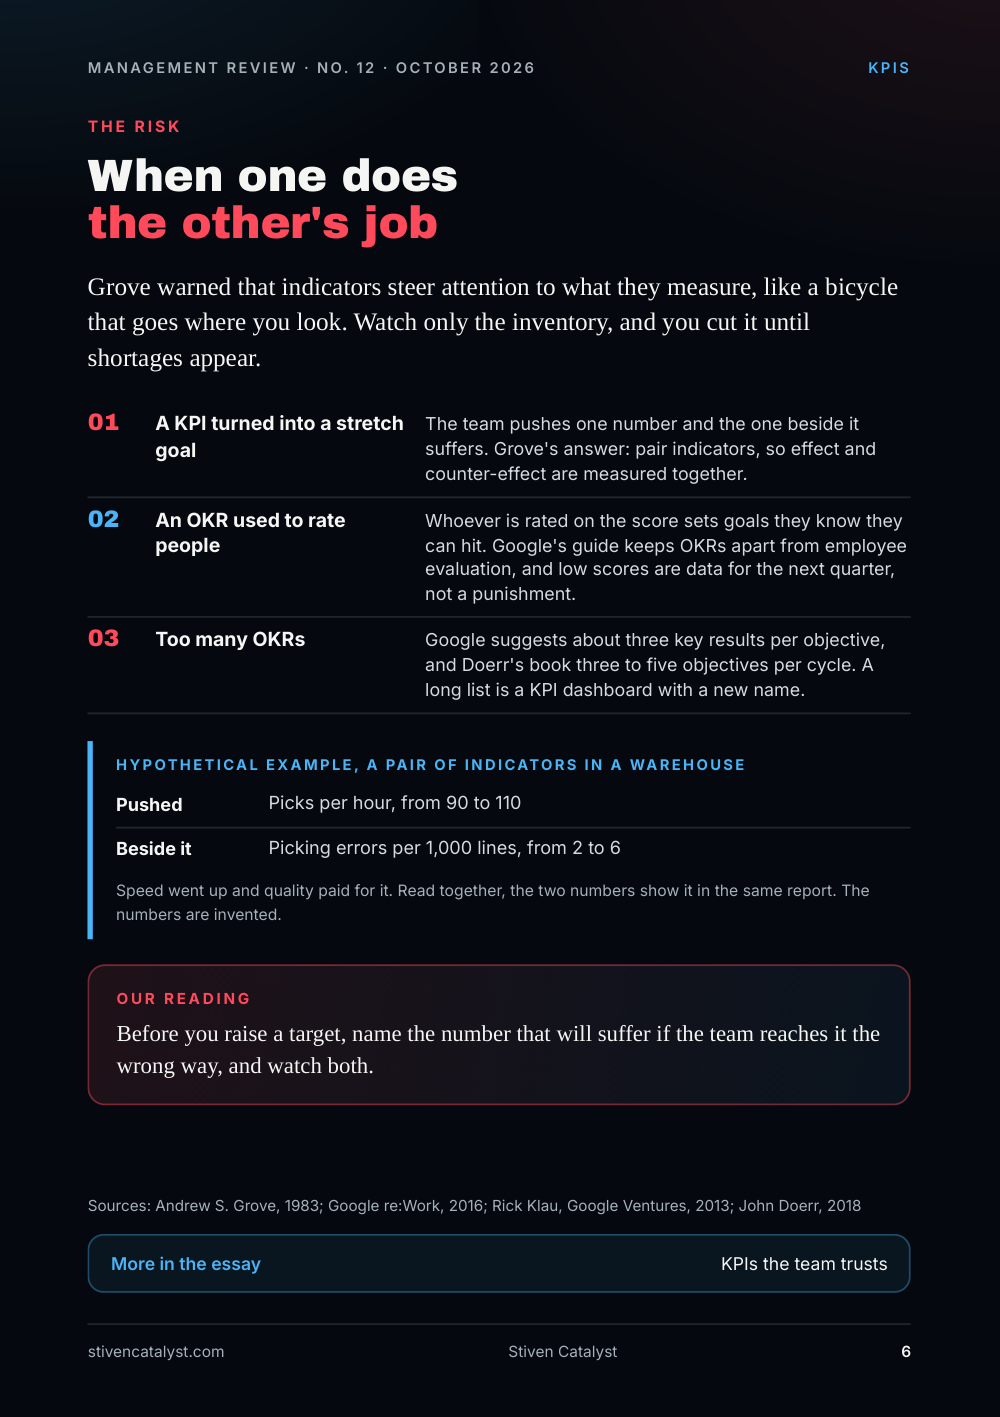
Grove warned that indicators steer attention to what they measure, like a bicycle that goes where you look. Watch only the inventory, and you cut it until shortages appear.
- A KPI turned in
t o a stre t ch goal. The team pushes one number and the one beside it suffers. Grove's answer: pair indicators, so effect and counter-effect are measured together. - An OKR used
t o rate people. Whoever is rated on the score sets goals they know they can hit. Google's guide keeps OKRs apart from employee evaluation, and low scores are data for the next quarter, not a punishment. T oo many OKRs. Google suggests about three key results per objective, and Doerr's book three to five objectives per cycle. A long list is a KPI dashboard with a new name.
Hypothe tical example, a pair of indicat ors in a warehouse
- Pushed: Picks per hour, from 90 to 110
- Beside it: Picking errors per 1,000 lines, from 2 to 6
Speed went up and quality paid for it. Read together, the two numbers show it in the same report. The numbers are invented.
Our reading
Before you raise a target, name the number that will suffer if the team reaches it the wrong way, and watch both.
Sources: Andrew S. Grove, 1983; Google re:Work, 2016; Rick Klau, Google Ventures, 2013; John Doerr, 2018
More in the essay: KPIs the team trusts
How it is measured
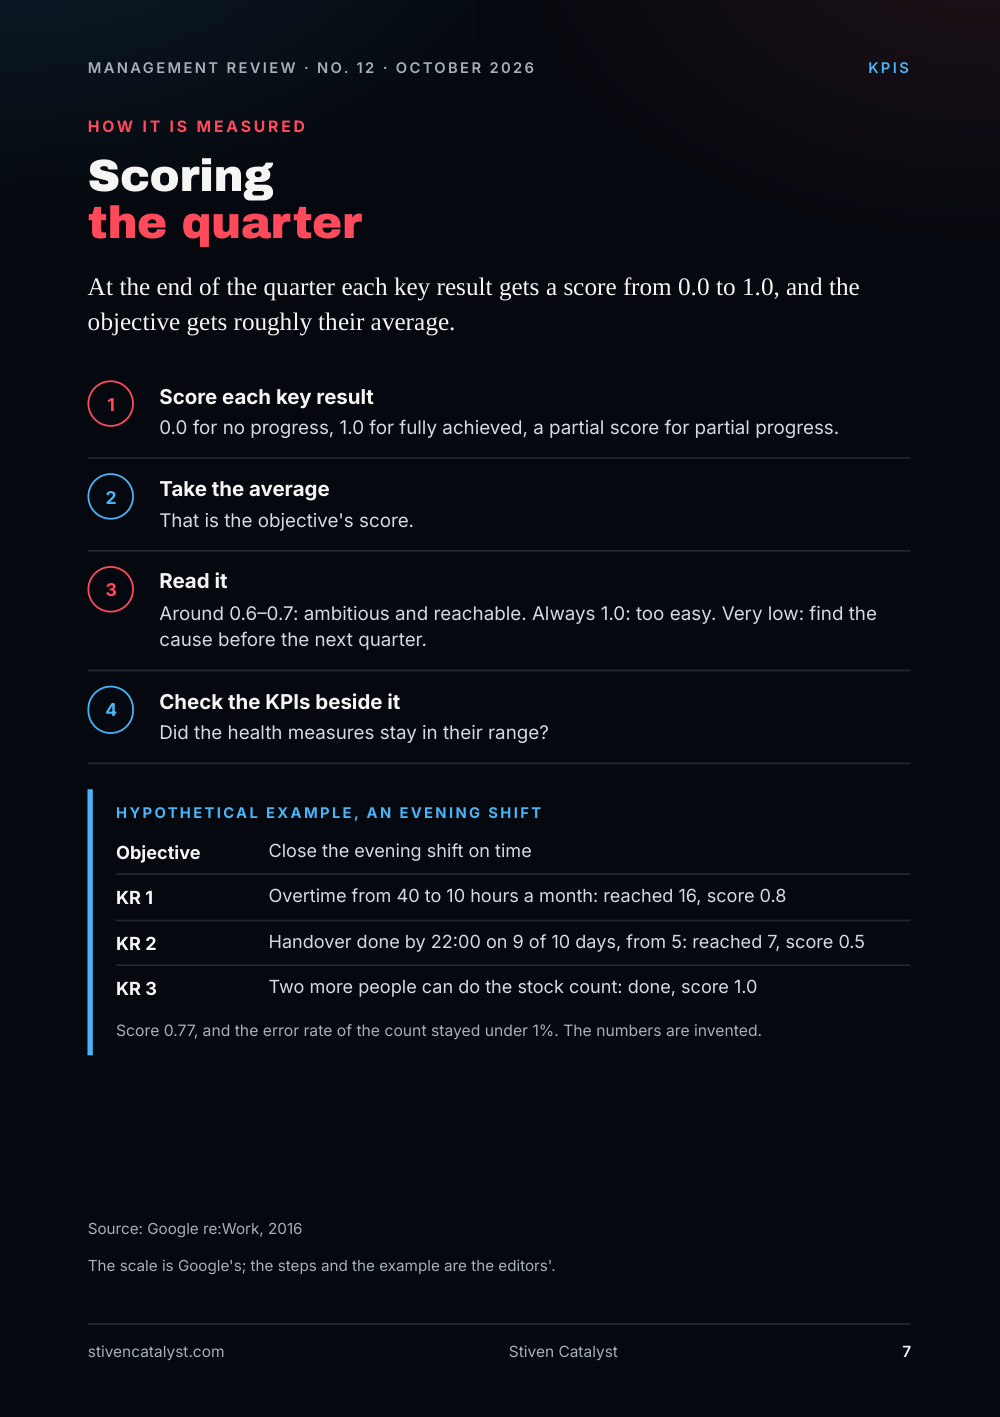
Scoring the quar ter
At the end of the quarter each key result gets a score from 0.0 to 1.0, and the objective gets roughly their average.
- Score each k
e y result. 0.0 for no progress, 1.0 for fully achieved, a partial score for partial progress. - Take the average. That is the objective's score.
- Read it. Around 0.6–0.7: ambitious and reachable. Always 1.0: too easy. Very low: find the cause before the next quarter.
- Check the KPIs beside it. Did the health measures stay in their range?
Hypothe tical example, an evening shif t
- Objective: Close the evening shift on time
- KR 1: Overtime from 40 to 10 hours a month: reached 16, score 0.8
- KR 2: Handover done by 22:00 on 9 of 10 days, from 5: reached 7, score 0.5
- KR 3: Two more people can do the stock count: done, score 1.0
Score 0.77, and the error rate of the count stayed under 1%. The numbers are invented.
The scale is Google's; the steps and the example are the editors'.
Source: Google re:Work, 2016
Tool of the week
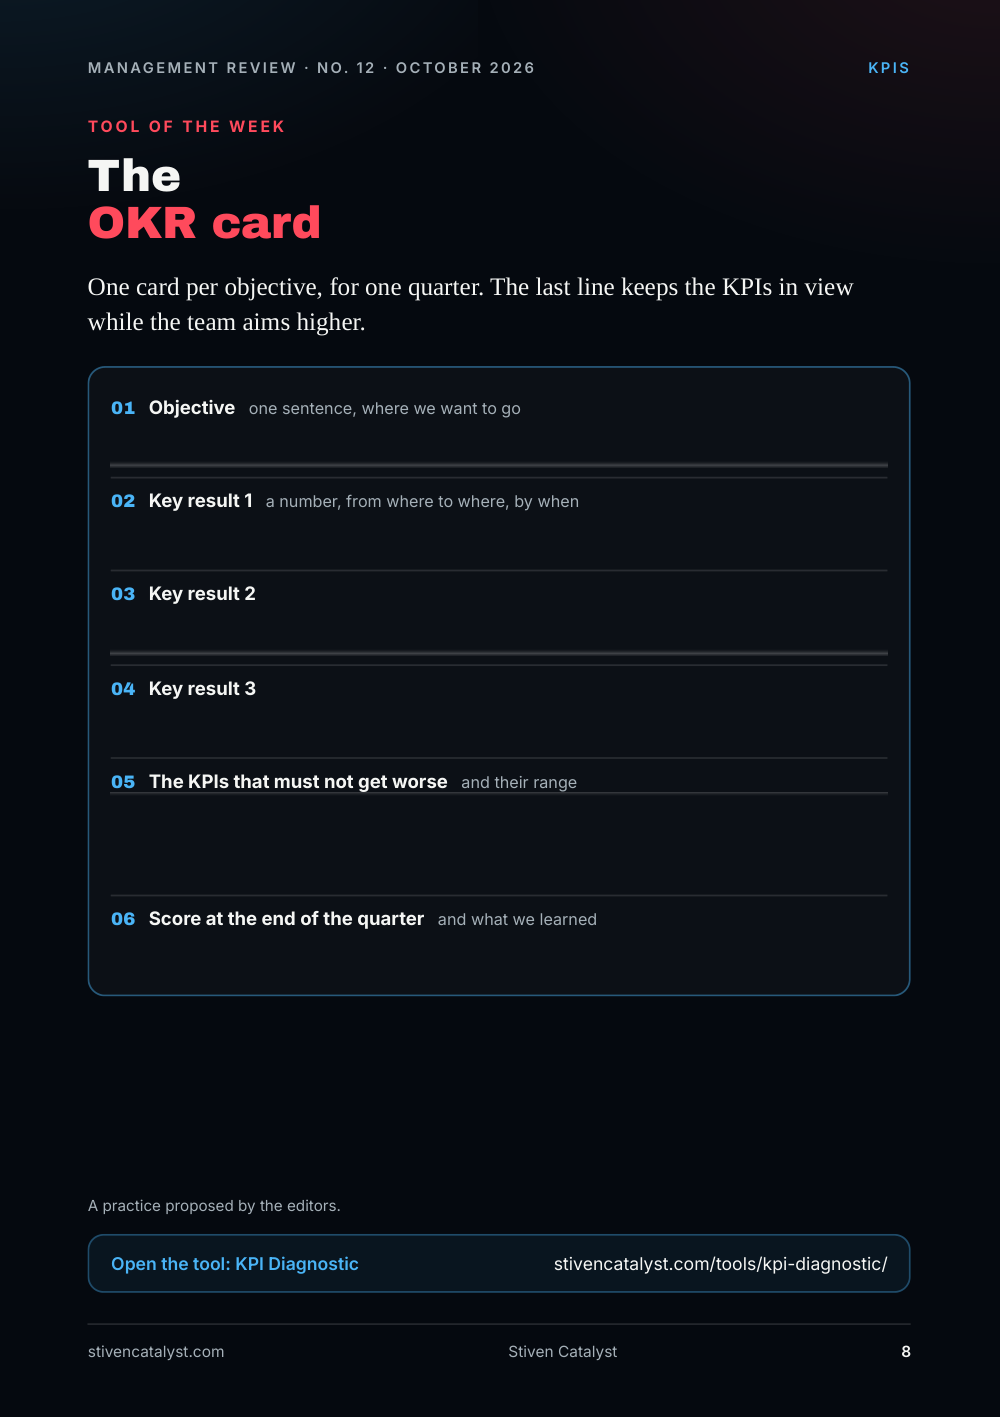
The OKR card
One card per objective, for one quarter. The last line keeps the KPIs in view while the team aims higher.
- Objective one sentence, where we want to go
- K
e y result 1 a number, from where to where, by when - K
e y result 2 - K
e y result 3 - The KPIs that must not g
e t worse and their range - Score at the end of the qua
r ter and what we learned
A practice proposed by the editors.
Open the tool: KPI Diagnostic
Sources and method
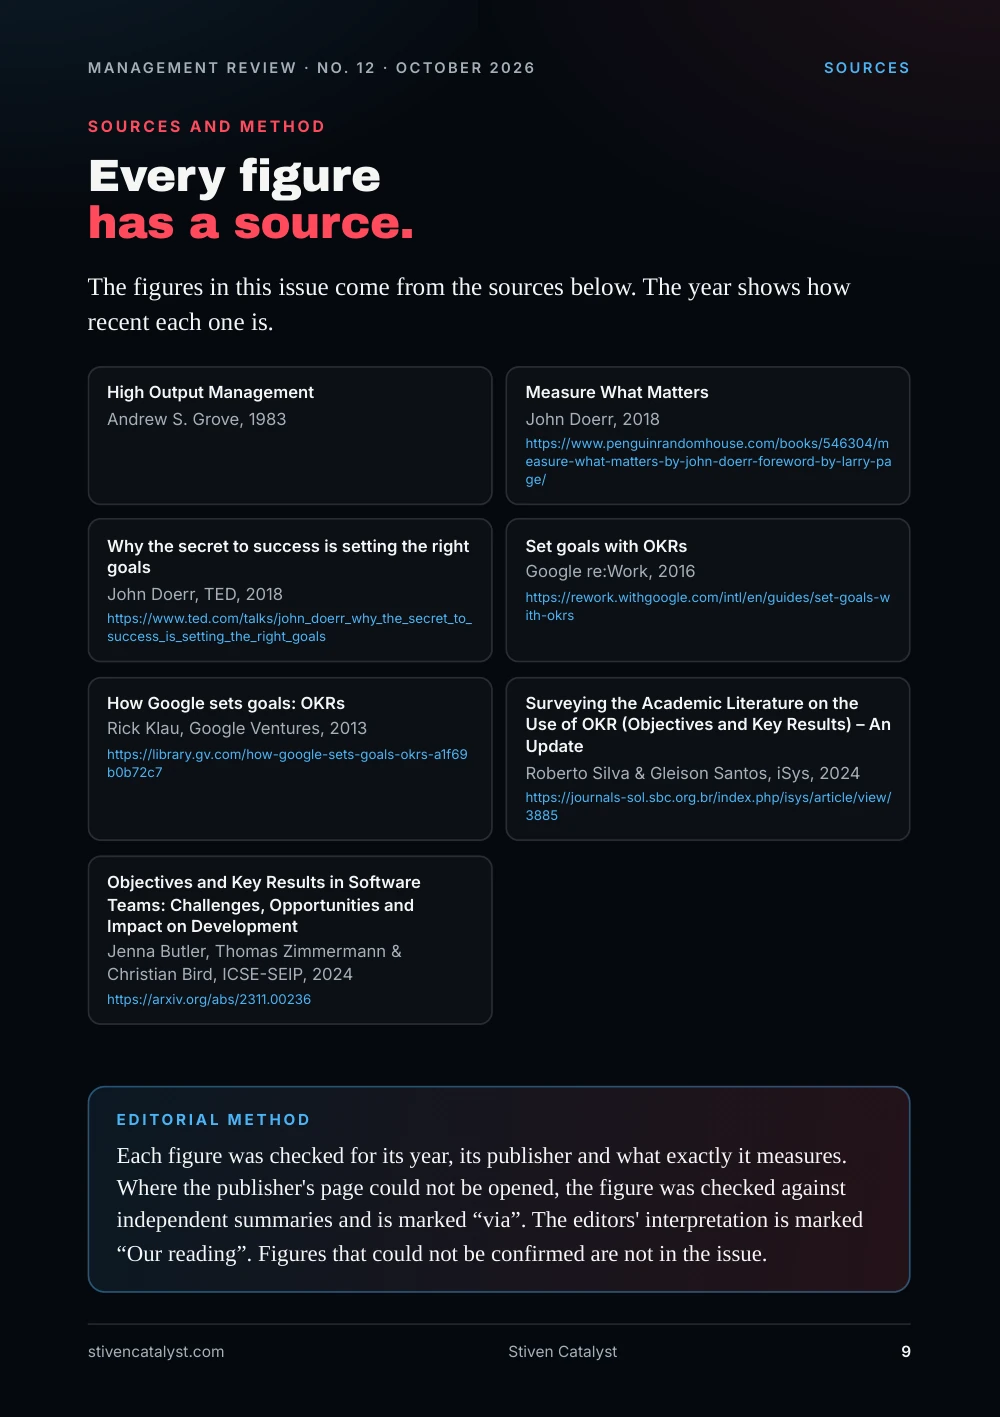
Every figure has a source.
The figures in this issue come from the sources below. The year shows how recent each one is.
- Andrew S. Grove, “High Output Management”, 1983.
- John Doerr, “Measure What Matters”, 2018. https://www.penguinrandomhouse.com/books/546304/measure-what-matters-by-john-doerr-foreword-by-larry-page/
- John Doerr, TED, “Why the secret to success is setting the right goals”, 2018. https://www.ted.com/talks/john_doerr_why_the_secret_to_success_is_setting_the_right_goals
- Google re:Work, “Set goals with OKRs”, 2016. https://rework.withgoogle.com/intl/en/guides/set-goals-with-okrs
- Rick Klau, Google Ventures, “How Google sets goals: OKRs”, 2013. https://library.gv.com/how-google-sets-goals-okrs-a1f69b0b72c7
- Roberto Silva & Gleison Santos, iSys, “Surveying the Academic Literature on the Use of OKR (Objectives and Key Results) – An Update”, 2024. https://journals-sol.sbc.org.br/index.php/isys/article/view/3885
- Jenna Butler, Thomas Zimmermann & Christian Bird, ICSE-SEIP, “Objectives and Key Results in Software Teams: Challenges, Opportunities and Impact on Development”, 2024. https://arxiv.org/abs/2311.00236
Edit orial me thod
Each figure was checked for its year, its publisher and what exactly it measures. Where the publisher's page could not be opened, the figure was checked against independent summaries and is marked “via”. The editors' interpretation is marked “Our reading”. Figures that could not be confirmed are not in the issue.