In this issue
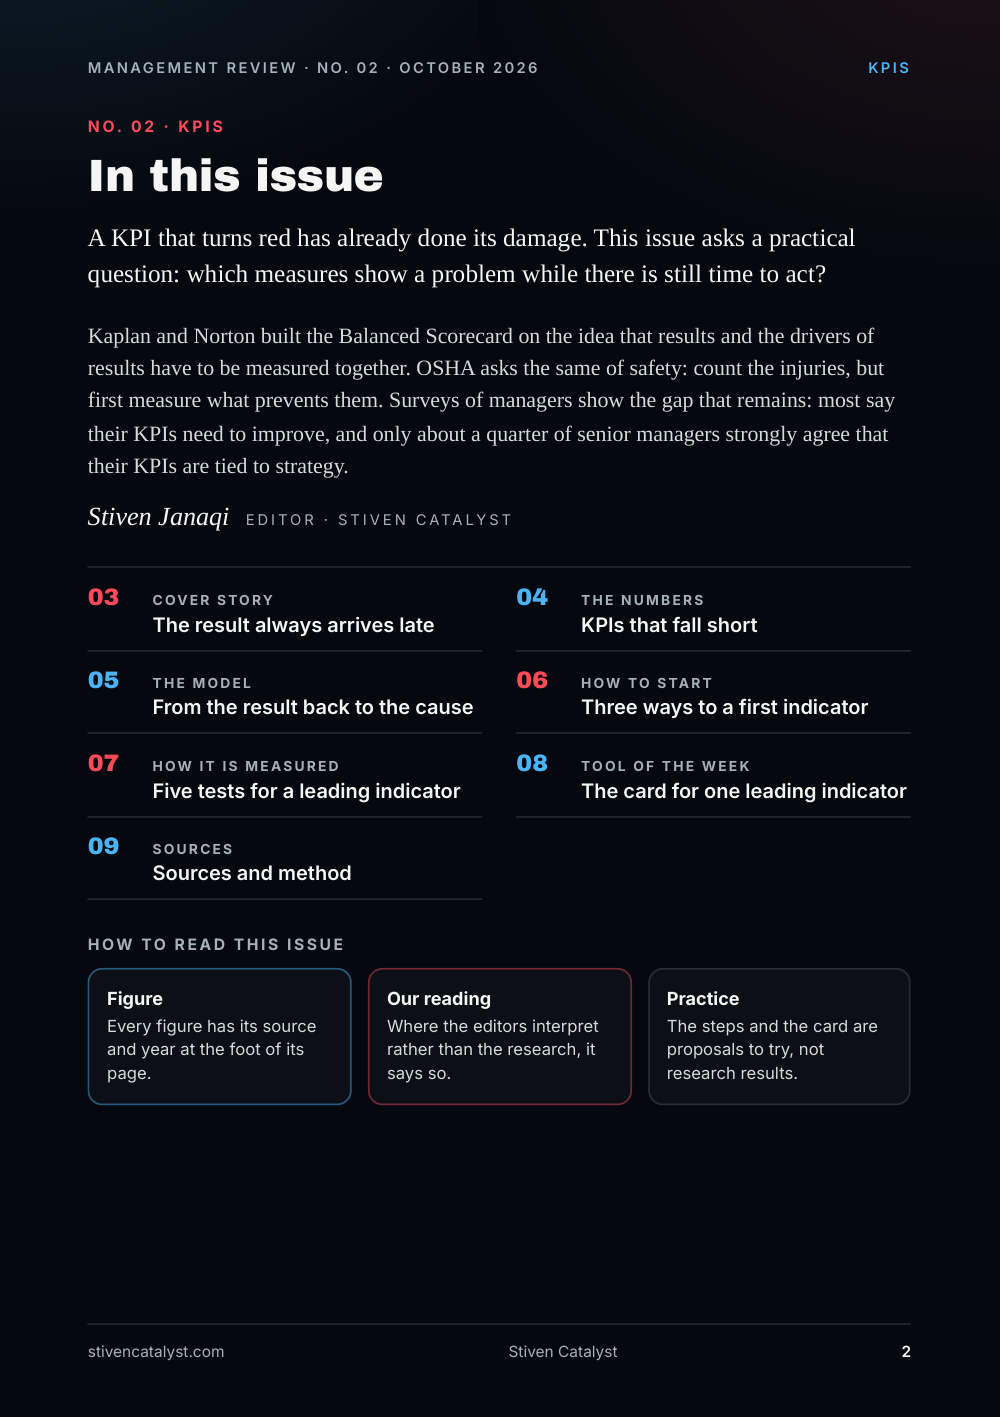
A KPI that turns red has already done its damage. This issue asks a practical question: which measures show a problem while there is still time to act?
Kaplan and Norton built the Balanced Scorecard on the idea that results and the drivers of results have to be measured together. OSHA asks the same of safety: count the injuries, but first measure what prevents them. Surveys of managers show the gap that remains: most say their KPIs need to improve, and only about a quarter of senior managers strongly agree that their KPIs are tied to strategy.
Stiven Janaqi, Editor
Cover story
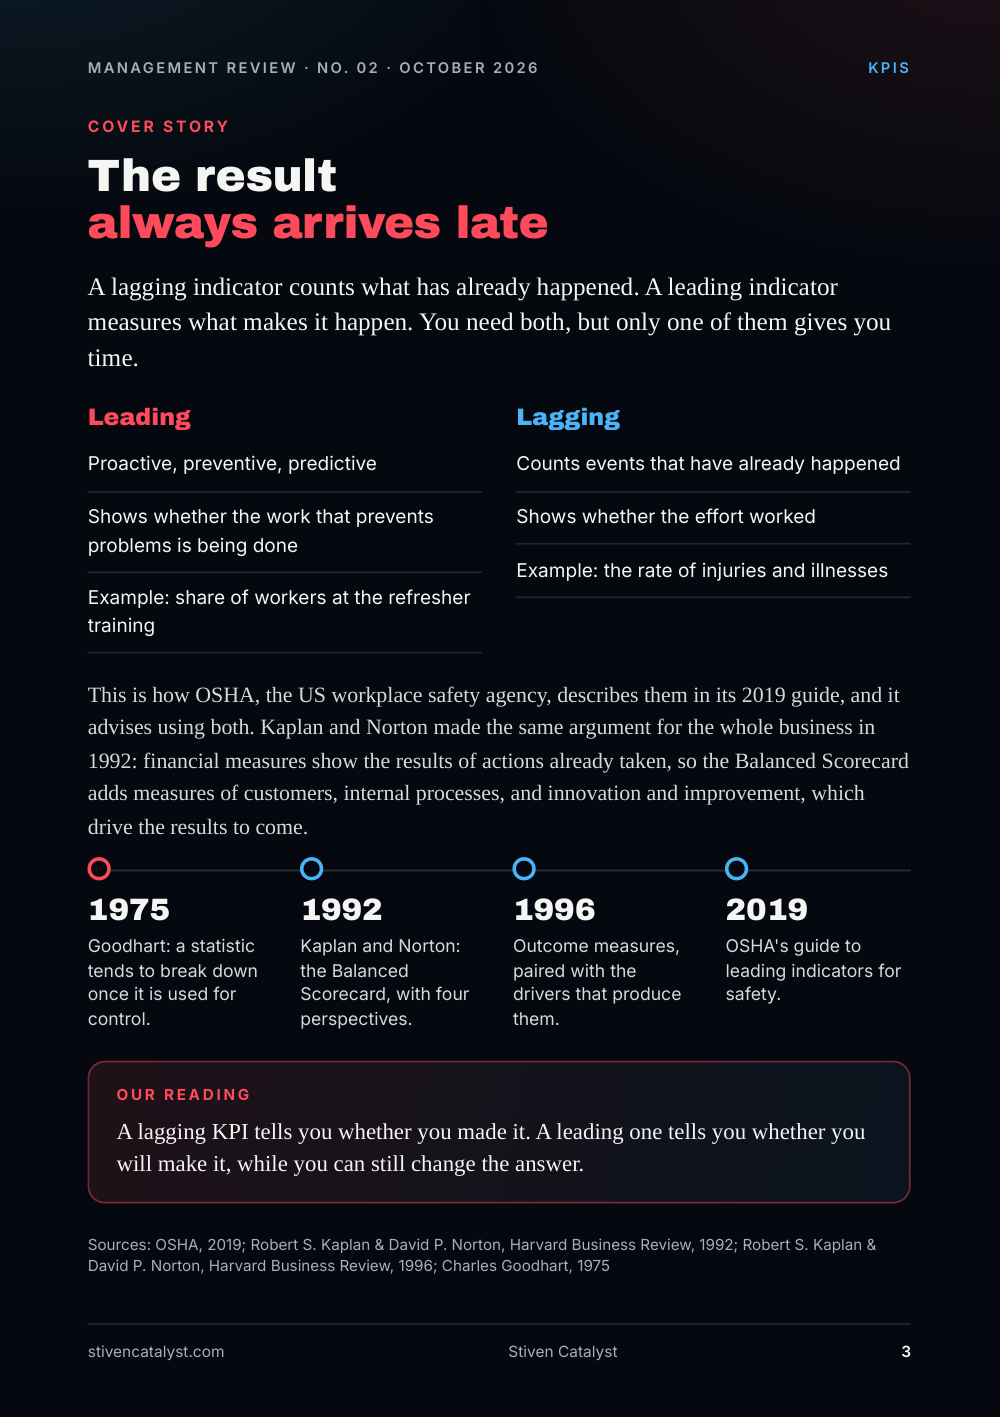
The result always arrives late
A lagging indicator counts what has already happened. A leading indicator measures what makes it happen. You need both, but only one of them gives you time.
Leading
- Proactive, preventive, predictive
- Shows whether the work that prevents problems is being done
- Example: share of workers at the refresher training
Lagging
- Counts events that have already happened
- Shows whether the effort worked
- Example: the rate of injuries and illnesses
This is how OSHA, the US workplace safety agency, describes them in its 2019 guide, and it advises using both. Kaplan and Norton made the same argument for the whole business in 1992: financial measures show the results of actions already taken, so the Balanced Scorecard adds measures of customers, internal processes, and innovation and improvement, which drive the results to come.
- 1975 Goodhart: a statistic tends to break down once it is used for control.
- 1992 Kaplan and Norton: the Balanced Scorecard, with four perspectives.
- 1996 Outcome measures, paired with the drivers that produce them.
- 2019 OSHA's guide to leading indicators for safety.
Our reading
A lagging KPI tells you whether you made it. A leading one tells you whether you will make it, while you can still change the answer.
Sources: OSHA, 2019; Robert S. Kaplan & David P. Norton, Harvard Business Review, 1992; Robert S. Kaplan & David P. Norton, Harvard Business Review, 1996; Charles Goodhart, 1975
The numbers
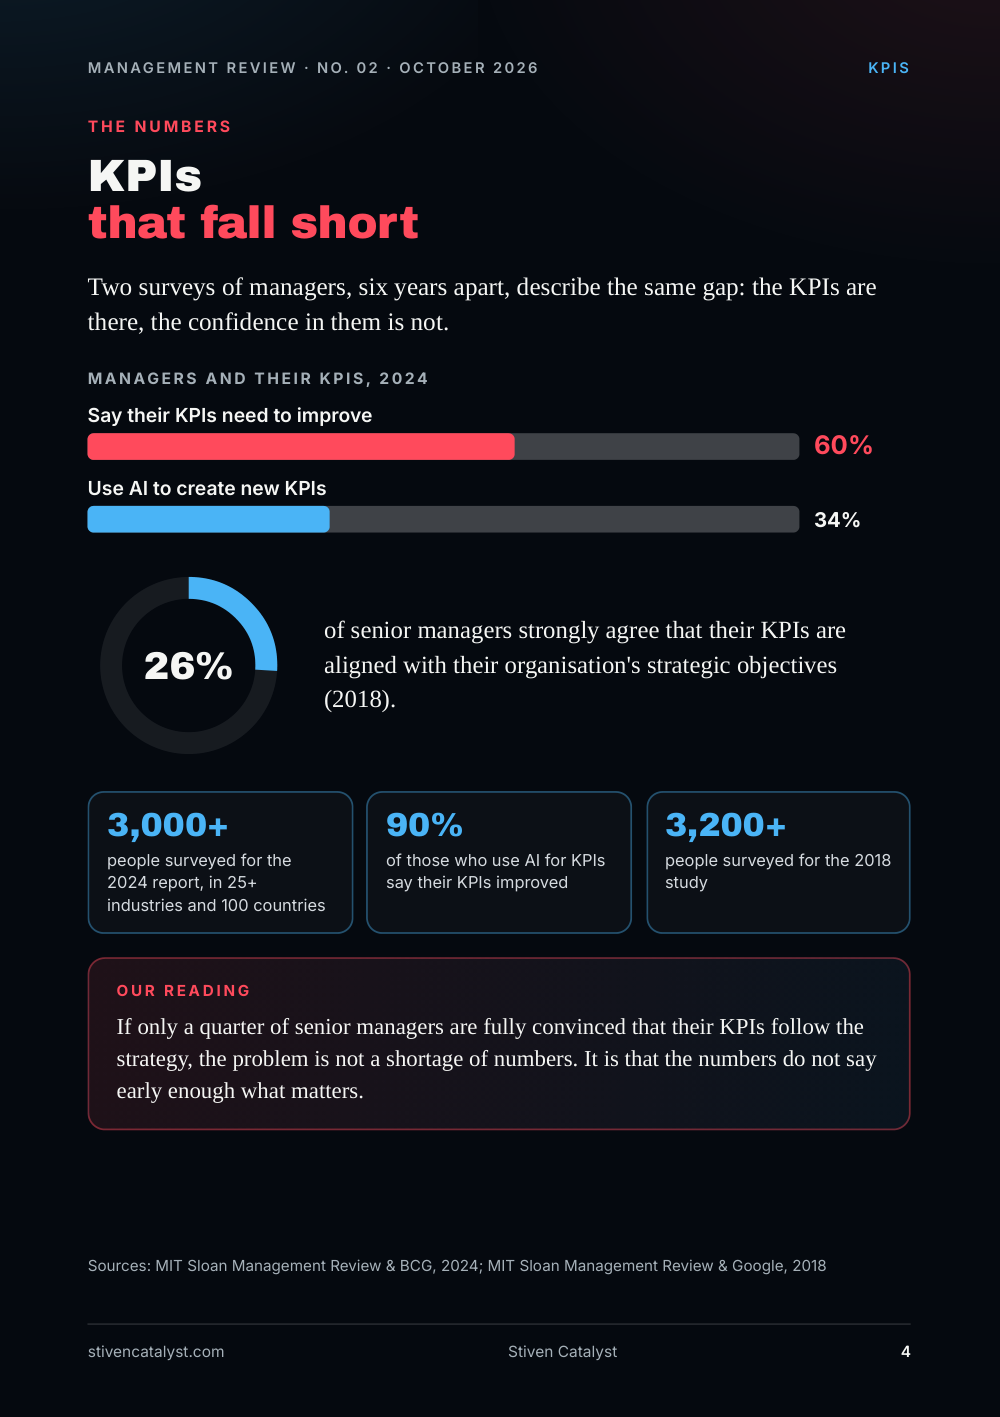
KPIs that fall shor t
Two surveys of managers, six years apart, describe the same gap: the KPIs are there, the confidence in them is not.
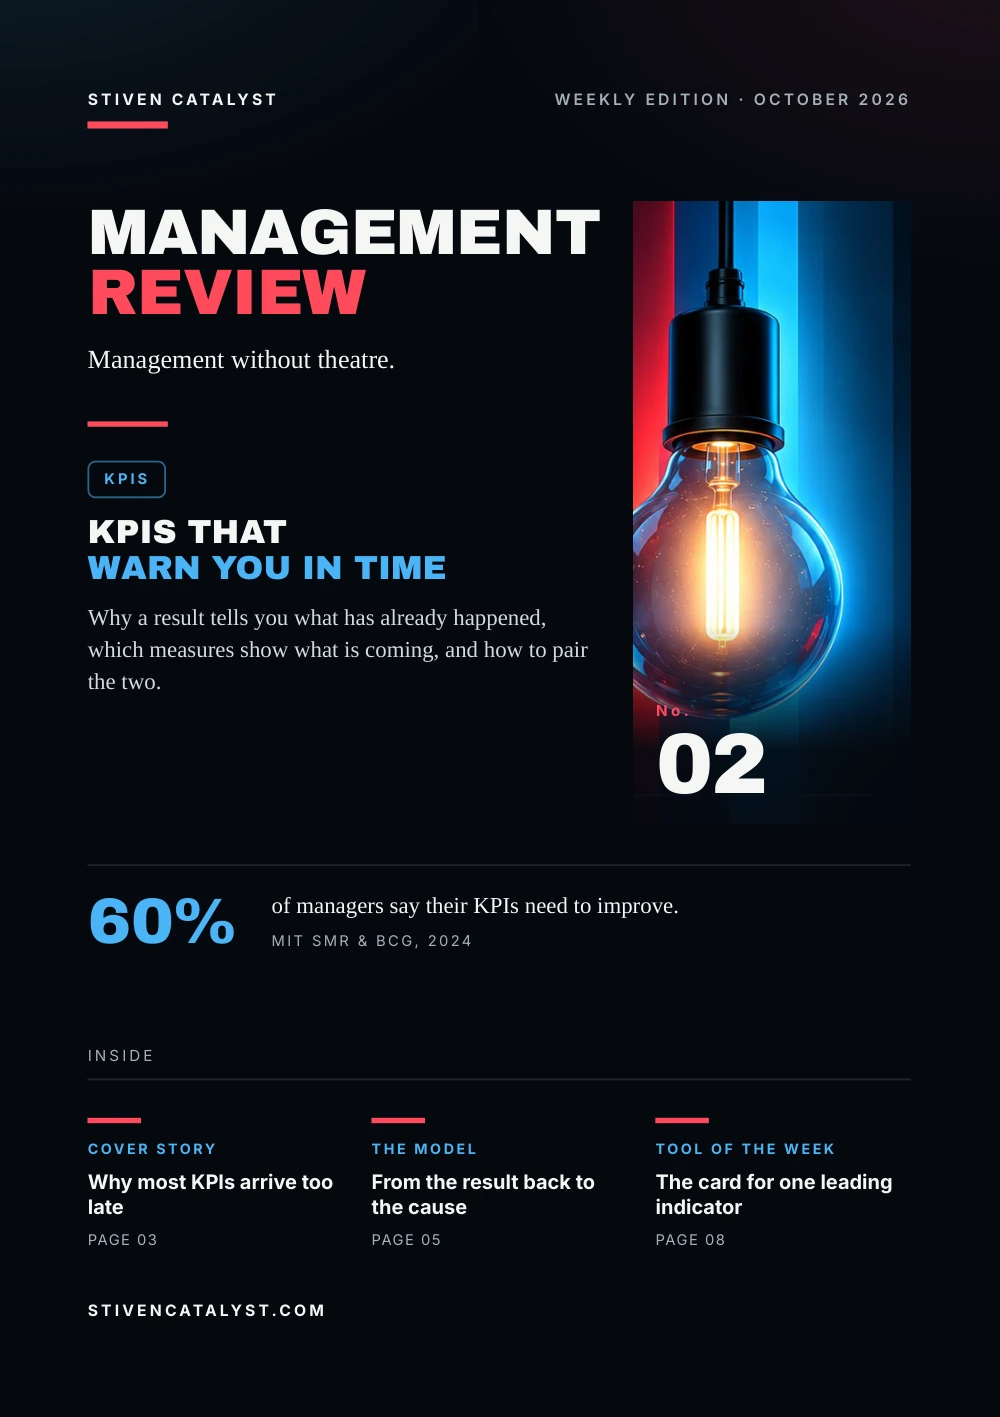
Managers and their KPIs, 2024: Say their KPIs need to improve 60%, Use AI to create new KPIs 34%.
26% of senior managers strongly agree that their KPIs are aligned with their organisation's strategic objectives (2018).
- 3,000+ people surveyed for the 2024 report, in 25+ industries and 100 countries
- 90% of those who use AI for KPIs say their KPIs improved
- 3,200+ people surveyed for the 2018 study
Our reading
If only a quarter of senior managers are fully convinced that their KPIs follow the strategy, the problem is not a shortage of numbers. It is that the numbers do not say early enough what matters.
Sources: MIT Sloan Management Review & BCG, 2024; MIT Sloan Management Review & Google, 2018
The model
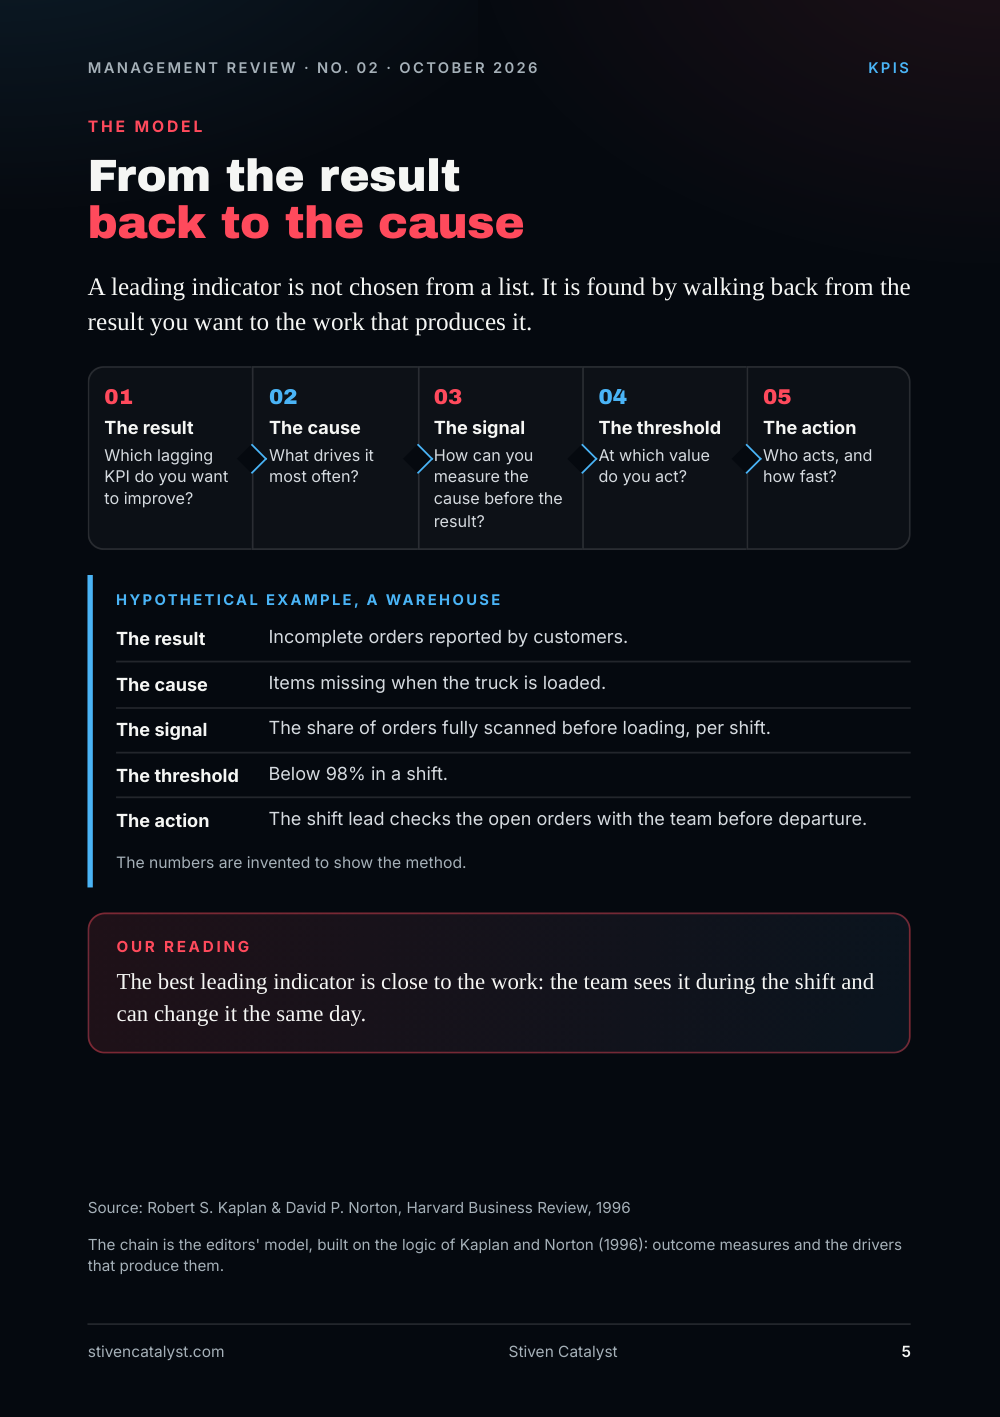
From the result back t o the cause
A leading indicator is not chosen from a list. It is found by walking back from the result you want to the work that produces it.
- The result. Which lagging KPI do you want to improve?
- The cause. What drives it most often?
- The signal. How can you measure the cause before the result?
- The threshold. At which value do you act?
- The action. Who acts, and how fast?
Hypothe tical example, a warehouse
- The result: Incomplete orders reported by customers.
- The cause: Items missing when the truck is loaded.
- The signal: The share of orders fully scanned before loading, per shift.
- The threshold: Below 98% in a shift.
- The action: The shift lead checks the open orders with the team before departure.
The numbers are invented to show the method.
Our reading
The best leading indicator is close to the work: the team sees it during the shift and can change it the same day.
The chain is the editors' model, built on the logic of Kaplan and Norton (1996): outcome measures and the drivers that produce them.
Source: Robert S. Kaplan & David P. Norton, Harvard Business Review, 1996
How to start
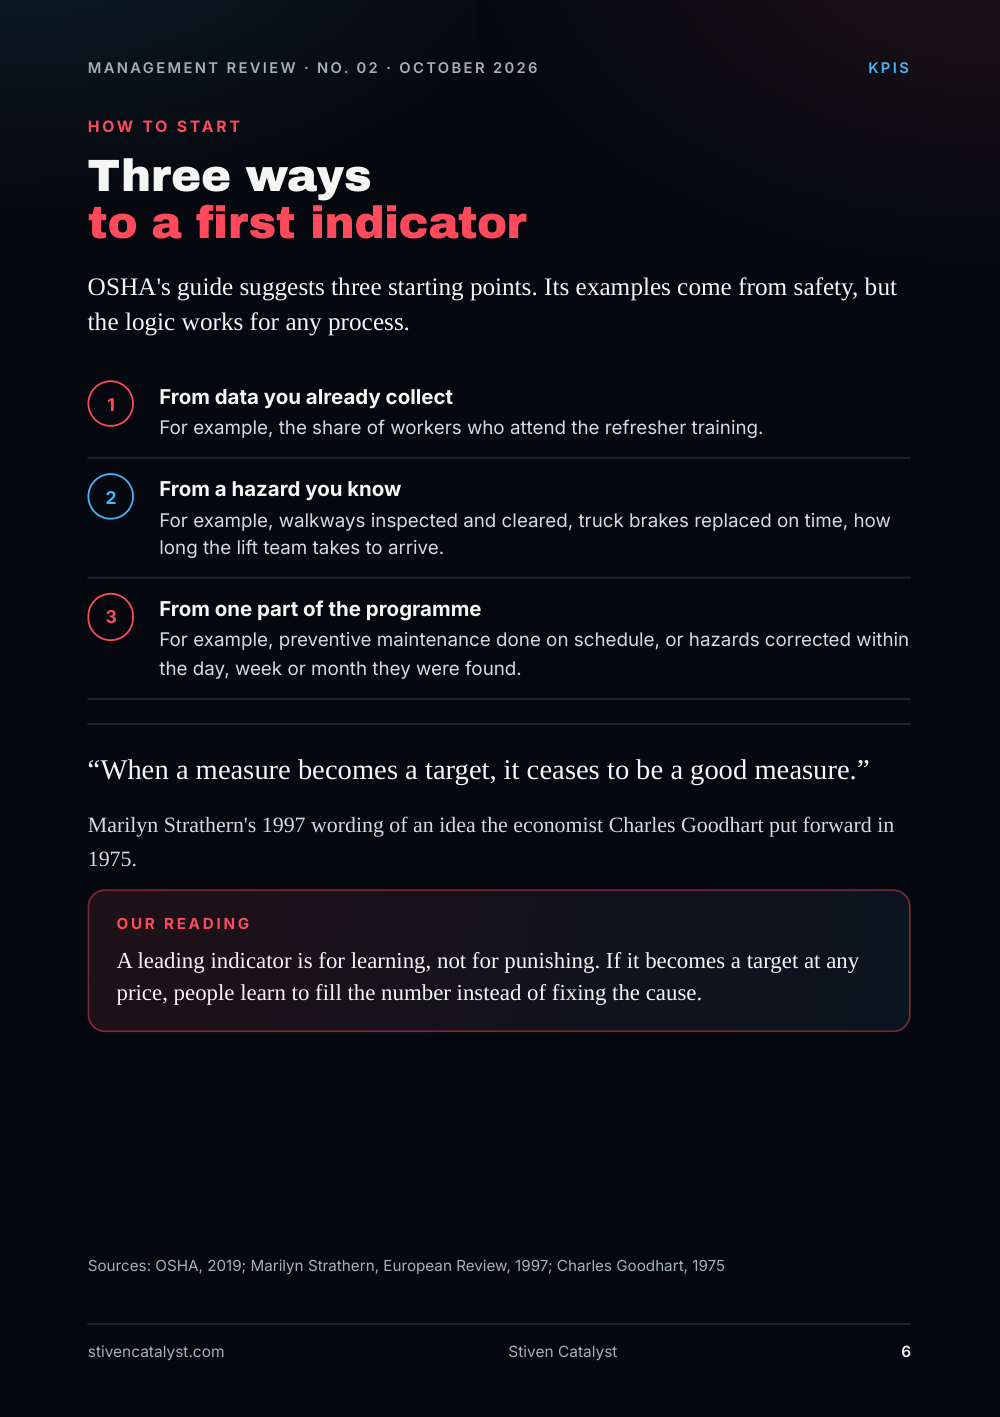
Three ways t o a first indicat or
OSHA's guide suggests three starting points. Its examples come from safety, but the logic works for any process.
- From data you already collect. For example, the share of workers who attend the refresher training.
- From a hazard you know. For example, walkways inspected and cleared, truck brakes replaced on time, how long the lift team takes to arrive.
- From one pa
r t of the programme. For example, preventive maintenance done on schedule, or hazards corrected within the day, week or month they were found.
When a measure becomes a target, it ceases to be a good measure.
Marilyn Strathern's 1997 wording of an idea the economist Charles Goodhart put forward in 1975.
Our reading
A leading indicator is for learning, not for punishing. If it becomes a target at any price, people learn to fill the number instead of fixing the cause.
Sources: OSHA, 2019; Marilyn Strathern, European Review, 1997; Charles Goodhart, 1975
How it is measured
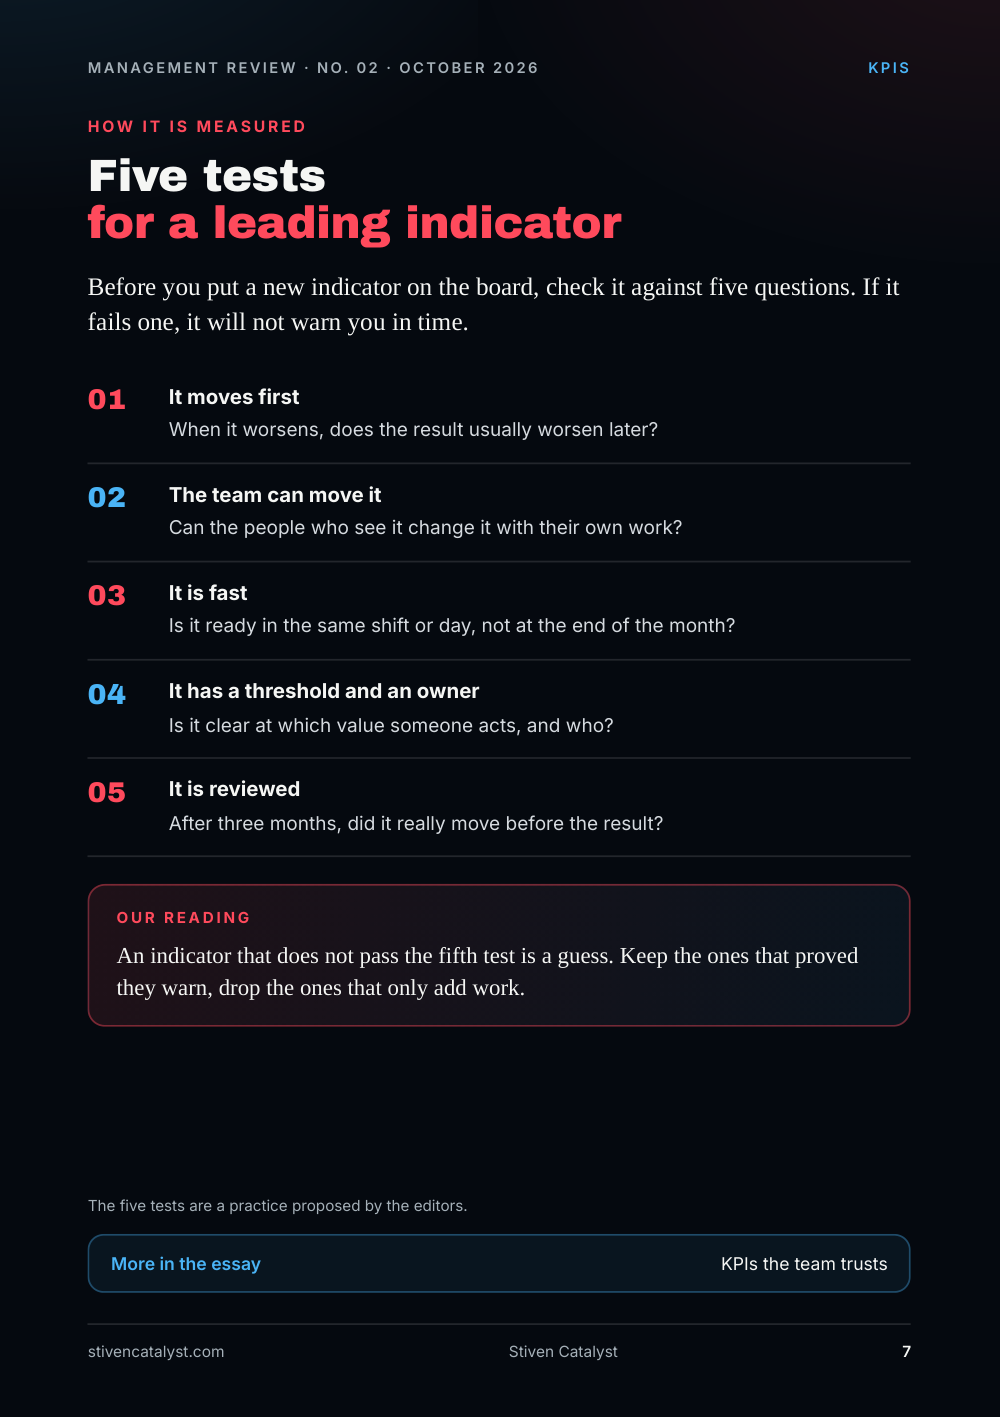
Five tests for a leading indicat or
Before you put a new indicator on the board, check it against five questions. If it fails one, it will not warn you in time.
- It moves first. When it worsens, does the result usually worsen later?
- The team can move it. Can the people who see it change it with their own work?
- It is fast. Is it ready in the same shift or day, not at the end of the month?
- It has a threshold and an owner. Is it clear at which value someone acts, and who?
- It is reviewed. After three months, did it really move before the result?
Our reading
An indicator that does not pass the fifth test is a guess. Keep the ones that proved they warn, drop the ones that only add work.
The five tests are a practice proposed by the editors.
More in the essay: KPIs the team trusts
Tool of the week
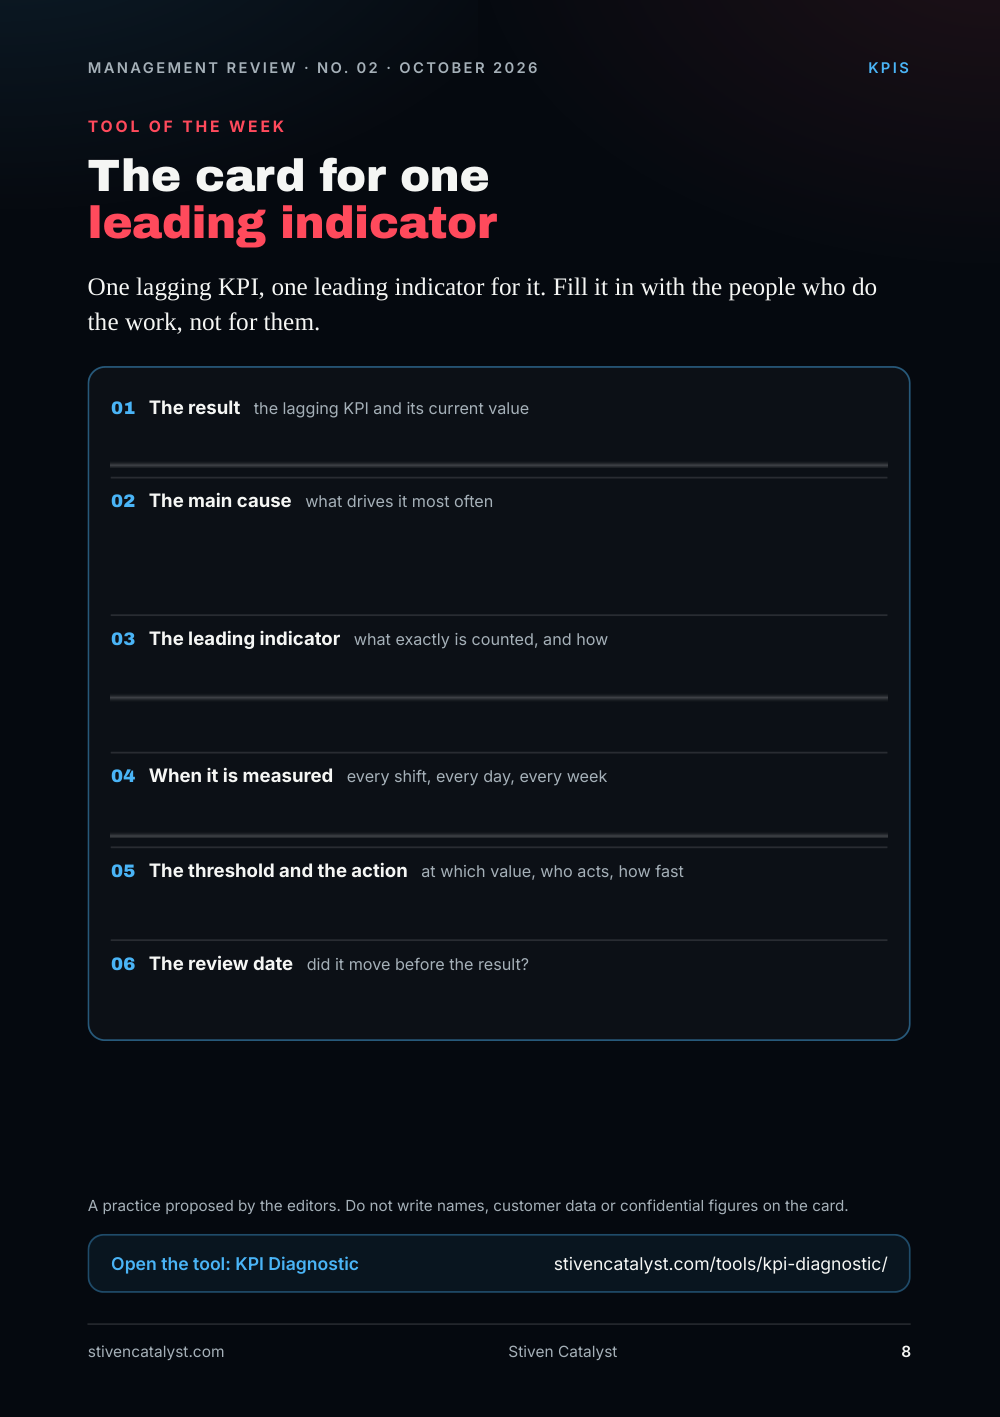
The card for one leading indicat or
One lagging KPI, one leading indicator for it. Fill it in with the people who do the work, not for them.
- The result the lagging KPI and its current value
- The main cause what drives it most often
- The leading indica
t or what exactly is counted, and how - When it is measured every shift, every day, every week
- The threshold and the action at which value, who acts, how fast
- The review date did it move before the result?
A practice proposed by the editors. Do not write names, customer data or confidential figures on the card.
Open the tool: KPI Diagnostic
Sources and method
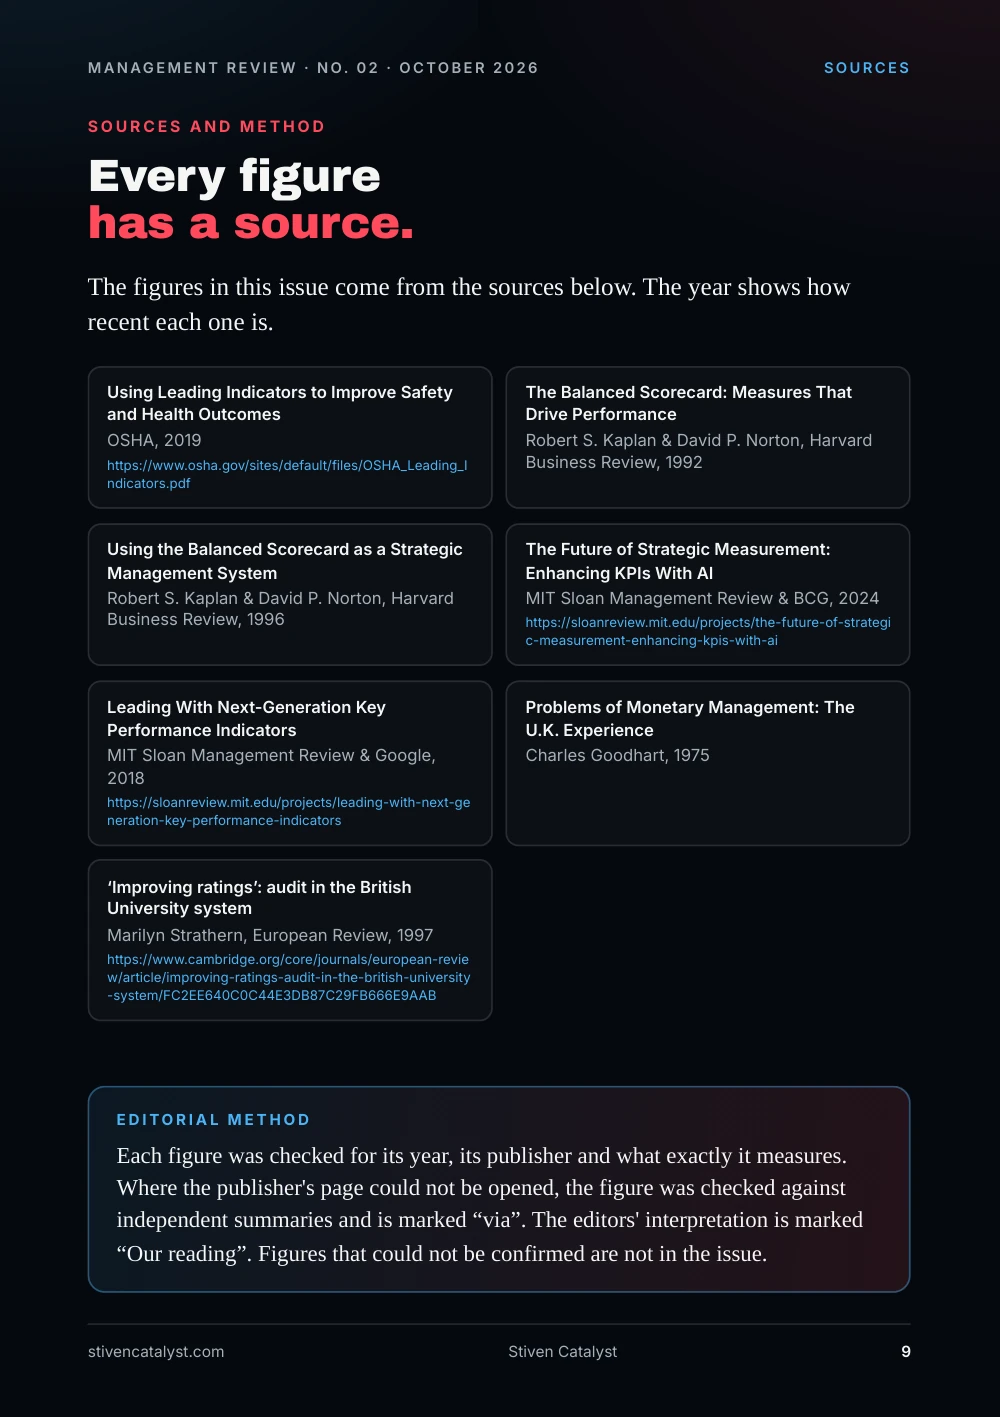
Every figure has a source.
The figures in this issue come from the sources below. The year shows how recent each one is.
- OSHA, “Using Leading Indicators to Improve Safety and Health Outcomes”, 2019. https://www.osha.gov/sites/default/files/OSHA_Leading_Indicators.pdf
- Robert S. Kaplan & David P. Norton, Harvard Business Review, “The Balanced Scorecard: Measures That Drive Performance”, 1992.
- Robert S. Kaplan & David P. Norton, Harvard Business Review, “Using the Balanced Scorecard as a Strategic Management System”, 1996.
- MIT Sloan Management Review & BCG, “The Future of Strategic Measurement: Enhancing KPIs With AI”, 2024. https://sloanreview.mit.edu/projects/the-future-of-strategic-measurement-enhancing-kpis-with-ai
- MIT Sloan Management Review & Google, “Leading With Next-Generation Key Performance Indicators”, 2018. https://sloanreview.mit.edu/projects/leading-with-next-generation-key-performance-indicators
- Charles Goodhart, “Problems of Monetary Management: The U.K. Experience”, 1975.
- Marilyn Strathern, European Review, “‘Improving ratings’: audit in the British University system”, 1997. https://www.cambridge.org/core/journals/european-review/article/improving-ratings-audit-in-the-british-university-system/FC2EE640C0C44E3DB87C29FB666E9AAB
Edit orial me thod
Each figure was checked for its year, its publisher and what exactly it measures. Where the publisher's page could not be opened, the figure was checked against independent summaries and is marked “via”. The editors' interpretation is marked “Our reading”. Figures that could not be confirmed are not in the issue.