In the M5 competition of 2020, the winner forecast Walmart's sales 22.4% more accurately than exponential smoothing, yet only 7.5% of the teams beat that benchmark. In M4 and M5 alike, combinations won; machine learning won when it learned across many related series. The gains were large for total sales and small for one product in one store. Simple benchmarks tell whether a method helped, and four companies show when a planner's hand adjustment helped.
Management Review · Second series · November 2026 · No. 77
Demand forecasting: what machine learning changed
A forecasting competition on Walmart's sales, most teams behind the simple benchmarks, what won twice, where the gains end, how a forecast and a hand adjustment are measured, and a review card.
- No.
- 77
- Pages
- 10
- Sources
- 6
- Topics
- AI
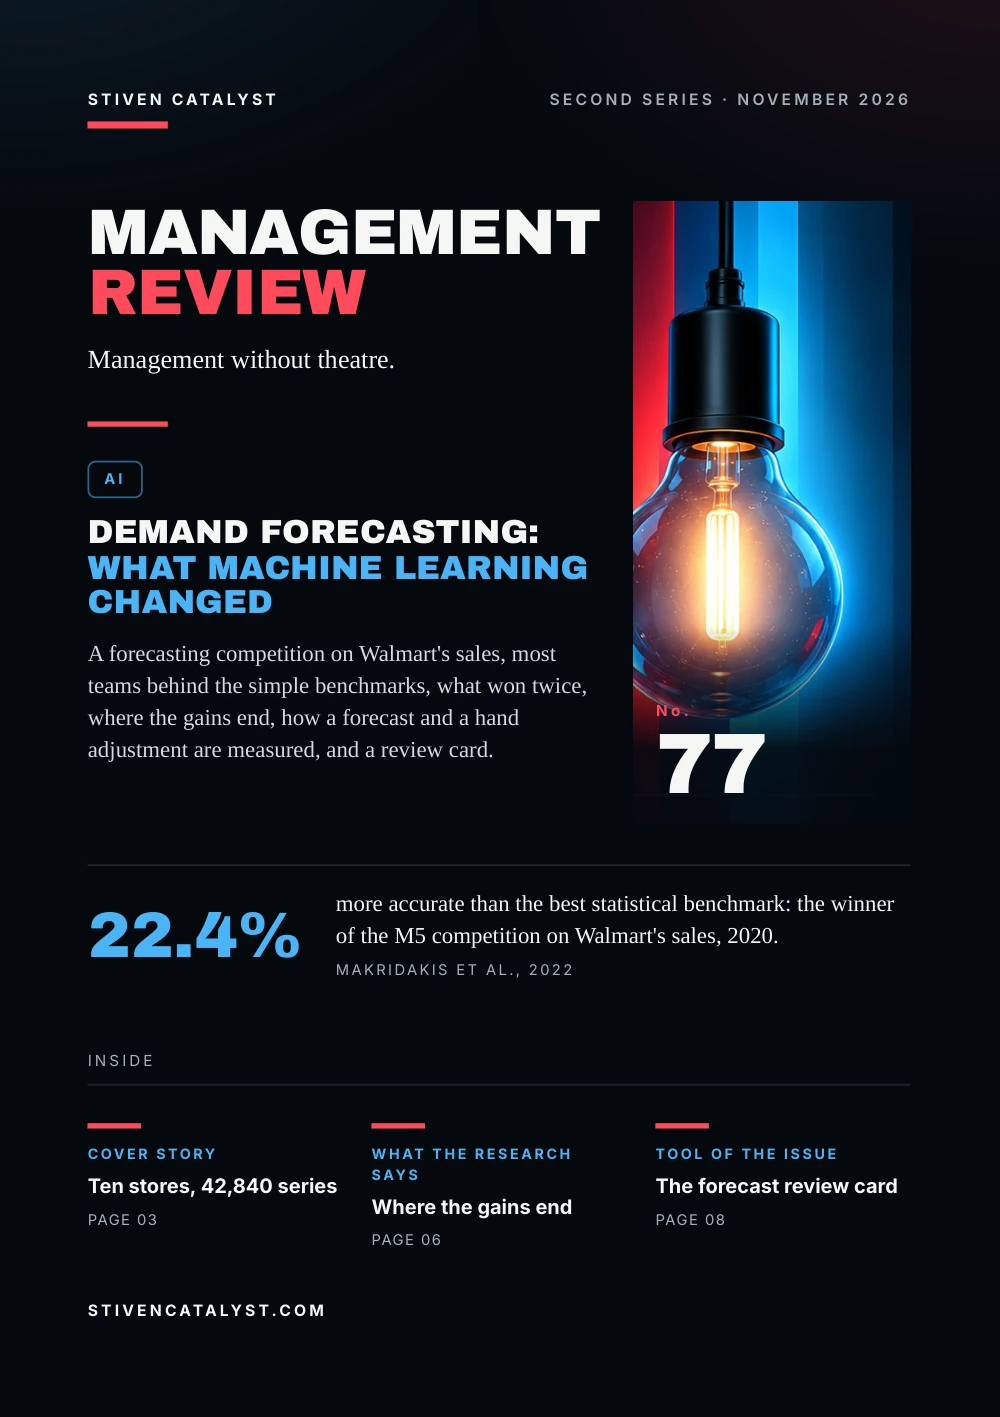
Stiven CatalystSecond series · November 2026
ManagementReview
Management without theatre.
AI
Demand forecasting:what machine learning changed
A forecasting competition on Walmart's sales, most teams behind the simple benchmarks, what won twice, where the gains end, how a forecast and a hand adjustment are measured, and a review card.

No.77
22.4%
more accurate than the best statistical benchmark: the winner of the M5 competition on Walmart's sales, 2020.Makridakis et al., 2022
stivencatalyst.com
No. 77 · AI
In this issue
A demand forecast decides what is ordered, how many people are on the roster and how much stock waits on the shelf. Machine learning promises better forecasts. This issue asks what the largest open forecasting competitions found it changed, and what it did not.
- 03Cover storyTen stores, 42,840 series
- 04The numbersMost did not beat the simple ones
- 05The modelWhat won, twice
- 06What the research saysWhere the gains end
- 07How it is measuredMeasure against the naive
- 08Tool of the issueThe forecast review card
- 09SourcesSources and method
How to read this issue
Figure
Every figure has its source and year at the foot of its page.
Our reading
Where the editors interpret rather than the research, it says so.
Practice
The steps and the card are proposals to try, not research results.
Cover story
Ten st ores,42,840 series
In 2020 the M5 competition gave forecasters more than five years of daily unit sales from Walmart: 3,049 products in ten stores in California, Texas and Wisconsin. The task was to forecast the next 28 days.
42,840series in 12 levels: each product in each store, summed by department, category, store and state
30,490forecasts asked for at the lowest level, one product in one store; the rest summed up from them
The winning team was 22.4% more accurate than the best statistical benchmark, exponential smoothing. Only the top five passed 20%; all of the top 50 passed 14%. The winner averaged, with equal weights, many LightGBM models, a method built from decision trees, each trained across all the series of a store, a store category or a store department.
Our reading
Part of the gain came from modelling seasonality and using outside information such as prices; the rest, the organisers think, from learning across thousands of related series at once.
Sources: Spyros Makridakis et al., International Journal of Forecasting 38(4), The M5 competition: Background, organization, and implementation, 2022 (via Abstract; the intermittency shares from a later paper); Spyros Makridakis et al., International Journal of Forecasting 38(4), M5 accuracy competition: Results, findings, and conclusions, 2022 (via The authors' preprint, 2020)
Accuracy as WRMSSE: each series' error scaled by that of a naive forecast and weighted by its dollar sales. The results paper was read in the authors' 2020 preprint; the background paper only in its abstract.
The numbers
Most did not beatthe simple ones
Next to the entries, the organisers ran benchmarks, from the naive forecast, which repeats the last value, to exponential smoothing. Of the teams in the final ranking, the share that beat each one:
Teams that beat each benchmark, M5 accuracy, 2020
Had each team submitted its best attempt, 63.7%, 48.8% and 12.2% would have beaten them. The organisers suspect misleading validation scores: many teams did not pick the best method they had built.
Our reading
A complex model is easy to build and hard to check. Without a simple benchmark next to it, nobody knows whether it helped.
Source: Spyros Makridakis et al., International Journal of Forecasting 38(4), 2022 (via The authors' preprint, 2020)
Final submissions. The organisers add that many teams behind exponential smoothing may have lost interest and stopped, so the 7.5% may be somewhat biased.
The model
What won,twice
Two years before M5, the M4 competition asked for forecasts of 100,000 time series. Its lessons and those of M5 point the same way, with one change.
M4, 2018
- 12 of the 17 most accurate methods were combinations
- the winner, a hybrid of statistics and a neural network, about 10% better than a combination benchmark
- six pure machine learning methods: none beat the combination, one beat the naive
M5, 2020
- LightGBM in most of the leading entries
- combinations of many models
- one model learning across many series
- prices, promotions and events as inputs
Our reading
Machine learning won where it had many related series and information beyond past sales, as in M5. Pure machine learning in M4 had not.
Sources: Spyros Makridakis et al., International Journal of Forecasting 34(4), 2018 (via Abstract in library records); Spyros Makridakis et al., International Journal of Forecasting 38(4), 2022 (via The authors' preprint, 2020)
The 10% in M4 is by sMAPE, a percentage error. In M5, exponential smoothing with promotions and special days was 6% more accurate than without; ARIMA with such inputs, 13%.
What the research says
Where thegains end
The 42,840 series sit on 12 levels, from all of Walmart's sales in the data down to one product in one store. The organisers compared the top methods with the best benchmark at each level.
Average gain of the top methods over the best benchmark, by level (2020)
For one product in one store, 73% of the 30,490 series were intermittent: days with no sale, then a few. There, the organisers note, the standard methods for intermittent demand still held some value.
Our reading
The forecast that fills the shelf is still the uncertain one. Plan stock, people and capacity for the error, not only for the number.
Sources: Spyros Makridakis et al., International Journal of Forecasting 38(4), M5 accuracy competition: Results, findings, and conclusions, 2022 (via The authors' preprint, 2020); Spyros Makridakis et al., International Journal of Forecasting 38(4), The M5 competition: Background, organization, and implementation, 2022 (via Abstract; the intermittency shares from a later paper)
Rounded averages, read in the authors' preprint of the results paper. At the three lowest levels the overall winner ranked 11th to 13th of the top 50.
More in the essayHigh-volume days: the standard under pressure
How it is measured
Measure againstthe naive
Rob Hyndman and George Athanasopoulos use four simple methods as benchmarks throughout their textbook; the simplest, the naive forecast, repeats the last value. Other methods are compared with them.
Three measures of error
MAE, mean absolute error
In units. Minimising it leads to the median; minimising RMSE, to the mean.
MAPE, mean absolute percentage error
Infinite or undefined on a day with zero sales, extreme near zero.
MASE, mean absolute scaled error
Below 1 when the forecast beats the naive forecast on past data.
In four supply-chain companies, over 60,000 forecasts, planners adjusted on average 75% of the system's forecasts. Large adjustments helped more; small ones often did harm. Upward ones helped far less often and more often went the wrong way.
Our reading
Measure every hand on the forecast: the system against the naive, the adjustment against the system.
Sources: Rob J. Hyndman & George Athanasopoulos, OTexts, 2021; Robert Fildes et al., International Journal of Forecasting 25(1), 2009 (via Abstract and summaries); Robert Fildes & Paul Goodwin, Foresight 8, 2007
Measures as in Hyndman & Athanasopoulos (2021). Fildes et al.: three manufacturers forecasting monthly, one retailer weekly; the authors see optimism in the upward lean.
Tool of the issue
The forecastreview card
One card per product family and month. The naive forecast next to the system's, every hand adjustment with its reason, and a look at whether the error leans one way.
01Series and levelproduct family, store or region; how many days had no sales
02Benchmarknaive or seasonal naive: its error over the same period
03System forecasterror in units (MAE) and against the benchmark (MASE)
04Hand adjustmentswho changed what, up or down, by how much, and why
05Value of the adjustmenterror after the adjustment against the system forecast before it
06Lean of the errormonths above sales against months below; the errors on a control chart
07Next monthkeep, change the method or the data, or stop the adjustments that did not help
Sources: Rob J. Hyndman & George Athanasopoulos, OTexts, 2021; Robert Fildes et al., International Journal of Forecasting 25(1), 2009 (via Abstract and summaries)
A practice proposed by the editors, after Hyndman & Athanasopoulos (2021) and Fildes et al. (2009). For the monthly plan itself, see No. 59.
Open the tool: Sigma & Control Chartstivencatalyst.com/tools/sigma-control-chart/
Sources and method
Every figurehas a source.
The figures in this issue come from the sources below. The year shows how recent each one is.
- M5 accuracy competition: Results, findings, and conclusionsSpyros Makridakis et al., International Journal of Forecasting 38(4), 2022 · via The authors' preprint, 2020https://doi.org/10.1016/j.ijforecast.2021.11.013
- The M5 competition: Background, organization, and implementationSpyros Makridakis et al., International Journal of Forecasting 38(4), 2022 · via Abstract; the intermittency shares from a later paperhttps://www.sciencedirect.com/science/article/pii/S0169207021001187
- The M4 Competition: Results, findings, conclusion and way forwardSpyros Makridakis et al., International Journal of Forecasting 34(4), 2018 · via Abstract in library recordshttps://doi.org/10.1016/j.ijforecast.2018.06.001
- Forecasting: Principles and Practice, 3rd editionRob J. Hyndman & George Athanasopoulos, OTexts, 2021https://otexts.com/fpp3/
- Effective forecasting and judgmental adjustments: an empirical evaluation and strategies for improvement in supply-chain planningRobert Fildes et al., International Journal of Forecasting 25(1), 2009 · via Abstract and summarieshttps://doi.org/10.1016/j.ijforecast.2008.11.010
- Good and Bad Judgment in Forecasting: Lessons from Four CompaniesRobert Fildes & Paul Goodwin, Foresight 8, 2007https://forecasters.org/wp-content/uploads/Good-and-Bad-Judgment-in-Forecasting_Issue8.pdf
Editorial method
Each figure was checked for its year, its publisher and what exactly it measures. Where the publisher's page could not be opened, the figure was checked against independent summaries and is marked “via”. The editors' interpretation is marked “Our reading”. Figures that could not be confirmed are not in the issue.
ManagementReview
Management without theatre.
Every issue, one management question, checked against the best research.
All issues
stivencatalyst.com/magazine/management-review.html
Management Review · No. 77 · November 2026 · Stiven Catalyst
Click or swipe a page to turn it. The arrow keys work too.
Management Review · No. 77
The figures of the issue
The charts of the printed pages, with their sources.
Source: Spyros Makridakis et al., International Journal of Forecasting 38(4), 2022 (via The authors' preprint, 2020)
Source: Spyros Makridakis et al., International Journal of Forecasting 38(4), 2022 (via The authors' preprint, 2020)
The whole text Read the issue as text For reading on a small screen, searching or a screen reader. The same words, without the page design.
In this issue
A demand forecast decides what is ordered, how many people are on the roster and how much stock waits on the shelf. Machine learning promises better forecasts. This issue asks what the largest open forecasting competitions found it changed, and what it did not.
In the M5 competition of 2020, the winner forecast Walmart's sales 22.4% more accurately than exponential smoothing, yet only 7.5% of the teams beat that benchmark. In M4 and M5 alike, combinations won; machine learning won when it learned across many related series. The gains were large for total sales and small for one product in one store. Simple benchmarks tell whether a method helped, and four companies show when a planner's hand adjustment helped.
Stiven Janaqi, Editor
Cover story
Ten st ores, 42,840 series
In 2020 the M5 competition gave forecasters more than five years of daily unit sales from Walmart: 3,049 products in ten stores in California, Texas and Wisconsin. The task was to forecast the next 28 days.
- 42,840 series in 12 levels: each product in each store, summed by department, category, store and state
- 30,490 forecasts asked for at the lowest level, one product in one store; the rest summed up from them
The winning team was 22.4% more accurate than the best statistical benchmark, exponential smoothing. Only the top five passed 20%; all of the top 50 passed 14%. The winner averaged, with equal weights, many LightGBM models, a method built from decision trees, each trained across all the series of a store, a store category or a store department.
Our reading
Part of the gain came from modelling seasonality and using outside information such as prices; the rest, the organisers think, from learning across thousands of related series at once.
Accuracy as WRMSSE: each series' error scaled by that of a naive forecast and weighted by its dollar sales. The results paper was read in the authors' 2020 preprint; the background paper only in its abstract.
Sources: Spyros Makridakis et al., International Journal of Forecasting 38(4), The M5 competition: Background, organization, and implementation, 2022 (via Abstract; the intermittency shares from a later paper); Spyros Makridakis et al., International Journal of Forecasting 38(4), M5 accuracy competition: Results, findings, and conclusions, 2022 (via The authors' preprint, 2020)
The numbers
Most did not beat the simple ones
Next to the entries, the organisers ran benchmarks, from the naive forecast, which repeats the last value, to exponential smoothing. Of the teams in the final ranking, the share that beat each one:
Teams that beat each benchmark, M5 accuracy, 2020: Naive forecast 48.4%, Seasonal naive forecast 35.8%, Exponential smoothing, the best benchmark 7.5%.
Had each team submitted its best attempt, 63.7%, 48.8% and 12.2% would have beaten them. The organisers suspect misleading validation scores: many teams did not pick the best method they had built.
Our reading
A complex model is easy to build and hard to check. Without a simple benchmark next to it, nobody knows whether it helped.
Final submissions. The organisers add that many teams behind exponential smoothing may have lost interest and stopped, so the 7.5% may be somewhat biased.
Source: Spyros Makridakis et al., International Journal of Forecasting 38(4), 2022 (via The authors' preprint, 2020)
The model
What won, twice
Two years before M5, the M4 competition asked for forecasts of 100,000 time series. Its lessons and those of M5 point the same way, with one change.
M4, 2018
- 12 of the 17 most accurate methods were combinations
- the winner, a hybrid of statistics and a neural network, about 10% better than a combination benchmark
- six pure machine learning methods: none beat the combination, one beat the naive
M5, 2020
- LightGBM in most of the leading entries
- combinations of many models
- one model learning across many series
- prices, promotions and events as inputs
Our reading
Machine learning won where it had many related series and information beyond past sales, as in M5. Pure machine learning in M4 had not.
The 10% in M4 is by sMAPE, a percentage error. In M5, exponential smoothing with promotions and special days was 6% more accurate than without; ARIMA with such inputs, 13%.
Sources: Spyros Makridakis et al., International Journal of Forecasting 34(4), 2018 (via Abstract in library records); Spyros Makridakis et al., International Journal of Forecasting 38(4), 2022 (via The authors' preprint, 2020)
What the research says
Where the gains end
The 42,840 series sit on 12 levels, from all of Walmart's sales in the data down to one product in one store. The organisers compared the top methods with the best benchmark at each level.
Average gain of the top methods over the best benchmark, by level (2020): Total (1) ~40%, Levels 5–7 ~23%, Product, store (10–12) ~3%.
For one product in one store, 73% of the 30,490 series were intermittent: days with no sale, then a few. There, the organisers note, the standard methods for intermittent demand still held some value.
Our reading
The forecast that fills the shelf is still the uncertain one. Plan stock, people and capacity for the error, not only for the number.
Rounded averages, read in the authors' preprint of the results paper. At the three lowest levels the overall winner ranked 11th to 13th of the top 50.
Sources: Spyros Makridakis et al., International Journal of Forecasting 38(4), M5 accuracy competition: Results, findings, and conclusions, 2022 (via The authors' preprint, 2020); Spyros Makridakis et al., International Journal of Forecasting 38(4), The M5 competition: Background, organization, and implementation, 2022 (via Abstract; the intermittency shares from a later paper)
More in the essay: High-volume days: the standard under pressure
How it is measured
Measure against the naive
Rob Hyndman and George Athanasopoulos use four simple methods as benchmarks throughout their textbook; the simplest, the naive forecast, repeats the last value. Other methods are compared with them.
Three measures of error
- MAE, mean absolute error. In units. Minimising it leads to the median; minimising RMSE, to the mean.
- MAPE, mean absolute percentage error. Infinite or undefined on a day with zero sales, extreme near zero.
- MASE, mean absolute scaled error. Below 1 when the forecast beats the naive forecast on past data.
In four supply-chain companies, over 60,000 forecasts, planners adjusted on average 75% of the system's forecasts. Large adjustments helped more; small ones often did harm. Upward ones helped far less often and more often went the wrong way.
Our reading
Measure every hand on the forecast: the system against the naive, the adjustment against the system.
Measures as in Hyndman & Athanasopoulos (2021). Fildes et al.: three manufacturers forecasting monthly, one retailer weekly; the authors see optimism in the upward lean.
Sources: Rob J. Hyndman & George Athanasopoulos, OTexts, 2021; Robert Fildes et al., International Journal of Forecasting 25(1), 2009 (via Abstract and summaries); Robert Fildes & Paul Goodwin, Foresight 8, 2007
Tool of the issue
The forecast review card
One card per product family and month. The naive forecast next to the system's, every hand adjustment with its reason, and a look at whether the error leans one way.
- Series and level product family, store or region; how many days had no sales
- Benchmark naive or seasonal naive: its error over the same period
- System forecast error in units (MAE) and against the benchmark (MASE)
- Hand adjustments who changed what, up or down, by how much, and why
- Value of the adjustment error after the adjustment against the system forecast before it
- Lean of the error months above sales against months below; the errors on a control chart
- Next month keep, change the method or the data, or stop the adjustments that did not help
A practice proposed by the editors, after Hyndman & Athanasopoulos (2021) and Fildes et al. (2009). For the monthly plan itself, see No. 59.
Sources: Rob J. Hyndman & George Athanasopoulos, OTexts, 2021; Robert Fildes et al., International Journal of Forecasting 25(1), 2009 (via Abstract and summaries)
Open the tool: Sigma & Control Chart
Sources and method
Every figure has a source.
The figures in this issue come from the sources below. The year shows how recent each one is.
- Spyros Makridakis et al., International Journal of Forecasting 38(4), “M5 accuracy competition: Results, findings, and conclusions”, 2022 (via The authors' preprint, 2020). https://doi.org/10.1016/j.ijforecast.2021.11.013
- Spyros Makridakis et al., International Journal of Forecasting 38(4), “The M5 competition: Background, organization, and implementation”, 2022 (via Abstract; the intermittency shares from a later paper). https://www.sciencedirect.com/science/article/pii/S0169207021001187
- Spyros Makridakis et al., International Journal of Forecasting 34(4), “The M4 Competition: Results, findings, conclusion and way forward”, 2018 (via Abstract in library records). https://doi.org/10.1016/j.ijforecast.2018.06.001
- Rob J. Hyndman & George Athanasopoulos, OTexts, “Forecasting: Principles and Practice, 3rd edition”, 2021. https://otexts.com/fpp3/
- Robert Fildes et al., International Journal of Forecasting 25(1), “Effective forecasting and judgmental adjustments: an empirical evaluation and strategies for improvement in supply-chain planning”, 2009 (via Abstract and summaries). https://doi.org/10.1016/j.ijforecast.2008.11.010
- Robert Fildes & Paul Goodwin, Foresight 8, “Good and Bad Judgment in Forecasting: Lessons from Four Companies”, 2007. https://forecasters.org/wp-content/uploads/Good-and-Bad-Judgment-in-Forecasting_Issue8.pdf
Edit orial me thod
Each figure was checked for its year, its publisher and what exactly it measures. Where the publisher's page could not be opened, the figure was checked against independent summaries and is marked “via”. The editors' interpretation is marked “Our reading”. Figures that could not be confirmed are not in the issue.
Management Review · Monthly edition