Kaoru Ishikawa is credited with the first diagram, in 1943, and counted it among seven basic tools he said could solve 95% of problems at work; in a survey published in 2021, fewer than a quarter of 397 quality professionals trained in them went that far. ASQ's procedure starts from one effect and generic categories such as the 6Ms. Patient-safety researchers warn that “root cause” suggests a single one. At one medical centre, eight years of analyses ended most often in training, process change and policy.
Management Review · Second series · November 2026 · No. 76
The Ishikawa diagram
Where the fishbone came from, how far quality professionals trust the seven basic tools, how to draw one, Ishikawa's three types, what hospital investigations ended up proposing, and a card for one diagram.
- No.
- 76
- Pages
- 10
- Sources
- 6
- Topics
- Operations
Stiven CatalystSecond series · November 2026
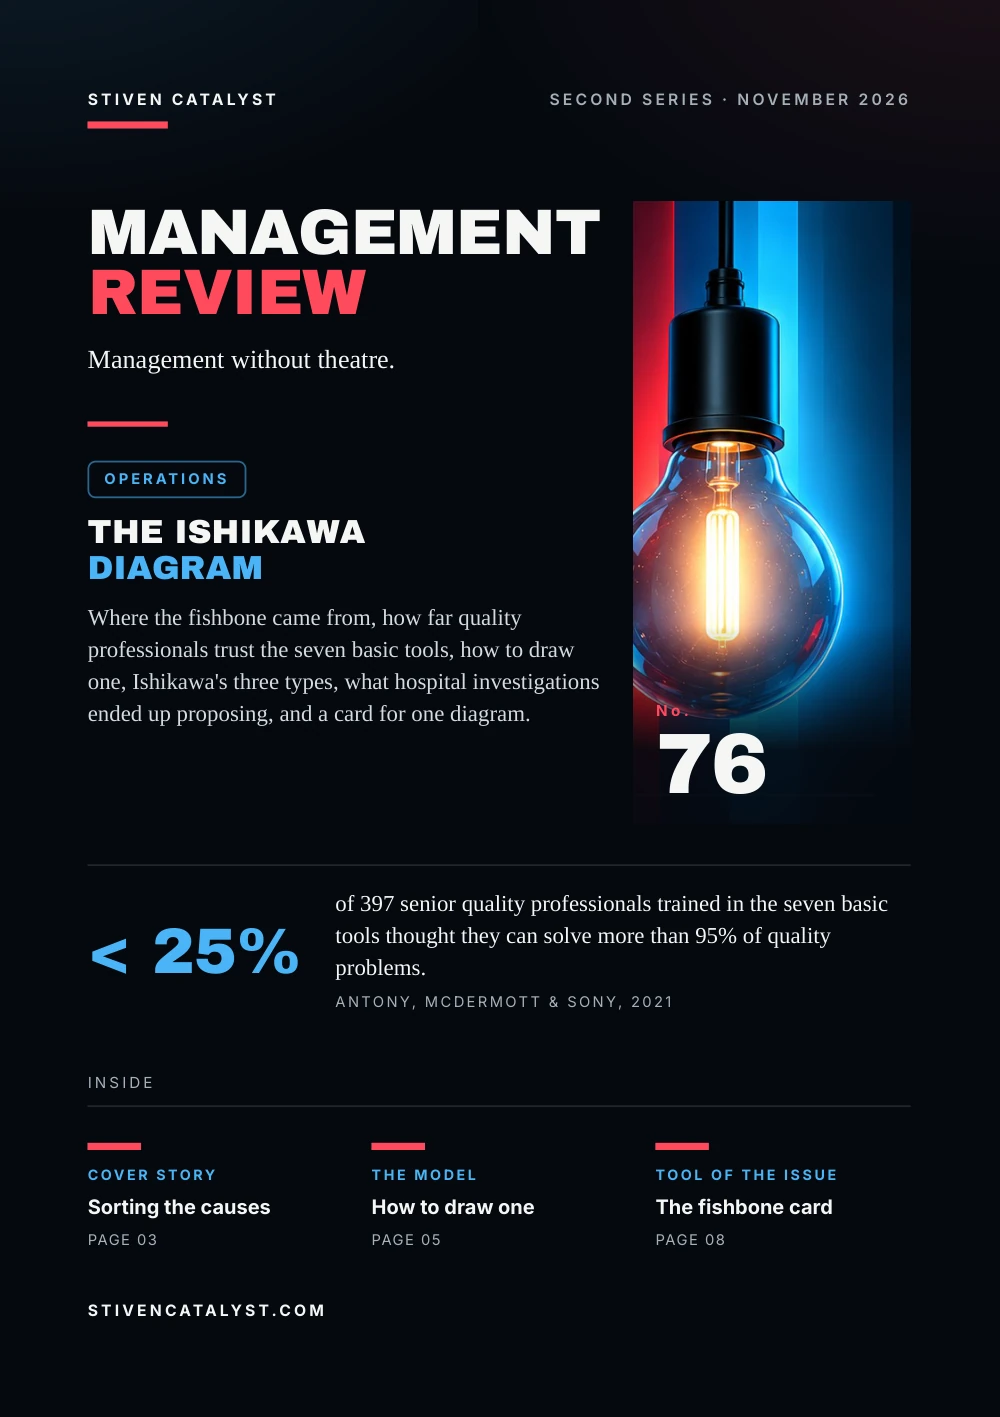
ManagementReview
Management without theatre.
Operations
The Ishikawadiagram
Where the fishbone came from, how far quality professionals trust the seven basic tools, how to draw one, Ishikawa's three types, what hospital investigations ended up proposing, and a card for one diagram.

No.76
< 25%
of 397 senior quality professionals trained in the seven basic tools thought they can solve more than 95% of quality problems.Antony, McDermott & Sony, 2021
stivencatalyst.com
No. 76 · Operations
In this issue
When something goes wrong, the first explanation offered is usually a single cause, often a person. The Ishikawa diagram makes a team write down every cause it can think of, sorted into groups, before it chooses one. This issue asks where the diagram came from, how it is drawn, and what it can and cannot prove.
- 03Cover storySorting the causes
- 04The numbersWidely used, modestly trusted
- 05The modelHow to draw one
- 06What the research saysThree types, one warning
- 07How it is measuredWhat the analyses proposed
- 08Tool of the issueThe fishbone card
- 09SourcesSources and method
How to read this issue
Figure
Every figure has its source and year at the foot of its page.
Our reading
Where the editors interpret rather than the research, it says so.
Practice
The steps and the card are proposals to try, not research results.
Cover story
Sor tingthe causes
Kaoru Ishikawa is credited with drawing the first cause-and-effect diagram in 1943, to show engineers at Kawasaki Steel how the many factors behind a result could be sorted and related to one another.
01
The head
the effect: one problem, written in a box on the right
02
The bones
the main categories of causes, branching off the spine
03
The small bones
causes and sub-causes, found by asking why it happens
The shape gave it its other name, the fishbone. Ishikawa counted it among seven basic quality tools, with the check sheet, the Pareto chart, the histogram, the scatter diagram, stratification and the control chart.
Our reading
The diagram does not find the cause. It stops a team from settling on the first one that comes to mind.
Sources: A. Mark Doggett, Quality Management Journal 12(4), 2005; Kaoru Ishikawa, JUSE, 1968 (via Secondary summaries); ASQ, 2026
The 1943 story as Doggett (2005) tells it; Ishikawa's own account was not available to us, and other accounts give other dates and places. ASQ lists the names fishbone, cause-and-effect and Ishikawa diagram.
The numbers
Widely used,modestly trusted
Ishikawa held that seven basic tools, used skilfully, could solve 95% of problems at work. In a study published in 2021, Jiju Antony, Olivia McDermott and Michael Sony put the claim to 456 senior quality professionals on five continents.
456senior quality professionals answered the online survey
< 25%of the 397 trained in the tools thought they can solve over 95% of quality problems
The Pareto chart was the most widely used of the seven, scatter diagrams and stratification the least; the tools were used most in production and least in IT and finance.
Our reading
Professionals use the tools widely and expect less of them than their author did. That is the right frame of mind for the diagram.
Source: Jiju Antony, Olivia McDermott & Michael Sony, IEEE Transactions on Engineering Management 70(11), 2021
Self-reports in an online survey. Those not trained in the tools stopped after the first questions; the 25% is of the 397 who went on (90 of 397). Ishikawa's 95% as the authors quote it.
The model
How t odraw one
ASQ's procedure, which cites Nancy Tague's Quality Toolbox, starts with the team agreeing on one problem statement, the effect, and writing it in a box on the right, at the end of a horizontal spine.
The four steps (ASQ)
- 01
Name the effect
one problem, agreed
- 02
Choose the bones
the main categories
- 03
Ask why
each answer is a cause
- 04
Ask again
sub-causes off each cause
Manufacturing: the 6Ms
- Methods
- Machinery
- Materials
- Measurement
- Manpower
- Mother Nature
What they cover (ASQ)
- Machinery: equipment, software
- Methods: procedures, regulations
- Manpower: training, skills
- Mother Nature: the environment
- Sometimes a seventh M: money
Our reading
The people bone is the easy one. “Careless operator” ends the search; why the process let the slip through is the next question.
Source: ASQ, 2026
Ishikawa introduced the 6Ms as generic labels but encouraged teams to name their own (ASQ). The right column shortens ASQ's notes on the categories.
More in the essayPareto and 5 Why in practice, not in PowerPoint
What the research says
Three t ypes,one warning
Ishikawa described three ways to build the diagram. They differ in what forms the bones: the sources of variation, the steps of the process, or a free list of causes sorted afterwards.
01
Dispersion analysis
the bones are sources of variation, such as the 6Ms
02
Process classification
the spine follows the steps; causes branch off each one
03
Cause enumeration
all possible causes listed first, then grouped and related
Writing on root cause analysis in patient safety, Mohammad Farhad Peerally, Susan Carr, Justin Waring and Mary Dixon-Woods (2017) argue that the method spread with too little attention to what made it work where it came from, and that the term “root cause” suggests a single cause and invites stories that are too simple.
Our reading
Most problems have several causes acting together. A diagram with one bone circled is a place to start checking, not a verdict.
Sources: Kaoru Ishikawa, JUSE, 1968 (via Secondary summaries); M. F. Peerally, S. Carr, J. Waring & M. Dixon-Woods, BMJ Quality & Safety 26(5), 2017
The three types as Doggett (2005) summarises Ishikawa's guide; we did not see the book. On blame after errors, see No. 50.
How it is measured
What the analysesproposed
One way to judge a cause analysis is by what it changes. Kellogg and colleagues reviewed 302 root cause analyses done at a large academic medical centre over eight years; 106 proposed solutions, 499 in all.
The commonest types among 499 proposed solutions (2017)
The commonest events were complications of procedures, cardiopulmonary arrests, neurological deficits and retained foreign bodies. Several types of event recurred in the eight years despite repeated analyses. The authors conclude that the solutions proposed most often were weak ones, less likely to prevent a recurrence.
Our reading
Judge the analysis by its last line: was the cause checked with data, and does the fix change the process rather than remind people of it?
Source: K. M. Kellogg, Z. Hettinger, M. Shah et al., BMJ Quality & Safety 26(5), 2017
One medical centre. The abstract says 731 solutions; the paper's text and table count 499, the base of the shares. These were root cause analyses in general, not only fishbone diagrams. On stronger and weaker actions, see No. 46.
Tool of the issue
The fishbonecard
One card per problem. Write the effect so it can be measured, fill every bone before choosing, then check the likeliest causes with data. Take the one that holds into a 5 Whys.
01The effectwhat, where, since when, how much: one sentence
02The bonesthe 6Ms or your own; no more than six
03Causes on each bonewhy does it happen? one cause per line
04The three likeliestchosen by the team and circled on the diagram
05Check with datawhat will confirm or rule out each one, who checks, by when
06Action and reviewwhat changes in the process, and when you look again
Sources: ASQ, 2026; Kaoru Ishikawa, JUSE, 1968 (via Secondary summaries)
A practice proposed by the editors, after ASQ's procedure and Ishikawa's types. Count how often each checked cause occurs with a Pareto chart (No. 15); the 5 Whys tool takes one branch further.
Open the tool: 5 Whysstivencatalyst.com/tools/five-whys/
Sources and method
Every figurehas a source.
The figures in this issue come from the sources below. The year shows how recent each one is.
- Guide to Quality ControlKaoru Ishikawa, JUSE, 1968 · via Secondary summaries
- Root Cause Analysis: A Framework for Tool SelectionA. Mark Doggett, Quality Management Journal 12(4), 2005https://doi.org/10.1080/10686967.2005.11919269
- What is a Fishbone Diagram? Ishikawa Cause & Effect DiagramASQ, 2026https://asq.org/quality-resources/fishbone
- Revisiting Ishikawa's Original Seven Basic Tools of Quality Control: A Global Study and Some New InsightsJiju Antony, Olivia McDermott & Michael Sony, IEEE Transactions on Engineering Management 70(11), 2021https://doi.org/10.1109/TEM.2021.3095245
- The problem with root cause analysisM. F. Peerally, S. Carr, J. Waring & M. Dixon-Woods, BMJ Quality & Safety 26(5), 2017https://doi.org/10.1136/bmjqs-2016-005511
- Our current approach to root cause analysis: is it contributing to our failure to improve patient safety?K. M. Kellogg, Z. Hettinger, M. Shah et al., BMJ Quality & Safety 26(5), 2017https://pubmed.ncbi.nlm.nih.gov/27940638/
Editorial method
Each figure was checked for its year, its publisher and what exactly it measures. Where the publisher's page could not be opened, the figure was checked against independent summaries and is marked “via”. The editors' interpretation is marked “Our reading”. Figures that could not be confirmed are not in the issue.
ManagementReview
Management without theatre.
Every issue, one management question, checked against the best research.
All issues
stivencatalyst.com/magazine/management-review.html
Management Review · No. 76 · November 2026 · Stiven Catalyst
Click or swipe a page to turn it. The arrow keys work too.
Management Review · No. 76
The figures of the issue
The charts of the printed pages, with their sources.
Source: K. M. Kellogg, Z. Hettinger, M. Shah et al., BMJ Quality & Safety 26(5), 2017
The whole text Read the issue as text For reading on a small screen, searching or a screen reader. The same words, without the page design.
In this issue
When something goes wrong, the first explanation offered is usually a single cause, often a person. The Ishikawa diagram makes a team write down every cause it can think of, sorted into groups, before it chooses one. This issue asks where the diagram came from, how it is drawn, and what it can and cannot prove.
Kaoru Ishikawa is credited with the first diagram, in 1943, and counted it among seven basic tools he said could solve 95% of problems at work; in a survey published in 2021, fewer than a quarter of 397 quality professionals trained in them went that far. ASQ's procedure starts from one effect and generic categories such as the 6Ms. Patient-safety researchers warn that “root cause” suggests a single one. At one medical centre, eight years of analyses ended most often in training, process change and policy.
Stiven Janaqi, Editor
Cover story
Sor ting the causes
Kaoru Ishikawa is credited with drawing the first cause-and-effect diagram in 1943, to show engineers at Kawasaki Steel how the many factors behind a result could be sorted and related to one another.
- The head. the effect: one problem, written in a box on the right
- The bones. the main categories of causes, branching off the spine
- The small bones. causes and sub-causes, found by asking why it happens
The shape gave it its other name, the fishbone. Ishikawa counted it among seven basic quality tools, with the check sheet, the Pareto chart, the histogram, the scatter diagram, stratification and the control chart.
Our reading
The diagram does not find the cause. It stops a team from settling on the first one that comes to mind.
The 1943 story as Doggett (2005) tells it; Ishikawa's own account was not available to us, and other accounts give other dates and places. ASQ lists the names fishbone, cause-and-effect and Ishikawa diagram.
Sources: A. Mark Doggett, Quality Management Journal 12(4), 2005; Kaoru Ishikawa, JUSE, 1968 (via Secondary summaries); ASQ, 2026
The numbers
Widely used, modestly trusted
Ishikawa held that seven basic tools, used skilfully, could solve 95% of problems at work. In a study published in 2021, Jiju Antony, Olivia McDermott and Michael Sony put the claim to 456 senior quality professionals on five continents.
- 456 senior quality professionals answered the online survey
- < 25% of the 397 trained in the tools thought they can solve over 95% of quality problems
The Pareto chart was the most widely used of the seven, scatter diagrams and stratification the least; the tools were used most in production and least in IT and finance.
Our reading
Professionals use the tools widely and expect less of them than their author did. That is the right frame of mind for the diagram.
Self-reports in an online survey. Those not trained in the tools stopped after the first questions; the 25% is of the 397 who went on (90 of 397). Ishikawa's 95% as the authors quote it.
Source: Jiju Antony, Olivia McDermott & Michael Sony, IEEE Transactions on Engineering Management 70(11), 2021
The model
How t o draw one
ASQ's procedure, which cites Nancy Tague's Quality Toolbox, starts with the team agreeing on one problem statement, the effect, and writing it in a box on the right, at the end of a horizontal spine.
The four steps (ASQ)
- Name the effect. one problem, agreed
- Choose the bones. the main categories
- Ask why. each answer is a cause
- Ask again. sub-causes off each cause
Manufacturing: the 6Ms
- Methods
- Machinery
- Materials
- Measurement
- Manpower
- Mother Nature
What the y cover (ASQ)
- Machinery: equipment, software
- Methods: procedures, regulations
- Manpower: training, skills
- Mother Nature: the environment
- Sometimes a seventh M: money
Our reading
The people bone is the easy one. “Careless operator” ends the search; why the process let the slip through is the next question.
Ishikawa introduced the 6Ms as generic labels but encouraged teams to name their own (ASQ). The right column shortens ASQ's notes on the categories.
Source: ASQ, 2026
More in the essay: Pareto and 5 Why in practice, not in PowerPoint
What the research says
Three t ypes, one warning
Ishikawa described three ways to build the diagram. They differ in what forms the bones: the sources of variation, the steps of the process, or a free list of causes sorted afterwards.
- Dispersion analysis. the bones are sources of variation, such as the 6Ms
- Process classification. the spine follows the steps; causes branch off each one
- Cause enumeration. all possible causes listed first, then grouped and related
Writing on root cause analysis in patient safety, Mohammad Farhad Peerally, Susan Carr, Justin Waring and Mary Dixon-Woods (2017) argue that the method spread with too little attention to what made it work where it came from, and that the term “root cause” suggests a single cause and invites stories that are too simple.
Our reading
Most problems have several causes acting together. A diagram with one bone circled is a place to start checking, not a verdict.
The three types as Doggett (2005) summarises Ishikawa's guide; we did not see the book. On blame after errors, see No. 50.
Sources: Kaoru Ishikawa, JUSE, 1968 (via Secondary summaries); M. F. Peerally, S. Carr, J. Waring & M. Dixon-Woods, BMJ Quality & Safety 26(5), 2017
How it is measured
What the analyses proposed
One way to judge a cause analysis is by what it changes. Kellogg and colleagues reviewed 302 root cause analyses done at a large academic medical centre over eight years; 106 proposed solutions, 499 in all.
The commonest types among 499 proposed solutions (2017): Training 20%, Process change 19.6%, Policy reinforcement 15.2%.
The commonest events were complications of procedures, cardiopulmonary arrests, neurological deficits and retained foreign bodies. Several types of event recurred in the eight years despite repeated analyses. The authors conclude that the solutions proposed most often were weak ones, less likely to prevent a recurrence.
Our reading
Judge the analysis by its last line: was the cause checked with data, and does the fix change the process rather than remind people of it?
One medical centre. The abstract says 731 solutions; the paper's text and table count 499, the base of the shares. These were root cause analyses in general, not only fishbone diagrams. On stronger and weaker actions, see No. 46.
Source: K. M. Kellogg, Z. Hettinger, M. Shah et al., BMJ Quality & Safety 26(5), 2017
Tool of the issue
The fishbone card
One card per problem. Write the effect so it can be measured, fill every bone before choosing, then check the likeliest causes with data. Take the one that holds into a 5 Whys.
- The effect what, where, since when, how much: one sentence
- The bones the 6Ms or your own; no more than six
- Causes on each bone why does it happen? one cause per line
- The three likeliest chosen by the team and circled on the diagram
- Check with data what will confirm or rule out each one, who checks, by when
- Action and review what changes in the process, and when you look again
A practice proposed by the editors, after ASQ's procedure and Ishikawa's types. Count how often each checked cause occurs with a Pareto chart (No. 15); the 5 Whys tool takes one branch further.
Sources: ASQ, 2026; Kaoru Ishikawa, JUSE, 1968 (via Secondary summaries)
Open the tool: 5 Whys
Sources and method
Every figure has a source.
The figures in this issue come from the sources below. The year shows how recent each one is.
- Kaoru Ishikawa, JUSE, “Guide to Quality Control”, 1968 (via Secondary summaries).
- A. Mark Doggett, Quality Management Journal 12(4), “Root Cause Analysis: A Framework for Tool Selection”, 2005. https://doi.org/10.1080/10686967.2005.11919269
- ASQ, “What is a Fishbone Diagram? Ishikawa Cause & Effect Diagram”, 2026. https://asq.org/quality-resources/fishbone
- Jiju Antony, Olivia McDermott & Michael Sony, IEEE Transactions on Engineering Management 70(11), “Revisiting Ishikawa's Original Seven Basic Tools of Quality Control: A Global Study and Some New Insights”, 2021. https://doi.org/10.1109/TEM.2021.3095245
- M. F. Peerally, S. Carr, J. Waring & M. Dixon-Woods, BMJ Quality & Safety 26(5), “The problem with root cause analysis”, 2017. https://doi.org/10.1136/bmjqs-2016-005511
- K. M. Kellogg, Z. Hettinger, M. Shah et al., BMJ Quality & Safety 26(5), “Our current approach to root cause analysis: is it contributing to our failure to improve patient safety?”, 2017. https://pubmed.ncbi.nlm.nih.gov/27940638/
Edit orial me thod
Each figure was checked for its year, its publisher and what exactly it measures. Where the publisher's page could not be opened, the figure was checked against independent summaries and is marked “via”. The editors' interpretation is marked “Our reading”. Figures that could not be confirmed are not in the issue.
Management Review · Monthly edition