Activity-based costing traced overhead to the work that uses it, but its interviews and surveys were costly, and many firms gave it up. Kaplan and Anderson replaced the survey with two numbers per resource: the cost of a minute of practical capacity and the minutes each job takes. In their example a department used 83% of its capacity. Studies link ABC with better quality and cycle times, not with profit on average.
Management Review · Second series · November 2026 · No. 73
Cost per unit: time-driven ABC
Why time surveys always add up to 100%, one department costed twice, two numbers per resource, what studies of activity-based costing found, the minutes no one used, and a card for one activity.
- No.
- 73
- Pages
- 10
- Sources
- 6
- Topics
- KPIs
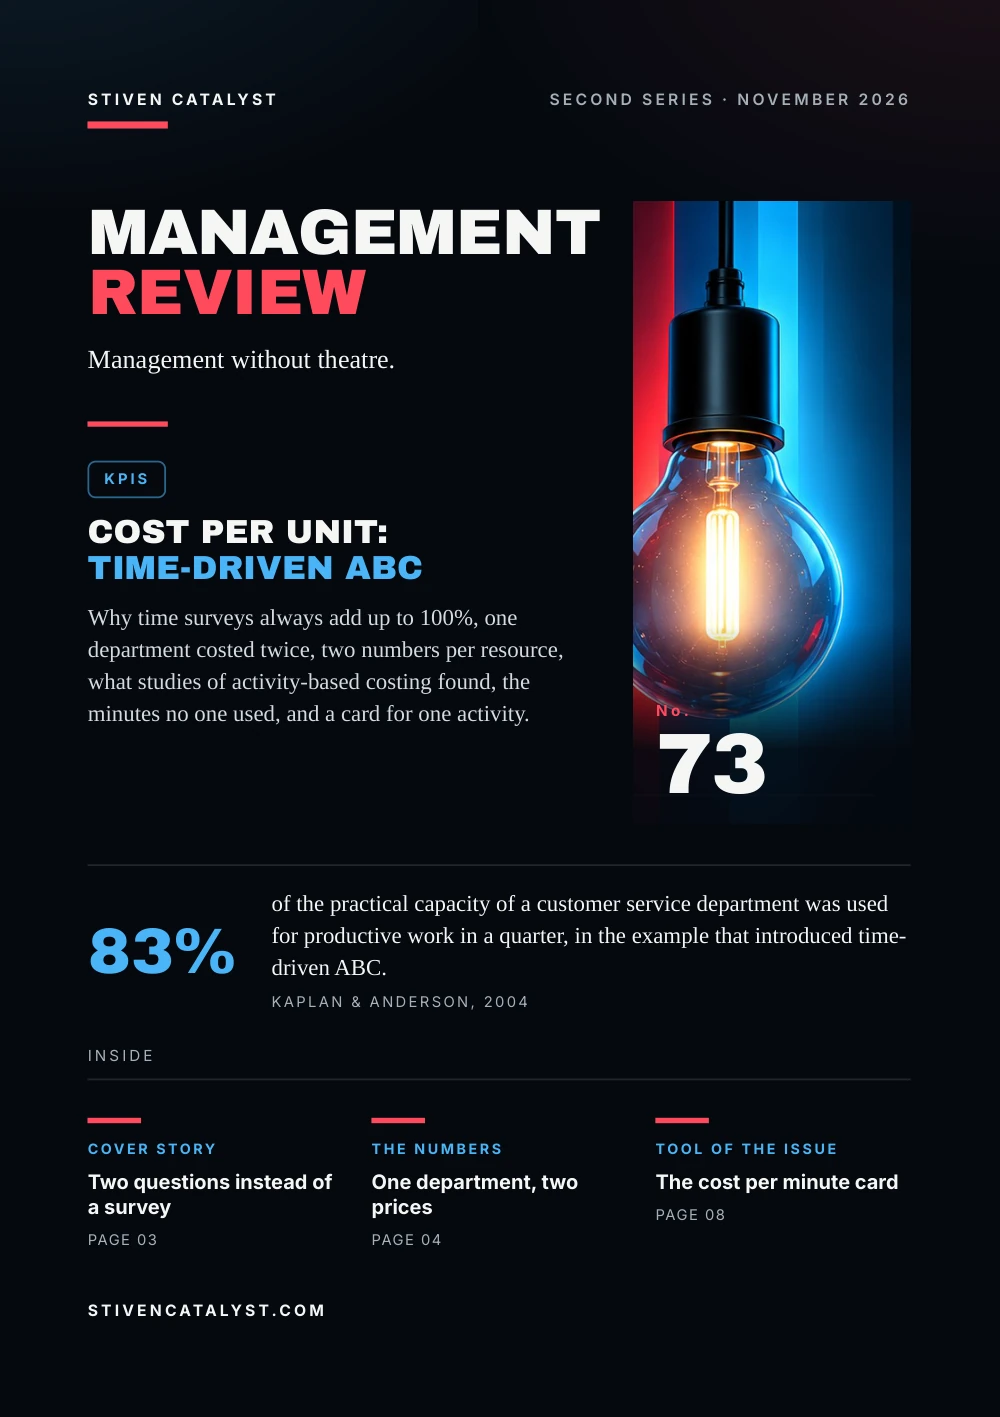
Stiven CatalystSecond series · November 2026
ManagementReview
Management without theatre.
KPIs
Cost per unit:time-driven ABC
Why time surveys always add up to 100%, one department costed twice, two numbers per resource, what studies of activity-based costing found, the minutes no one used, and a card for one activity.

No.73
83%
of the practical capacity of a customer service department was used for productive work in a quarter, in the example that introduced time-driven ABC.Kaplan & Anderson, 2004
stivencatalyst.com
No. 73 · KPIs
In this issue
Every price, every quote and every decision to keep a customer rests on a cost per unit. In most operations a large part of that cost is people's time and the capacity around them. This issue asks how to put a fair price on a minute, and what to do with the minutes no one used.
- 03Cover storyTwo questions instead of a survey
- 04The numbersOne department, two prices
- 05The modelTwo numbers per resource
- 06What the research saysWhat better costs change
- 07How it is measuredUsed and unused
- 08Tool of the issueThe cost per minute card
- 09SourcesSources and method
How to read this issue
Figure
Every figure has its source and year at the foot of its page.
Our reading
Where the editors interpret rather than the research, it says so.
Practice
The steps and the card are proposals to try, not research results.
Cover story
Two questionsinstead of a surve y
In 1988 Robin Cooper and Robert Kaplan argued that traditional cost systems distort product costs: they weight direct labour and materials more heavily than the support work in the factory. Activity-based costing (ABC) traced overhead to activities, then to products.
To learn how time was split between activities, ABC teams interviewed and surveyed staff. In 2004 Kaplan and Steven Anderson wrote that many managers who had tried it on any significant scale had abandoned it, in the face of rising costs and employee irritation.
01
Costly
interviews and surveys in every department, again after every change
02
Subjective
people's own estimates of their time, costly to check
03
Always 100%
the shares add up to a full day, so idle time vanishes into the rates
Our reading
Ask people how they spend their day and the answer always fills the day. Ask how long one order takes, and you can watch it.
Sources: Robin Cooper & Robert S. Kaplan, Harvard Business Review 66(5), 1988; Robert S. Kaplan & Steven R. Anderson, Harvard Business Review 82(11), 2004; Robert S. Kaplan & Steven R. Anderson, Harvard Business School, 2003
The three problems follow Kaplan and Anderson's 2003 working paper and their 2004 article; the grouping is ours.
The numbers
One depar tment,two prices
Kaplan and Anderson's example is a customer service department that costs $560,000 a quarter. In a quarter it handles 49,000 orders, 1,400 customer inquiries and 2,500 credit checks. A survey splits the staff's time 70%, 10% and 20%.
Cost per transaction in the example, $ (2004)
The survey spreads all $560,000 over the work done. The time-driven version takes how long each job lasts, 8, 44 and 50 minutes, times $0.80 a minute. All three rates fall: the survey-based ones also carry the cost of time no one used.
Our reading
A rate that includes idle time looks like a fact. It makes every order look more expensive than the work it takes.
Source: Robert S. Kaplan & Steven R. Anderson, Harvard Business Review 82(11), 2004
An illustration from the source, not a measured company; later versions use slightly different figures. The time-driven rates are the source's too: minutes × $0.80.
The model
Two numbersper resource
Time-driven ABC needs two estimates: what a unit of capacity costs, and how many units each job uses. Capacity is practical, not theoretical, often 80% or 85% of it: people need breaks and training, machines maintenance.
The example, step by step (2004)
- 01
Cost of capacity
$560,000 a quarter: staff, supervision, IT, telecoms
- 02
Practical capacity
700,000 minutes a quarter, about 80% of the time paid
- 03
Cost per minute
$560,000 ÷ 700,000 = $0.80
- 04
Minutes per job
order 8, inquiry 44, credit check 50
Where jobs differ, a time equation replaces new activities. In the working paper, packing takes 0.5 minutes, plus 6.5 for special handling, plus 0.2 if it goes by air; the data are in the order system.
Our reading
Capacity on paper is not capacity. A plan built on every hour paid is wrong, and so is the price built on it.
Sources: Robert S. Kaplan & Steven R. Anderson, Harvard Business Review 82(11), 2004; Robert S. Kaplan & Steven R. Anderson, Harvard Business School, 2003
The 80–85% is the authors' rule of thumb, not a measurement. The chain follows the 2004 example.
More in the essayHigh-volume days: the standard under pressure
What the research says
What be t ter costschange
In 2011 Kaplan and Michael Porter took time-driven ABC to hospitals: existing systems could not measure the cost of one patient's condition over the whole cycle of care. Their seven steps run from choosing the condition, through time estimates and a cost rate per resource, to the total cost of care.
Manufacturing plants, 2002
Ittner, Lanen and Larcker: extensive ABC use went with higher quality and faster cycle times, and through them lower costs; on average, not with return on assets.
Health care, 2017
Keel and colleagues: time-driven ABC can cost processes efficiently, but many studies deviated from the seven steps; its role in bundled payments was not yet shown.
Our reading
A more accurate cost helps where someone acts on it: a process redesigned, a price changed. On its own it changes nothing.
Sources: Robert S. Kaplan & Michael E. Porter, Harvard Business Review 89(9), 2011; Christopher D. Ittner, William N. Lanen & David F. Larcker, Journal of Accounting Research 40(3), 2002 (via Abstract (IDEAS/RePEc)); George Keel, Carl Savage, Muhammad Rafiq & Pamela Mazzocato, Health Policy 121(7), 2017 (via Abstract (PubMed, ScienceDirect) and later reviews)
Ittner et al.: one cross-section of plants, links not causes. Ittner et al. and Keel et al. seen through their abstracts only.
How it is measured
Usedand unused
The time-driven report shows what the survey hid. In the quarter, the three jobs used 578,600 of the 700,000 minutes of practical capacity: 83%. Only that share of the cost, $462,880, goes to orders and customers.
Where the 700,000 minutes went, one quarter (example)
The unused minutes, about $97,120 of the quarter's cost, are capacity paid for and not used. Kaplan and Anderson do not spread them over the work done; they report them, so that managers can act on the excess capacity.
Our reading
Unused capacity is not an error to hide in the rates. It is a decision: cut it, fill it, or keep it on purpose for the peak.
Source: Robert S. Kaplan & Steven R. Anderson, Harvard Business Review 82(11), 2004
Volumes, minutes, 578,600, $462,880 and the $97,120 of unused capacity (121,400 × $0.80) are from the source; the shares of 700,000 are our arithmetic.
Tool of the issue
The cost perminute card
One card per activity or team. Start from the cost of one period and the minutes really available, then time the jobs instead of asking for percentages. At the end, rank them by minutes.
01Resource and perioda team or a machine; a month or a quarter
02Cost of capacitypeople, supervision, equipment, space, systems
03Practical capacityminutes paid, minus breaks, training, meetings, maintenance
04Cost per minuteline 2 divided by line 3
05Time equationminutes for the standard job, plus what each variant adds
06Used and unusedvolumes × minutes; what is left, and what you will do with it
Sources: Robert S. Kaplan & Steven R. Anderson, Harvard Business Review 82(11), 2004; Robert S. Kaplan & Steven R. Anderson, Harvard Business School, 2003
A practice proposed by the editors, after Kaplan and Anderson (2004, 2003). Rank the job types with the Pareto tool.
Open the tool: Pareto 80/20stivencatalyst.com/tools/pareto/
Sources and method
Every figurehas a source.
The figures in this issue come from the sources below. The year shows how recent each one is.
- Measure Costs Right: Make the Right DecisionsRobin Cooper & Robert S. Kaplan, Harvard Business Review 66(5), 1988https://store.hbr.org/product/measure-costs-right-make-the-right-decisions/88503
- Time-Driven Activity-Based CostingRobert S. Kaplan & Steven R. Anderson, Harvard Business Review 82(11), 2004https://hbr.org/2004/11/time-driven-activity-based-costing
- Time-Driven Activity-Based Costing (Working Paper 04-045)Robert S. Kaplan & Steven R. Anderson, Harvard Business School, 2003https://papers.ssrn.com/abstract=485443
- How to Solve the Cost Crisis in Health CareRobert S. Kaplan & Michael E. Porter, Harvard Business Review 89(9), 2011https://hbr.org/2011/09/how-to-solve-the-cost-crisis-in-health-care
- The Association Between Activity-Based Costing and Manufacturing PerformanceChristopher D. Ittner, William N. Lanen & David F. Larcker, Journal of Accounting Research 40(3), 2002 · via Abstract (IDEAS/RePEc)https://doi.org/10.1111/1475-679X.00068
- Time-Driven Activity-Based Costing in Health Care: A Systematic Review of the LiteratureGeorge Keel, Carl Savage, Muhammad Rafiq & Pamela Mazzocato, Health Policy 121(7), 2017 · via Abstract (PubMed, ScienceDirect) and later reviewshttps://doi.org/10.1016/j.healthpol.2017.04.013
Editorial method
Each figure was checked for its year, its publisher and what exactly it measures. Where the publisher's page could not be opened, the figure was checked against independent summaries and is marked “via”. The editors' interpretation is marked “Our reading”. Figures that could not be confirmed are not in the issue.
ManagementReview
Management without theatre.
Every issue, one management question, checked against the best research.
All issues
stivencatalyst.com/magazine/management-review.html
Management Review · No. 73 · November 2026 · Stiven Catalyst
Click or swipe a page to turn it. The arrow keys work too.
Management Review · No. 73
The figures of the issue
The charts of the printed pages, with their sources.
Source: Robert S. Kaplan & Steven R. Anderson, Harvard Business Review 82(11), 2004
Source: Robert S. Kaplan & Steven R. Anderson, Harvard Business Review 82(11), 2004
The whole text Read the issue as text For reading on a small screen, searching or a screen reader. The same words, without the page design.
In this issue
Every price, every quote and every decision to keep a customer rests on a cost per unit. In most operations a large part of that cost is people's time and the capacity around them. This issue asks how to put a fair price on a minute, and what to do with the minutes no one used.
Activity-based costing traced overhead to the work that uses it, but its interviews and surveys were costly, and many firms gave it up. Kaplan and Anderson replaced the survey with two numbers per resource: the cost of a minute of practical capacity and the minutes each job takes. In their example a department used 83% of its capacity. Studies link ABC with better quality and cycle times, not with profit on average.
Stiven Janaqi, Editor
Cover story
Two questions instead of a surve y
In 1988 Robin Cooper and Robert Kaplan argued that traditional cost systems distort product costs: they weight direct labour and materials more heavily than the support work in the factory. Activity-based costing (ABC) traced overhead to activities, then to products.
To learn how time was split between activities, ABC teams interviewed and surveyed staff. In 2004 Kaplan and Steven Anderson wrote that many managers who had tried it on any significant scale had abandoned it, in the face of rising costs and employee irritation.
- Costly. interviews and surveys in every department, again after every change
- Subjective. people's own estimates of their time, costly to check
- Always 100%. the shares add up to a full day, so idle time vanishes into the rates
Our reading
Ask people how they spend their day and the answer always fills the day. Ask how long one order takes, and you can watch it.
The three problems follow Kaplan and Anderson's 2003 working paper and their 2004 article; the grouping is ours.
Sources: Robin Cooper & Robert S. Kaplan, Harvard Business Review 66(5), 1988; Robert S. Kaplan & Steven R. Anderson, Harvard Business Review 82(11), 2004; Robert S. Kaplan & Steven R. Anderson, Harvard Business School, 2003
The numbers
One depar tment, two prices
Kaplan and Anderson's example is a customer service department that costs $560,000 a quarter. In a quarter it handles 49,000 orders, 1,400 customer inquiries and 2,500 credit checks. A survey splits the staff's time 70%, 10% and 20%.
Cost per transaction in the example, $ (2004): Process an order: Survey-based ABC $8.00, Time-driven ABC $6.40; Handle an inquiry: Survey-based ABC $40.00, Time-driven ABC $35.20; Run a credit check: Survey-based ABC $44.80, Time-driven ABC $40.00.
The survey spreads all $560,000 over the work done. The time-driven version takes how long each job lasts, 8, 44 and 50 minutes, times $0.80 a minute. All three rates fall: the survey-based ones also carry the cost of time no one used.
Our reading
A rate that includes idle time looks like a fact. It makes every order look more expensive than the work it takes.
An illustration from the source, not a measured company; later versions use slightly different figures. The time-driven rates are the source's too: minutes × $0.80.
Source: Robert S. Kaplan & Steven R. Anderson, Harvard Business Review 82(11), 2004
The model
Two numbers per resource
Time-driven ABC needs two estimates: what a unit of capacity costs, and how many units each job uses. Capacity is practical, not theoretical, often 80% or 85% of it: people need breaks and training, machines maintenance.
The example, step by step (2004)
- Cost of capaci
t y. $560,000 a quarter: staff, supervision, IT, telecoms - Practical capaci
t y. 700,000 minutes a quarter, about 80% of the time paid - Cost per minute. $560,000 ÷ 700,000 = $0.80
- Minutes per job. order 8, inquiry 44, credit check 50
Where jobs differ, a time equation replaces new activities. In the working paper, packing takes 0.5 minutes, plus 6.5 for special handling, plus 0.2 if it goes by air; the data are in the order system.
Our reading
Capacity on paper is not capacity. A plan built on every hour paid is wrong, and so is the price built on it.
The 80–85% is the authors' rule of thumb, not a measurement. The chain follows the 2004 example.
Sources: Robert S. Kaplan & Steven R. Anderson, Harvard Business Review 82(11), 2004; Robert S. Kaplan & Steven R. Anderson, Harvard Business School, 2003
More in the essay: High-volume days: the standard under pressure
What the research says
What be t ter costs change
In 2011 Kaplan and Michael Porter took time-driven ABC to hospitals: existing systems could not measure the cost of one patient's condition over the whole cycle of care. Their seven steps run from choosing the condition, through time estimates and a cost rate per resource, to the total cost of care.
- Manufacturing plants, 2002. Ittner, Lanen and Larcker: extensive ABC use went with higher quality and faster cycle times, and through them lower costs; on average, not with return on assets.
- Health care, 2017. Keel and colleagues: time-driven ABC can cost processes efficiently, but many studies deviated from the seven steps; its role in bundled payments was not yet shown.
Our reading
A more accurate cost helps where someone acts on it: a process redesigned, a price changed. On its own it changes nothing.
Ittner et al.: one cross-section of plants, links not causes. Ittner et al. and Keel et al. seen through their abstracts only.
Sources: Robert S. Kaplan & Michael E. Porter, Harvard Business Review 89(9), 2011; Christopher D. Ittner, William N. Lanen & David F. Larcker, Journal of Accounting Research 40(3), 2002 (via Abstract (IDEAS/RePEc)); George Keel, Carl Savage, Muhammad Rafiq & Pamela Mazzocato, Health Policy 121(7), 2017 (via Abstract (PubMed, ScienceDirect) and later reviews)
How it is measured
Used and unused
The time-driven report shows what the survey hid. In the quarter, the three jobs used 578,600 of the 700,000 minutes of practical capacity: 83%. Only that share of the cost, $462,880, goes to orders and customers.
Where the 700,000 minutes went, one quarter (example): Orders: 49,000 × 8 min 56%, Credit checks: 2,500 × 50 min 17.9%, Inquiries: 1,400 × 44 min 8.8%, Unused: 121,400 min 17.3%.
The unused minutes, about $97,120 of the quarter's cost, are capacity paid for and not used. Kaplan and Anderson do not spread them over the work done; they report them, so that managers can act on the excess capacity.
Our reading
Unused capacity is not an error to hide in the rates. It is a decision: cut it, fill it, or keep it on purpose for the peak.
Volumes, minutes, 578,600, $462,880 and the $97,120 of unused capacity (121,400 × $0.80) are from the source; the shares of 700,000 are our arithmetic.
Source: Robert S. Kaplan & Steven R. Anderson, Harvard Business Review 82(11), 2004
Tool of the issue
The cost per minute card
One card per activity or team. Start from the cost of one period and the minutes really available, then time the jobs instead of asking for percentages. At the end, rank them by minutes.
- Resource and period a team or a machine; a month or a quarter
- Cost of capaci
t y people, supervision, equipment, space, systems - Practical capaci
t y minutes paid, minus breaks, training, meetings, maintenance - Cost per minute line 2 divided by line 3
- Time equation minutes for the standard job, plus what each variant adds
- Used and unused volumes × minutes; what is left, and what you will do with it
A practice proposed by the editors, after Kaplan and Anderson (2004, 2003). Rank the job types with the Pareto tool.
Sources: Robert S. Kaplan & Steven R. Anderson, Harvard Business Review 82(11), 2004; Robert S. Kaplan & Steven R. Anderson, Harvard Business School, 2003
Open the tool: Pareto 80/20
Sources and method
Every figure has a source.
The figures in this issue come from the sources below. The year shows how recent each one is.
- Robin Cooper & Robert S. Kaplan, Harvard Business Review 66(5), “Measure Costs Right: Make the Right Decisions”, 1988. https://store.hbr.org/product/measure-costs-right-make-the-right-decisions/88503
- Robert S. Kaplan & Steven R. Anderson, Harvard Business Review 82(11), “Time-Driven Activity-Based Costing”, 2004. https://hbr.org/2004/11/time-driven-activity-based-costing
- Robert S. Kaplan & Steven R. Anderson, Harvard Business School, “Time-Driven Activity-Based Costing (Working Paper 04-045)”, 2003. https://papers.ssrn.com/abstract=485443
- Robert S. Kaplan & Michael E. Porter, Harvard Business Review 89(9), “How to Solve the Cost Crisis in Health Care”, 2011. https://hbr.org/2011/09/how-to-solve-the-cost-crisis-in-health-care
- Christopher D. Ittner, William N. Lanen & David F. Larcker, Journal of Accounting Research 40(3), “The Association Between Activity-Based Costing and Manufacturing Performance”, 2002 (via Abstract (IDEAS/RePEc)). https://doi.org/10.1111/1475-679X.00068
- George Keel, Carl Savage, Muhammad Rafiq & Pamela Mazzocato, Health Policy 121(7), “Time-Driven Activity-Based Costing in Health Care: A Systematic Review of the Literature”, 2017 (via Abstract (PubMed, ScienceDirect) and later reviews). https://doi.org/10.1016/j.healthpol.2017.04.013
Edit orial me thod
Each figure was checked for its year, its publisher and what exactly it measures. Where the publisher's page could not be opened, the figure was checked against independent summaries and is marked “via”. The editors' interpretation is marked “Our reading”. Figures that could not be confirmed are not in the issue.
Management Review · Monthly edition