Daniel Kahneman's team expected a textbook in about two years and finished it in eight. In Bent Flyvbjerg's database of more than 16,000 projects, 8.5% came in on budget and on time. Dan Lovallo and Kahneman blamed the inside view, built from the plan alone; Flyvbjerg added deliberate underestimation. Both point to the same remedy, reference class forecasting.
Management Review · Second series · November 2026 · No. 74
Why projects run late and over budge t
A textbook planned for two years that took eight, how few projects hit budget and time, the inside and the outside view, error or misrepresentation, what counts as success, and a card for an estimate.
- No.
- 74
- Pages
- 10
- Sources
- 6
- Topics
- Strategy
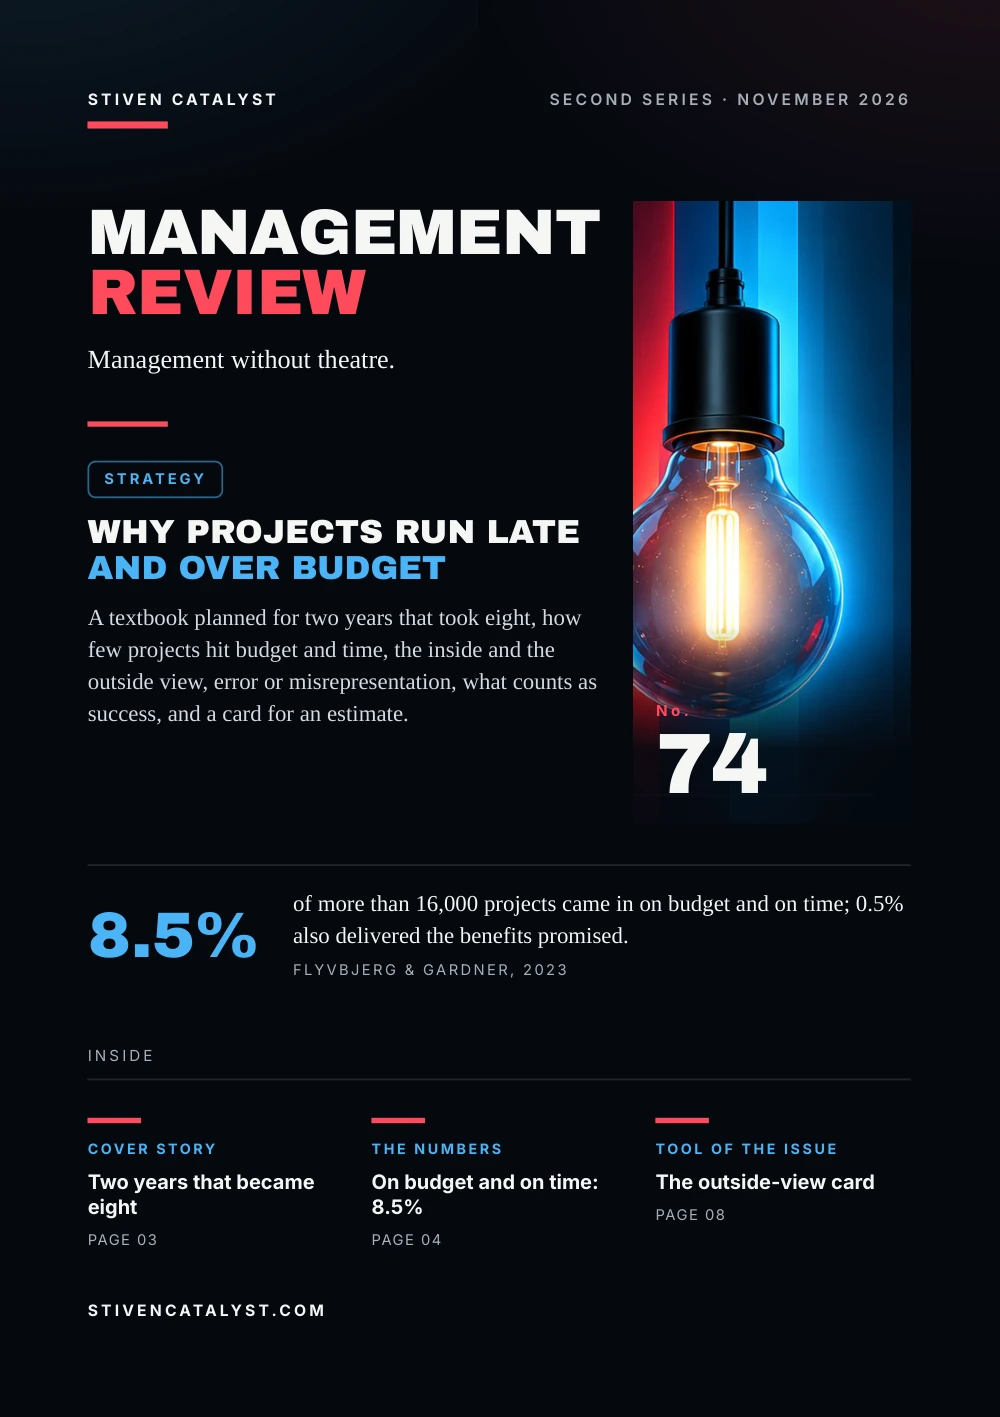
Stiven CatalystSecond series · November 2026
ManagementReview
Management without theatre.
Strategy
Why projects run lateand over budget
A textbook planned for two years that took eight, how few projects hit budget and time, the inside and the outside view, error or misrepresentation, what counts as success, and a card for an estimate.

No.74
8.5%
of more than 16,000 projects came in on budget and on time; 0.5% also delivered the benefits promised.Flyvbjerg & Gardner, 2023
stivencatalyst.com
No. 74 · Strategy
In this issue
Most projects are approved on an estimate made by the people who want to do them. The estimate is built from the plan, step by step, and it rarely asks how similar projects turned out. This issue is about that question and the number it gives.
- 03Cover storyTwo years that became eight
- 04The numbersOn budget and on time
- 05The modelThe inside and the outside view
- 06What the research saysError or misrepresentation?
- 07How it is measuredAgainst which number?
- 08Tool of the issueThe outside-view card
- 09SourcesSources and method
How to read this issue
Figure
Every figure has its source and year at the foot of its page.
Our reading
Where the editors interpret rather than the research, it says so.
Practice
The steps and the card are proposals to try, not research results.
Cover story
Two yearsthat became eight
In the 1970s Daniel Kahneman led a team writing a curriculum and a textbook on judgment and decision making for Israeli high schools. One day he asked each member how long they thought it would take to finish the book.
The answers centred on two years, from one and a half to two and a half. Then he asked Seymour Fox, a curriculum expert on the team, how other teams had done. About 40% never finished, Fox said, and none of the rest took less than seven years or more than ten. His own estimate had been well within the group's optimistic consensus.
“We're below average, but not by much.”
That was Fox's view of the team against the others. The team carried on as if nothing had happened. The book was finished eight years later.
Our reading
Fox had the record in his head. It came out only when the question was about other teams, not about this one.
Source: Daniel Kahneman, McKinsey Quarterly, 2011
Kahneman's own account, in an excerpt of Thinking, Fast and Slow published by McKinsey Quarterly (2011). Lovallo and Kahneman (2003) call this the planning fallacy; for the thesis study that measured it, see No. 44.
The numbers
On budge tand on time
Bent Flyvbjerg and his colleagues have collected cost and schedule data on more than 16,000 projects in over 20 fields and 136 countries, going back to 1910. In How Big Things Get Done (2023) he and Dan Gardner count how many hit all three marks.
Projects in the Flyvbjerg database, share (2023)
27%average cost overrun in 1,471 IT projects (Flyvbjerg & Budzier, 2011)
1 in 6was a black swan: costs 200% over on average, schedule almost 70% over
Our reading
The average is not the risk. The risk is the one project in six that goes far beyond it.
Sources: Bent Flyvbjerg & Dan Gardner, 2023 (via Reviews and summaries of the book); Bent Flyvbjerg & Alexander Budzier, Harvard Business Review 89(9), 2011
The database holds projects of every size, most of them large; it is a collection, not a random sample. We read the book's figures in reviews of it, not in the book itself.
The model
The insideand the outside view
Dan Lovallo and Daniel Kahneman (2003) trace bad forecasts to the inside view: the estimate is built from the project's own tasks and obstacles. The outside view sets those aside and asks how similar projects turned out. Flyvbjerg (2006) set it out in three steps.
- 01
Reference class
Past projects, broad enough to count, close enough to compare.
- 02
Distribution
How their costs and times really came out.
- 03
Position
Where this project sits, and how far to move the estimate.
Edinburgh tram line 2, cost forecast in £ million
Our reading
A reserve sized by hope is spent before the work begins. Size it from the record.
Sources: Dan Lovallo & Daniel Kahneman, Harvard Business Review 81(7), 2003; Bent Flyvbjerg, Project Management Journal 37(3), 2006
An early use of the method: 46 comparable rail projects. The promoters' £320 million already held 25% for contingency; the class asked for 40% or 57%. A planning forecast; we report no outcome.
More in the essayHigh-volume days: the standard under pressure
What the research says
Erroror misrepresentation?
Optimism, in Lovallo and Kahneman's account, is an honest delusion. Flyvbjerg names a second cause, strategic misrepresentation. His evidence came from 258 transport projects worth US$90 billion (2002).
Average cost overrun by type, 258 transport projects (2002)
The authors weighed technical, economic, psychological and political explanations. Underestimation, they concluded, cannot be explained by error and is best explained by strategic misrepresentation, that is, lying.
Our reading
Both causes have one remedy: an estimate checked against the record by someone who does not need the project approved.
Sources: Bent Flyvbjerg, Mette Skamris Holm & Søren Buhl, Journal of the American Planning Association 68(3), 2002; Dan Lovallo & Daniel Kahneman, Harvard Business Review 81(7), 2003
The 2002 sample covers transport only, and a statistical pattern does not prove intent in a single case.
How it is measured
Againstwhich number?
An overrun depends on its baseline. Flyvbjerg and his colleagues judge a project against the estimates used to decide whether to build it. Flyvbjerg and Gardner then count three marks at once.
Cost
actual cost against the estimate at the decision
Time
actual finish against the date promised at the decision
Benefits
what the project delivers against what its case promised
“The cost estimates used to decide whether important infrastructure should be built are highly and systematically misleading.”
Our reading
A budget re-based halfway through can make a late, costly project look on plan. Keep the numbers from the day of the decision, and choose the measure before the project starts.
Sources: Bent Flyvbjerg, Mette Skamris Holm & Søren Buhl, Journal of the American Planning Association 68(3), 2002; Bent Flyvbjerg & Dan Gardner, 2023 (via Reviews and summaries of the book)
The quote is from the abstract of Flyvbjerg, Holm and Buhl (2002), 258 transport projects. The three rows are our summary of these baselines; the 2023 figures are on page 4.
Tool of the issue
The outside-viewcard
Fill it in before the estimate is approved: first the inside view, then the record, then the gap. Afterwards log the planned and the actual dates; Delay Analyzer keeps the same kind of log for routes.
01Inside viewour cost and time, built from the plan
02Reference classsimilar finished projects, ours or others', and how many
03What they tooktypical and worst overrun in cost and time
04Our positionwhy we would do better or worse, in writing
05Estimate and reservethe number we commit to, and how sure we are of it
06Afterwardsactual cost and date, added to the class
Sources: Bent Flyvbjerg, Project Management Journal 37(3), 2006; Dan Lovallo & Daniel Kahneman, Harvard Business Review 81(7), 2003
A practice proposed by the editors, after the three steps of Flyvbjerg (2006) and the outside view of Lovallo and Kahneman (2003). Once the number is set, a pre-mortem (No. 44) tests the plan behind it.
Open the tool: Delay Analyzerstivencatalyst.com/tools/delay-analyzer/
Sources and method
Every figurehas a source.
The figures in this issue come from the sources below. The year shows how recent each one is.
- Daniel Kahneman: Beware the ‘inside view’ (excerpt from Thinking, Fast and Slow)Daniel Kahneman, McKinsey Quarterly, 2011https://www.mckinsey.com/capabilities/strategy-and-corporate-finance/our-insights/daniel-kahneman-beware-the-inside-view
- How Big Things Get DoneBent Flyvbjerg & Dan Gardner, 2023 · via Reviews and summaries of the book
- Why Your IT Project May Be Riskier Than You ThinkBent Flyvbjerg & Alexander Budzier, Harvard Business Review 89(9), 2011https://hbr.org/2011/09/why-your-it-project-may-be-riskier-than-you-think
- Delusions of Success: How Optimism Undermines Executives' DecisionsDan Lovallo & Daniel Kahneman, Harvard Business Review 81(7), 2003https://hbr.org/2003/07/delusions-of-success-how-optimism-undermines-executives-decisions
- From Nobel Prize to Project Management: Getting Risks RightBent Flyvbjerg, Project Management Journal 37(3), 2006https://doi.org/10.1177/875697280603700302
- Underestimating Costs in Public Works Projects: Error or Lie?Bent Flyvbjerg, Mette Skamris Holm & Søren Buhl, Journal of the American Planning Association 68(3), 2002https://ppp.worldbank.org/library/underestimating-costs-public-works-projects-error-or-lie
Editorial method
Each figure was checked for its year, its publisher and what exactly it measures. Where the publisher's page could not be opened, the figure was checked against independent summaries and is marked “via”. The editors' interpretation is marked “Our reading”. Figures that could not be confirmed are not in the issue.
ManagementReview
Management without theatre.
Every issue, one management question, checked against the best research.
All issues
stivencatalyst.com/magazine/management-review.html
Management Review · No. 74 · November 2026 · Stiven Catalyst
Click or swipe a page to turn it. The arrow keys work too.
Management Review · No. 74
The figures of the issue
The charts of the printed pages, with their sources.
Source: Bent Flyvbjerg & Dan Gardner, 2023 (via Reviews and summaries of the book)
Source: Bent Flyvbjerg, Project Management Journal 37(3), 2006
Source: Bent Flyvbjerg, Mette Skamris Holm & Søren Buhl, Journal of the American Planning Association 68(3), 2002
The whole text Read the issue as text For reading on a small screen, searching or a screen reader. The same words, without the page design.
In this issue
Most projects are approved on an estimate made by the people who want to do them. The estimate is built from the plan, step by step, and it rarely asks how similar projects turned out. This issue is about that question and the number it gives.
Daniel Kahneman's team expected a textbook in about two years and finished it in eight. In Bent Flyvbjerg's database of more than 16,000 projects, 8.5% came in on budget and on time. Dan Lovallo and Kahneman blamed the inside view, built from the plan alone; Flyvbjerg added deliberate underestimation. Both point to the same remedy, reference class forecasting.
Stiven Janaqi, Editor
Cover story
Two years that became eight
In the 1970s Daniel Kahneman led a team writing a curriculum and a textbook on judgment and decision making for Israeli high schools. One day he asked each member how long they thought it would take to finish the book.
The answers centred on two years, from one and a half to two and a half. Then he asked Seymour Fox, a curriculum expert on the team, how other teams had done. About 40% never finished, Fox said, and none of the rest took less than seven years or more than ten. His own estimate had been well within the group's optimistic consensus.
We're below average, but not by much.
That was Fox's view of the team against the others. The team carried on as if nothing had happened. The book was finished eight years later.
Our reading
Fox had the record in his head. It came out only when the question was about other teams, not about this one.
Kahneman's own account, in an excerpt of Thinking, Fast and Slow published by McKinsey Quarterly (2011). Lovallo and Kahneman (2003) call this the planning fallacy; for the thesis study that measured it, see No. 44.
Source: Daniel Kahneman, McKinsey Quarterly, 2011
The numbers
On budge t and on time
Bent Flyvbjerg and his colleagues have collected cost and schedule data on more than 16,000 projects in over 20 fields and 136 countries, going back to 1910. In How Big Things Get Done (2023) he and Dan Gardner count how many hit all three marks.
Projects in the Flyvbjerg database, share (2023): Over budget, late, or both 91.5%, On budget and on time 8.5%, …and with the benefits promised 0.5%.
- 27% average cost overrun in 1,471 IT projects (Flyvbjerg & Budzier, 2011)
- 1 in 6 was a black swan: costs 200% over on average, schedule almost 70% over
Our reading
The average is not the risk. The risk is the one project in six that goes far beyond it.
The database holds projects of every size, most of them large; it is a collection, not a random sample. We read the book's figures in reviews of it, not in the book itself.
Sources: Bent Flyvbjerg & Dan Gardner, 2023 (via Reviews and summaries of the book); Bent Flyvbjerg & Alexander Budzier, Harvard Business Review 89(9), 2011
The model
The inside and the outside view
Dan Lovallo and Daniel Kahneman (2003) trace bad forecasts to the inside view: the estimate is built from the project's own tasks and obstacles. The outside view sets those aside and asks how similar projects turned out. Flyvbjerg (2006) set it out in three steps.
- Reference class. Past projects, broad enough to count, close enough to compare.
- Distribution. How their costs and times really came out.
- Position. Where this project sits, and how far to move the estimate.
Edinburgh tram line 2, cost forecast in £ million: Promoters 320, 50% certain 357, 80% certain 400.
Our reading
A reserve sized by hope is spent before the work begins. Size it from the record.
An early use of the method: 46 comparable rail projects. The promoters' £320 million already held 25% for contingency; the class asked for 40% or 57%. A planning forecast; we report no outcome.
Sources: Dan Lovallo & Daniel Kahneman, Harvard Business Review 81(7), 2003; Bent Flyvbjerg, Project Management Journal 37(3), 2006
More in the essay: High-volume days: the standard under pressure
What the research says
Error or misrepresentation?
Optimism, in Lovallo and Kahneman's account, is an honest delusion. Flyvbjerg names a second cause, strategic misrepresentation. His evidence came from 258 transport projects worth US$90 billion (2002).
Average cost overrun by type, 258 transport projects (2002): All projects 28%, Rail (58 projects) 45%, Bridges and tunnels (33) 34%, Roads (167) 20%.
The authors weighed technical, economic, psychological and political explanations. Underestimation, they concluded, cannot be explained by error and is best explained by strategic misrepresentation, that is, lying.
Our reading
Both causes have one remedy: an estimate checked against the record by someone who does not need the project approved.
The 2002 sample covers transport only, and a statistical pattern does not prove intent in a single case.
Sources: Bent Flyvbjerg, Mette Skamris Holm & Søren Buhl, Journal of the American Planning Association 68(3), 2002; Dan Lovallo & Daniel Kahneman, Harvard Business Review 81(7), 2003
How it is measured
Against which number?
An overrun depends on its baseline. Flyvbjerg and his colleagues judge a project against the estimates used to decide whether to build it. Flyvbjerg and Gardner then count three marks at once.
- Cost. actual cost against the estimate at the decision
- Time. actual finish against the date promised at the decision
- Benefits. what the project delivers against what its case promised
The cost estimates used to decide whether important infrastructure should be built are highly and systematically misleading.
Our reading
A budget re-based halfway through can make a late, costly project look on plan. Keep the numbers from the day of the decision, and choose the measure before the project starts.
The quote is from the abstract of Flyvbjerg, Holm and Buhl (2002), 258 transport projects. The three rows are our summary of these baselines; the 2023 figures are on page 4.
Sources: Bent Flyvbjerg, Mette Skamris Holm & Søren Buhl, Journal of the American Planning Association 68(3), 2002; Bent Flyvbjerg & Dan Gardner, 2023 (via Reviews and summaries of the book)
Tool of the issue
The outside-view card
Fill it in before the estimate is approved: first the inside view, then the record, then the gap. Afterwards log the planned and the actual dates; Delay Analyzer keeps the same kind of log for routes.
- Inside view our cost and time, built from the plan
- Reference class similar finished projects, ours or others', and how many
- What th
e yt ook typical and worst overrun in cost and time - Our position why we would do better or worse, in writing
- Estimate and reserve the number we commit to, and how sure we are of it
- A
f terwards actual cost and date, added to the class
A practice proposed by the editors, after the three steps of Flyvbjerg (2006) and the outside view of Lovallo and Kahneman (2003). Once the number is set, a pre-mortem (No. 44) tests the plan behind it.
Sources: Bent Flyvbjerg, Project Management Journal 37(3), 2006; Dan Lovallo & Daniel Kahneman, Harvard Business Review 81(7), 2003
Open the tool: Delay Analyzer
Sources and method
Every figure has a source.
The figures in this issue come from the sources below. The year shows how recent each one is.
- Daniel Kahneman, McKinsey Quarterly, “Daniel Kahneman: Beware the ‘inside view’ (excerpt from Thinking, Fast and Slow)”, 2011. https://www.mckinsey.com/capabilities/strategy-and-corporate-finance/our-insights/daniel-kahneman-beware-the-inside-view
- Bent Flyvbjerg & Dan Gardner, “How Big Things Get Done”, 2023 (via Reviews and summaries of the book).
- Bent Flyvbjerg & Alexander Budzier, Harvard Business Review 89(9), “Why Your IT Project May Be Riskier Than You Think”, 2011. https://hbr.org/2011/09/why-your-it-project-may-be-riskier-than-you-think
- Dan Lovallo & Daniel Kahneman, Harvard Business Review 81(7), “Delusions of Success: How Optimism Undermines Executives' Decisions”, 2003. https://hbr.org/2003/07/delusions-of-success-how-optimism-undermines-executives-decisions
- Bent Flyvbjerg, Project Management Journal 37(3), “From Nobel Prize to Project Management: Getting Risks Right”, 2006. https://doi.org/10.1177/875697280603700302
- Bent Flyvbjerg, Mette Skamris Holm & Søren Buhl, Journal of the American Planning Association 68(3), “Underestimating Costs in Public Works Projects: Error or Lie?”, 2002. https://ppp.worldbank.org/library/underestimating-costs-public-works-projects-error-or-lie
Edit orial me thod
Each figure was checked for its year, its publisher and what exactly it measures. Where the publisher's page could not be opened, the figure was checked against independent summaries and is marked “via”. The editors' interpretation is marked “Our reading”. Figures that could not be confirmed are not in the issue.
Management Review · Monthly edition