At Bing, a small idea waited more than six months and then raised revenue by 12%. At Microsoft, only one in three tested ideas improved what it was meant to improve. The Model for Improvement tests a change on a small scale: one day, one unit. In 126 government trials, effects were far smaller than in published studies. Four checks show when to trust a result, and a card helps plan the pilot.
Management Review · Second series · November 2026 · No. 69
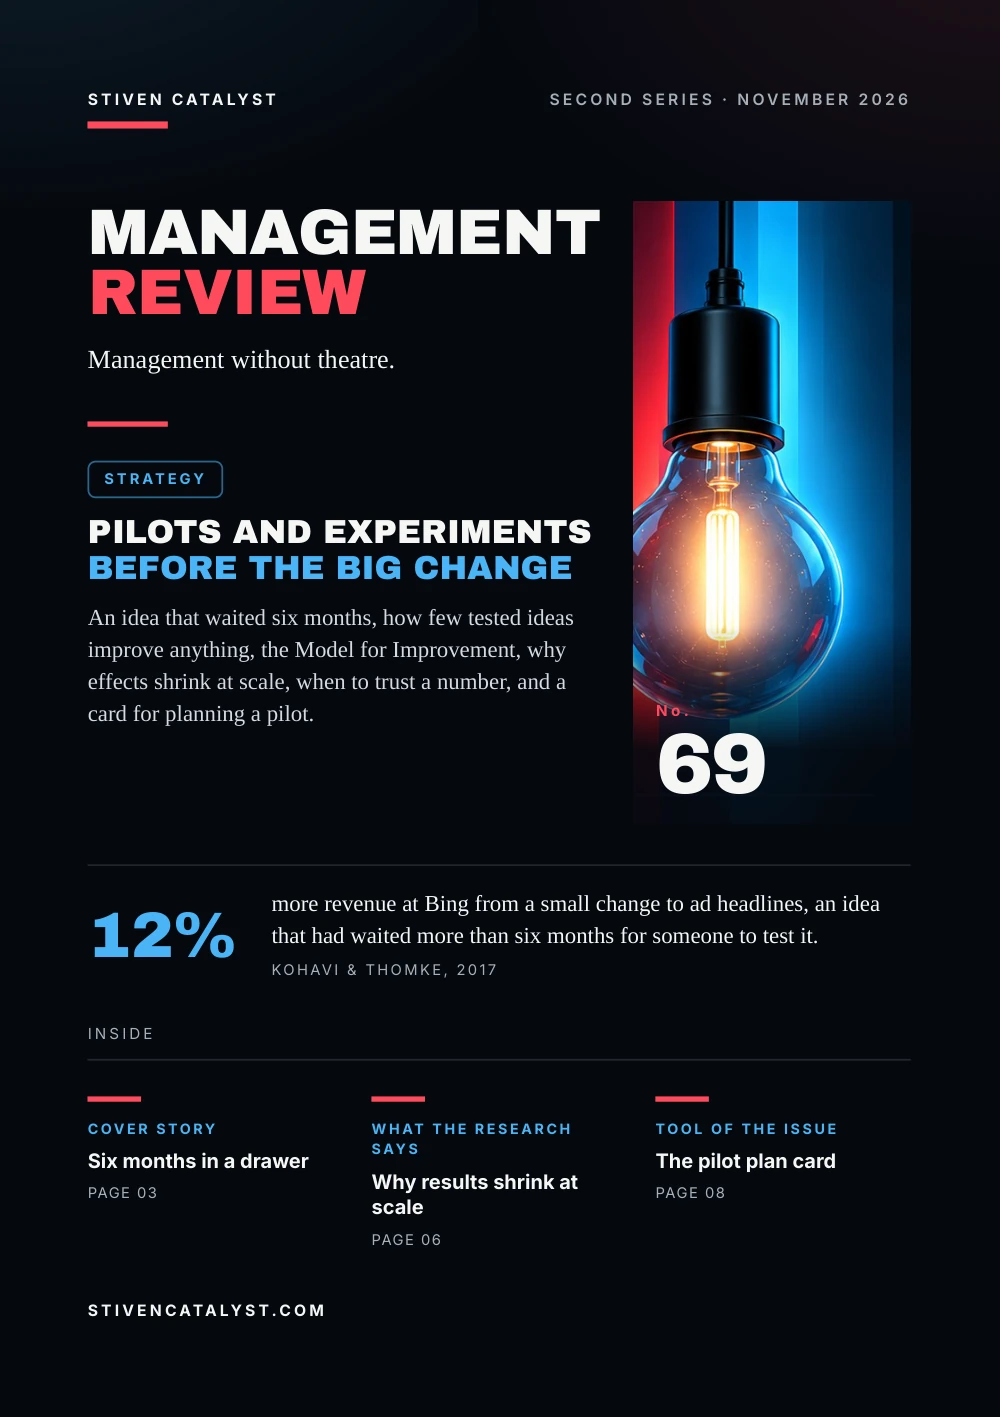
Pilots and experiments before the big change
An idea that waited six months, how few tested ideas improve anything, the Model for Improvement, why effects shrink at scale, when to trust a number, and a card for planning a pilot.
- No.
- 69
- Pages
- 10
- Sources
- 6
- Topics
- Strategy
Stiven CatalystSecond series · November 2026
ManagementReview
Management without theatre.
Strategy
Pilots and experimentsbefore the big change
An idea that waited six months, how few tested ideas improve anything, the Model for Improvement, why effects shrink at scale, when to trust a number, and a card for planning a pilot.

No.69
12%
more revenue at Bing from a small change to ad headlines, an idea that had waited more than six months for someone to test it.Kohavi & Thomke, 2017
stivencatalyst.com
No. 69 · Strategy
In this issue
Big changes are usually decided on conviction: a plan, a budget, a launch date. This issue is about trying the change small first, against a comparison group and with a decision rule agreed before the start, so that the result decides, not the loudest opinion.
- 03Cover storySix months in a drawer
- 04The numbersMost ideas do not work
- 05The modelThree questions, small cycles
- 06What the research saysWhy results shrink at scale
- 07How it is measuredNumbers you can trust
- 08Tool of the issueThe pilot plan card
- 09SourcesSources and method
How to read this issue
Figure
Every figure has its source and year at the foot of its page.
Our reading
Where the editors interpret rather than the research, it says so.
Practice
The steps and the card are proposals to try, not research results.
Cover story
Six monthsin a drawer
In 2012 a Microsoft employee working on the Bing search engine proposed changing how ad headlines were displayed. It would take an engineer a few days, but it was one of hundreds of ideas, and the program managers rated it low priority.
The idea waited more than six months. Then an engineer, seeing how little the code would cost, launched a simple A/B test: users were assigned at random to the old headlines or the new ones. Within hours revenue rose so fast that it set off a “too good to be true” alert. Such alerts usually signal a bug. This time they did not.
6+months the idea waited, rated low priority
12%more revenue, without hurting key user-experience metrics
$100M+a year in the US alone, by the authors' estimate
Our reading
No meeting could have ranked this idea correctly. A cheap test answered in hours what months of setting priorities had not.
Source: Ron Kohavi & Stefan Thomke, Harvard Business Review 95(5), 2017 (via HBR reprint R1705E)
Kohavi and Thomke call it the best revenue-generating idea in Bing's history. The 12% was measured in the test; the $100 million is their annual figure for the US.
The numbers
Most ideasdo not work
Companies that test almost every change learn the same lesson, write Ron Kohavi and Stefan Thomke: most new ideas fail in experiments, and even experts often misjudge which ones will pay off. At Microsoft as a whole:
Ideas tested in experiments at Microsoft, by result
- 1 in 3prove effective
- 1 in 3have neutral results
- 1 in 3have negative results
In well-optimised products such as Google and Bing, only about 10–20% of experiments give positive results; at Slack, about 30% of monetisation experiments (2019). Thomke puts the average at about 10%.
Our reading
If two in three plausible ideas change nothing or make things worse, rolling out a big change untested is a bet, not a decision.
Sources: Ron Kohavi & Stefan Thomke, Harvard Business Review 95(5), 2017 (via HBR reprint R1705E); Ron Kohavi, Diane Tang & Ya Xu, Cambridge University Press, 2020 (via Chapter 1, published by the authors); Stefan H. Thomke, Harvard Business Review Press, 2020 (via Michael Blanding, "Creating the Experimentation Organization", HBS Working Knowledge, 2019)
Online products, where tests are cheap; for shop floors we found no comparable shares. Slack: a post quoted by Kohavi, Tang & Xu; Thomke's 10%: an interview (2019).
The model
Three questions,small cycles
The Model for Improvement, from Associates in Process Improvement and set out in The Improvement Guide (Langley and colleagues, 2009), asks three questions before anything is changed for good.
01
Aim
What are we trying to accomplish?
02
Measure
How will we know that a change is an improvement?
03
Change
What change can we make that will result in improvement?
Testing the change: the Plan-Do-Study-Act cycle
- 01
Plan
- 02
Do
- 03
Study
- 04
Act
Plan the change, try it, study the results, act on what was learned. The test is small on purpose: the Institute for Healthcare Improvement's example is one patient, one day. After several cycles under varying conditions, such as day and night, the change is made permanent and spread.
Our reading
A pilot is not a soft launch. It is a question with a deadline: does this change, here, do better than what we do now?
Source: Langley, Moen, Nolan, Nolan, Norman & Provost, Jossey-Bass, 2009 (via Institute for Healthcare Improvement, "Model for Improvement")
The questions and steps follow the Institute for Healthcare Improvement's page on the model; the book itself was not seen. The reading is the editors'.
More in the essayDMAIC without a black belt
What the research says
Why resultsshrink at scale
Stefano DellaVigna and Elizabeth Linos gathered 126 randomised trials with 23 million people, all run by two large “nudge units” of the US government, and compared them with nudge trials published in academic journals.
Average effect of a nudge on take-up, percentage points
The published trials were small: the median treatment group had 484 people, against 10,006 in the nudge units. Small trials can only detect large effects, and journals mostly print what is detected. Selective publication, made worse by low statistical power, explains about 70% of the gap; differences between the nudges explain most of the rest.
Our reading
The success story you read about is the one that got published. Plan for the rollout to deliver less than the pilot that convinced you.
Source: Stefano DellaVigna & Elizabeth Linos, Econometrica 90(1), 2022
Take-up: the share who do what is asked, such as enrolling or getting vaccinated. Effects and the 70% from Econometrica (2022); group sizes from the 2020 working paper.
How it is measured
Numbers youcan trust
“Getting numbers is easy; getting numbers you can trust is hard,” write Kohavi and Thomke. Four checks before a pilot result decides:
Compare with a control group
At Yahoo, an observational study put the effect of display ads on brand searches at 871–1,198%; a controlled experiment found 5.4%.
Agree one main measure and guardrails
Before the start, not after; guardrails are what must not get worse.
Run at least a full week
LinkedIn measures for at least a week: a single day over-represents heavy users.
Check the split, doubt the surprise
Unplanned group sizes often void a result. Twyman's law: any figure that looks interesting or different is usually wrong.
Hypothetical example, a new picking route in a warehouse
- Comparison
- zone A new route, zone B as before, the same two weeks
- Main measure
- lines picked per hour: A +6%, B +4%
- Guardrail
- picking errors: unchanged in both
Against zone B, the route is worth about 2 points, not 6. The numbers are invented.
Sources: Ron Kohavi & Stefan Thomke, Harvard Business Review 95(5), 2017 (via HBR reprint R1705E); Ron Kohavi, Diane Tang & Ya Xu, Cambridge University Press, 2020 (via Chapter 1, published by the authors); Ya Xu, Weitao Duan & Shaochen Huang, KDD '18 (ACM), 2018
Checks after Kohavi & Thomke (2017), Kohavi, Tang & Xu (2020) and, for the week, Xu et al. (2018). The example is the editors'.
Tool of the issue
The pilotplan card
Fill it in before the start, with those who will run the pilot. Then roll out in steps: a small group first, a measuring stage, then everyone.
01Hypothesisif we change X, Y improves by about Z, because …
02What changesone change, so clear that anyone could repeat it
03Where and how longone area, shift or team; at least a full normal week
04What is measuredone main measure, how it is counted, and the guardrails
05Comparison groupwhere the current way goes on, the same days
06Decision ruleset before the start: roll out, adjust or stop, and who decides
Sources: Langley, Moen, Nolan, Nolan, Norman & Provost, Jossey-Bass, 2009 (via Institute for Healthcare Improvement, "Model for Improvement"); Ya Xu, Weitao Duan & Shaochen Huang, KDD '18 (ACM), 2018; Stefan H. Thomke, Harvard Business Review Press, 2020 (via Michael Blanding, "Creating the Experimentation Organization", HBS Working Knowledge, 2019)
A practice proposed by the editors, after the Model for Improvement, Xu et al. (2018) and Thomke's rule: a testable hypothesis, a control group, and abiding by the results.
Open the tool: Sigma & Control Chartstivencatalyst.com/tools/sigma-control-chart/
Sources and method
Every figurehas a source.
The figures in this issue come from the sources below. The year shows how recent each one is.
- The Surprising Power of Online ExperimentsRon Kohavi & Stefan Thomke, Harvard Business Review 95(5), 2017 · via HBR reprint R1705Ehttps://hbr.org/2017/09/the-surprising-power-of-online-experiments
- Trustworthy Online Controlled Experiments: A Practical Guide to A/B TestingRon Kohavi, Diane Tang & Ya Xu, Cambridge University Press, 2020 · via Chapter 1, published by the authorshttps://experimentguide.com/
- Experimentation Works: The Surprising Power of Business ExperimentsStefan H. Thomke, Harvard Business Review Press, 2020 · via Michael Blanding, "Creating the Experimentation Organization", HBS Working Knowledge, 2019https://www.library.hbs.edu/working-knowledge/creating-the-experimentation-organization
- The Improvement Guide: A Practical Approach to Enhancing Organizational Performance (2nd ed.)Langley, Moen, Nolan, Nolan, Norman & Provost, Jossey-Bass, 2009 · via Institute for Healthcare Improvement, "Model for Improvement"https://www.ihi.org/resources/how-improve-model-improvement
- RCTs to Scale: Comprehensive Evidence from Two Nudge UnitsStefano DellaVigna & Elizabeth Linos, Econometrica 90(1), 2022https://doi.org/10.3982/ECTA18709
- SQR: Balancing Speed, Quality and Risk in Online ExperimentsYa Xu, Weitao Duan & Shaochen Huang, KDD '18 (ACM), 2018https://doi.org/10.1145/3219819.3219875
Editorial method
Each figure was checked for its year, its publisher and what exactly it measures. Where the publisher's page could not be opened, the figure was checked against independent summaries and is marked “via”. The editors' interpretation is marked “Our reading”. Figures that could not be confirmed are not in the issue.
ManagementReview
Management without theatre.
Every issue, one management question, checked against the best research.
All issues
stivencatalyst.com/magazine/management-review.html
Management Review · No. 69 · November 2026 · Stiven Catalyst
Click or swipe a page to turn it. The arrow keys work too.
Management Review · No. 69
The figures of the issue
The charts of the printed pages, with their sources.
- 1 in 3prove effective
- 1 in 3have neutral results
- 1 in 3have negative results
- 1 in 3prove effective
- 1 in 3have neutral results
- 1 in 3have negative results
Source: Ron Kohavi & Stefan Thomke, Harvard Business Review 95(5), 2017 (via HBR reprint R1705E)
Source: Stefano DellaVigna & Elizabeth Linos, Econometrica 90(1), 2022
The whole text Read the issue as text For reading on a small screen, searching or a screen reader. The same words, without the page design.
In this issue
Big changes are usually decided on conviction: a plan, a budget, a launch date. This issue is about trying the change small first, against a comparison group and with a decision rule agreed before the start, so that the result decides, not the loudest opinion.
At Bing, a small idea waited more than six months and then raised revenue by 12%. At Microsoft, only one in three tested ideas improved what it was meant to improve. The Model for Improvement tests a change on a small scale: one day, one unit. In 126 government trials, effects were far smaller than in published studies. Four checks show when to trust a result, and a card helps plan the pilot.
Stiven Janaqi, Editor
Cover story
Six months in a drawer
In 2012 a Microsoft employee working on the Bing search engine proposed changing how ad headlines were displayed. It would take an engineer a few days, but it was one of hundreds of ideas, and the program managers rated it low priority.
The idea waited more than six months. Then an engineer, seeing how little the code would cost, launched a simple A/B test: users were assigned at random to the old headlines or the new ones. Within hours revenue rose so fast that it set off a “too good to be true” alert. Such alerts usually signal a bug. This time they did not.
- 6+ months the idea waited, rated low priority
- 12% more revenue, without hurting key user-experience metrics
- $100M+ a year in the US alone, by the authors' estimate
Our reading
No meeting could have ranked this idea correctly. A cheap test answered in hours what months of setting priorities had not.
Kohavi and Thomke call it the best revenue-generating idea in Bing's history. The 12% was measured in the test; the $100 million is their annual figure for the US.
Source: Ron Kohavi & Stefan Thomke, Harvard Business Review 95(5), 2017 (via HBR reprint R1705E)
The numbers
Most ideas do not work
Companies that test almost every change learn the same lesson, write Ron Kohavi and Stefan Thomke: most new ideas fail in experiments, and even experts often misjudge which ones will pay off. At Microsoft as a whole:
Ideas tested in experiments at Microsoft, by result: 1 in 3 prove effective, 1 in 3 have neutral results, 1 in 3 have negative results.
In well-optimised products such as Google and Bing, only about 10–20% of experiments give positive results; at Slack, about 30% of monetisation experiments (2019). Thomke puts the average at about 10%.
Our reading
If two in three plausible ideas change nothing or make things worse, rolling out a big change untested is a bet, not a decision.
Online products, where tests are cheap; for shop floors we found no comparable shares. Slack: a post quoted by Kohavi, Tang & Xu; Thomke's 10%: an interview (2019).
Sources: Ron Kohavi & Stefan Thomke, Harvard Business Review 95(5), 2017 (via HBR reprint R1705E); Ron Kohavi, Diane Tang & Ya Xu, Cambridge University Press, 2020 (via Chapter 1, published by the authors); Stefan H. Thomke, Harvard Business Review Press, 2020 (via Michael Blanding, "Creating the Experimentation Organization", HBS Working Knowledge, 2019)
The model
Three questions, small cycles
The Model for Improvement, from Associates in Process Improvement and set out in The Improvement Guide (Langley and colleagues, 2009), asks three questions before anything is changed for good.
- Aim. What are we trying to accomplish?
- Measure. How will we know that a change is an improvement?
- Change. What change can we make that will result in improvement?
Testing the change: the Plan-Do-Study-Act cycle
- Plan.
- Do.
- Study.
- Act.
Plan the change, try it, study the results, act on what was learned. The test is small on purpose: the Institute for Healthcare Improvement's example is one patient, one day. After several cycles under varying conditions, such as day and night, the change is made permanent and spread.
Our reading
A pilot is not a soft launch. It is a question with a deadline: does this change, here, do better than what we do now?
The questions and steps follow the Institute for Healthcare Improvement's page on the model; the book itself was not seen. The reading is the editors'.
Source: Langley, Moen, Nolan, Nolan, Norman & Provost, Jossey-Bass, 2009 (via Institute for Healthcare Improvement, "Model for Improvement")
More in the essay: DMAIC without a black belt
What the research says
Why results shrink at scale
Stefano DellaVigna and Elizabeth Linos gathered 126 randomised trials with 23 million people, all run by two large “nudge units” of the US government, and compared them with nudge trials published in academic journals.
Average effect of a nudge on take-up, percentage points: In journals 8.7, At scale 1.4.
The published trials were small: the median treatment group had 484 people, against 10,006 in the nudge units. Small trials can only detect large effects, and journals mostly print what is detected. Selective publication, made worse by low statistical power, explains about 70% of the gap; differences between the nudges explain most of the rest.
Our reading
The success story you read about is the one that got published. Plan for the rollout to deliver less than the pilot that convinced you.
Take-up: the share who do what is asked, such as enrolling or getting vaccinated. Effects and the 70% from Econometrica (2022); group sizes from the 2020 working paper.
Source: Stefano DellaVigna & Elizabeth Linos, Econometrica 90(1), 2022
How it is measured
Numbers you can trust
“Getting numbers is easy; getting numbers you can trust is hard,” write Kohavi and Thomke. Four checks before a pilot result decides:
- Compare with a control group. At Yahoo, an observational study put the effect of display ads on brand searches at 871–1,198%; a controlled experiment found 5.4%.
- Agree one main measure and guardrails. Before the start, not after; guardrails are what must not get worse.
- Run at least a full week. LinkedIn measures for at least a week: a single day over-represents heavy users.
- Check the split, doubt the surprise. Unplanned group sizes often void a result. Twyman's law: any figure that looks interesting or different is usually wrong.
Hypothe tical example, a new picking route in a warehouse
- Comparison: zone A new route, zone B as before, the same two weeks
- Main measure: lines picked per hour: A +6%, B +4%
- Guardrail: picking errors: unchanged in both
Against zone B, the route is worth about 2 points, not 6. The numbers are invented.
Checks after Kohavi & Thomke (2017), Kohavi, Tang & Xu (2020) and, for the week, Xu et al. (2018). The example is the editors'.
Sources: Ron Kohavi & Stefan Thomke, Harvard Business Review 95(5), 2017 (via HBR reprint R1705E); Ron Kohavi, Diane Tang & Ya Xu, Cambridge University Press, 2020 (via Chapter 1, published by the authors); Ya Xu, Weitao Duan & Shaochen Huang, KDD '18 (ACM), 2018
Tool of the issue
The pilot plan card
Fill it in before the start, with those who will run the pilot. Then roll out in steps: a small group first, a measuring stage, then everyone.
- Hypothesis if we change X, Y improves by about Z, because …
- What changes one change, so clear that anyone could repeat it
- Where and how long one area, shift or team; at least a full normal week
- What is measured one main measure, how it is counted, and the guardrails
- Comparison group where the current way goes on, the same days
- Decision rule set before the start: roll out, adjust or stop, and who decides
A practice proposed by the editors, after the Model for Improvement, Xu et al. (2018) and Thomke's rule: a testable hypothesis, a control group, and abiding by the results.
Sources: Langley, Moen, Nolan, Nolan, Norman & Provost, Jossey-Bass, 2009 (via Institute for Healthcare Improvement, "Model for Improvement"); Ya Xu, Weitao Duan & Shaochen Huang, KDD '18 (ACM), 2018; Stefan H. Thomke, Harvard Business Review Press, 2020 (via Michael Blanding, "Creating the Experimentation Organization", HBS Working Knowledge, 2019)
Open the tool: Sigma & Control Chart
Sources and method
Every figure has a source.
The figures in this issue come from the sources below. The year shows how recent each one is.
- Ron Kohavi & Stefan Thomke, Harvard Business Review 95(5), “The Surprising Power of Online Experiments”, 2017 (via HBR reprint R1705E). https://hbr.org/2017/09/the-surprising-power-of-online-experiments
- Ron Kohavi, Diane Tang & Ya Xu, Cambridge University Press, “Trustworthy Online Controlled Experiments: A Practical Guide to A/B Testing”, 2020 (via Chapter 1, published by the authors). https://experimentguide.com/
- Stefan H. Thomke, Harvard Business Review Press, “Experimentation Works: The Surprising Power of Business Experiments”, 2020 (via Michael Blanding, "Creating the Experimentation Organization", HBS Working Knowledge, 2019). https://www.library.hbs.edu/working-knowledge/creating-the-experimentation-organization
- Langley, Moen, Nolan, Nolan, Norman & Provost, Jossey-Bass, “The Improvement Guide: A Practical Approach to Enhancing Organizational Performance (2nd ed.)”, 2009 (via Institute for Healthcare Improvement, "Model for Improvement"). https://www.ihi.org/resources/how-improve-model-improvement
- Stefano DellaVigna & Elizabeth Linos, Econometrica 90(1), “RCTs to Scale: Comprehensive Evidence from Two Nudge Units”, 2022. https://doi.org/10.3982/ECTA18709
- Ya Xu, Weitao Duan & Shaochen Huang, KDD '18 (ACM), “SQR: Balancing Speed, Quality and Risk in Online Experiments”, 2018. https://doi.org/10.1145/3219819.3219875
Edit orial me thod
Each figure was checked for its year, its publisher and what exactly it measures. Where the publisher's page could not be opened, the figure was checked against independent summaries and is marked “via”. The editors' interpretation is marked “Our reading”. Figures that could not be confirmed are not in the issue.
Management Review · Monthly edition