At one retailer, 65% of inventory records did not match a physical count, and the errors gathered by product category more than by store. A US government guide of 2002 shows how leading companies count the important items more often and measure accuracy against a tolerance. Research shows that small undetected losses can empty shelves, that the count itself can create errors, and what helped: full-time staff and RFID.
Management Review · Second series · November 2026 · No. 68
Invent ory accuracy and cycle counting
Two records in three that do not match the shelf, where the errors gather, counting what matters more often, small losses that empty shelves, how accuracy is measured, and a card for one count.
- No.
- 68
- Pages
- 10
- Sources
- 7
- Topics
- KPIs
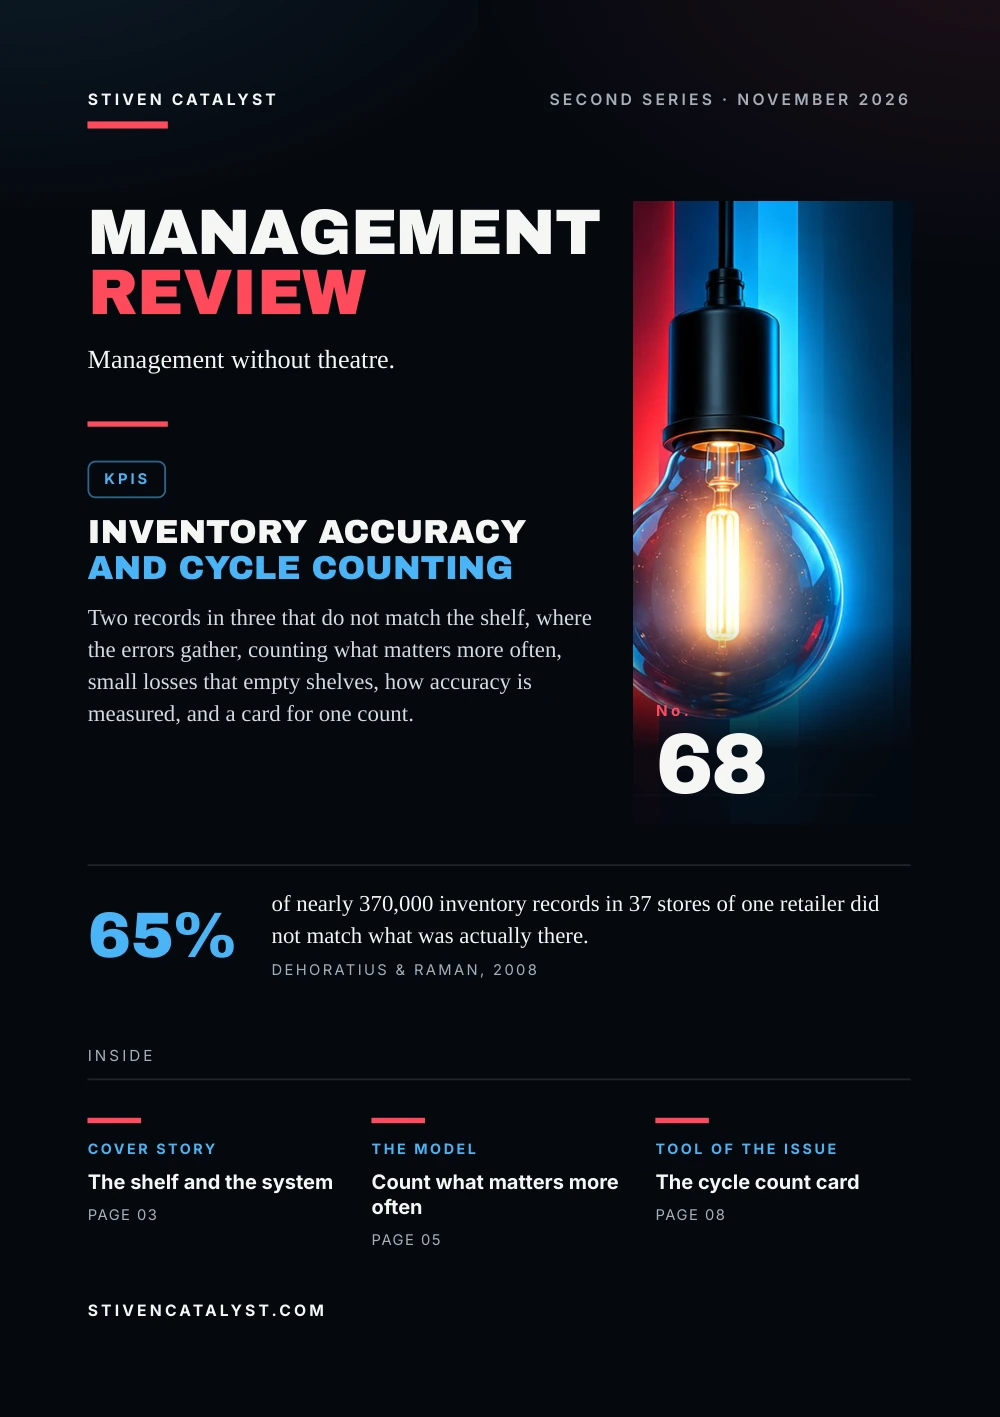
Stiven CatalystSecond series · November 2026
ManagementReview
Management without theatre.
KPIs
Inventory accuracyand cycle counting
Two records in three that do not match the shelf, where the errors gather, counting what matters more often, small losses that empty shelves, how accuracy is measured, and a card for one count.

No.68
65%
of nearly 370,000 inventory records in 37 stores of one retailer did not match what was actually there.DeHoratius & Raman, 2008
stivencatalyst.com
No. 68 · KPIs
In this issue
Every order, every replenishment and every promise to a customer starts from a number in the system: how many are there. This issue asks how often that number is wrong, why, and how a team keeps it close to the shelf without stopping work for a full stocktake.
- 03Cover storyThe shelf and the system
- 04The numbersWhere the errors gather
- 05The modelCount what matters more often
- 06What the research saysSmall losses, empty shelves
- 07How it is measuredCount blind, then measure
- 08Tool of the issueThe cycle count card
- 09SourcesSources and method
How to read this issue
Figure
Every figure has its source and year at the foot of its page.
Our reading
Where the editors interpret rather than the research, it says so.
Practice
The steps and the card are proposals to try, not research results.
Cover story
The shelfand the system
Retailers had invested heavily in planning systems, wrote Ananth Raman, Nicole DeHoratius and Zeynep Ton in 2001, yet they struggled with execution. At one leading retailer, 65% of inventory records were inaccurate: the recorded level did not reflect what was actually there.
01
Loss
goods leave the backroom or the shelf and no transaction records it
02
Recording
a receipt, a sale or a correction booked wrongly, or not at all
03
Misplacement
the item is in the store, but not where anyone looks for it
At another leading retailer, misplaced items kept one in six customers who asked staff for help from finding products that were in the store. The authors put the cost at more than 10% of profits; stores of one chain, with identical IT, differed widely.
Our reading
The system knows only what it was told. Every unrecorded movement becomes a wrong number, and the next order is planned from it.
Sources: Ananth Raman, Nicole DeHoratius & Zeynep Ton, California Management Review 43(3), 2001 (via Abstract at California Management Review); Howard Hao-Chun Chuang & Rogelio Oliva, Journal of Operations Management 39–40, 2015 (via Abstract at OpenAlex)
The 65% may come from the same retailer as the study on the next page. The three kinds of error follow Raman et al. and Chuang & Oliva; the grouping is the editors'.
The numbers
Where theerrors gather
Nicole DeHoratius and Ananth Raman checked nearly 370,000 inventory records in 37 stores of one retailer against physical counts, then asked where the differences cluster.
of the records did not match the physical count.
Share of the total variance in record inaccuracy, 2008
The product category accounted for almost ten times as much of the variance as the store. Auditing practices reduced inaccuracy; a more complex store environment and the distribution structure increased it.
Our reading
Errors are not spread evenly. They gather in certain kinds of product, and that is where to count first.
Source: Nicole DeHoratius & Ananth Raman, Management Science 54(4), 2008 (via Abstract at IDEAS/RePEc and OpenAlex)
One retailer, published 2008. Any difference from the count makes a record inaccurate; the size of the gaps is not shown here.
The model
Count what mat tersmore of ten
In 2002 the US General Accounting Office (GAO) studied 12 locations of seven companies known for inventory management. Some counted everything at one point in time; most used cycle counting: a portion daily, weekly or monthly, until all stock has been counted.
Counts per year at one location, by segment (share of items)
Items were ranked by value times activity. At another company, with some 80 facilities, a site could switch to cycle counting only after a wall-to-wall count and accuracy above 95%. It began at four full cycles a year; getting down to one took about six years. Below 95%, a full count was due again.
Our reading
Cycle counting is earned: it works where the records are already close to right.
Source: US General Accounting Office, 2002
The segments are one plant's work in process; at the 12 locations, frequencies ranged from daily to less than yearly. Cycle counting needs a system that books every movement; all seven companies had one.
What the research says
Small losses,emp t y shelves
Yun Kang and Stanley Gershwin at MIT modelled stock that disappears without the system noticing. Even a small rate of undetected loss disrupted replenishment and led to severe out-of-stocks; the sales lost could far outweigh the goods lost. Lean systems with little stock were even more sensitive.
~26%less record inaccuracy with RFID, one category, 13 stores, 23 weeks
up to 81%in five categories and 62 stores; in some, no significant effect
In a simulation, Howard Hao-Chun Chuang and Rogelio Oliva found loss in the backroom and on the shelf to be the main driver; recording and shelving errors mattered little. In five stores of a global chain, full-time staff reduced inaccuracy, part-time staff did not. In 1960, R. F. Rinehart found that about 80% of the discrepancies in a federal supply facility came from the procedures meant to correct them.
Our reading
A record that is too high is the dangerous one: the system sees stock and does not reorder. And a careless count writes a new error into the system.
Sources: Yun Kang & Stanley B. Gershwin, IIE Transactions 37(9), 2005 (via Abstract at OpenAlex; Kang's MIT thesis (2004) at DSpace@MIT); Bill C. Hardgrave, John A. Aloysius & Sandeep Goyal, Production and Operations Management 22(4), 2013 (via Abstract at OpenAlex); Howard Hao-Chun Chuang & Rogelio Oliva, Journal of Operations Management 39–40, 2015 (via Abstract at OpenAlex); R. F. Rinehart, Operations Research 8(4), 1960 (via Abstract at OpenAlex)
Kang & Gershwin: models, not field data. Hardgrave et al.: field experiments at one global retailer. Rinehart: one facility; the sources were counting and adjusting balances.
How it is measured
Count blind,then measure
GAO's guide gives the common measure: records found accurate, divided by records counted, times 100. What counts as accurate is set by a tolerance, the range within which a count may differ from the record and still be correct.
Count blind
Item and location, not the quantity: at 10 of 12 locations.
Recount differences
Usually two or three counts, ideally by someone else.
Find the cause
Transactions, receipts and shipments, the same day or the next.
Correct and code
Adjust with approval and give the cause a code.
Hypothetical example, a week of counts in one zone
- Accuracy
- 184 of 200 records within tolerance: 92%
- Adjustments
- +40 and −36 units: net +4, gross 76
The net figure looks harmless; the gross shows how much was wrong. The numbers are invented.
Source: US General Accounting Office, 2002
Experts put the goal at 95% or more (GAO, after Brooks & Wilson); six of eight cycle-counting locations aimed at 95–98%, with tolerances of 0–5%. Those that coded causes used 22 codes on average.
More in the essayWhere part of the order goes missing
Tool of the issue
The cyclecount card
One card per location counted. Write the counted quantity before you look at the system, and give every difference a cause. After a month, rank the causes.
01Item and locationitem number, description, exact location
02Counted quantitycounted blind; a recount if it differs
03System quantityfilled in only after the count
04Difference and toleranceunits, and whether it is within the tolerance
05Causea code: receipt, picking, wrong location, loss, count error
06Correctionwho approved it, when, and what changes in the process
Sources: US General Accounting Office, 2002; R. F. Rinehart, Operations Research 8(4), 1960 (via Abstract at OpenAlex)
A practice proposed by the editors, after GAO (2002): blind counts, recounts, research and cause codes. A count error is a cause too, after Rinehart (1960). Rank the codes with the Pareto tool.
Open the tool: Pareto 80/20stivencatalyst.com/tools/pareto/
Sources and method
Every figurehas a source.
The figures in this issue come from the sources below. The year shows how recent each one is.
- Execution: The Missing Link in Retail OperationsAnanth Raman, Nicole DeHoratius & Zeynep Ton, California Management Review 43(3), 2001 · via Abstract at California Management Reviewhttps://doi.org/10.2307/41166093
- Inventory Record Inaccuracy: An Empirical AnalysisNicole DeHoratius & Ananth Raman, Management Science 54(4), 2008 · via Abstract at IDEAS/RePEc and OpenAlexhttps://doi.org/10.1287/mnsc.1070.0789
- Executive Guide: Best Practices in Achieving Consistent, Accurate Physical Counts of Inventory and Related Property (GAO-02-447G)US General Accounting Office, 2002https://www.gao.gov/products/gao-02-447g
- Information inaccuracy in inventory systems: stock loss and stockoutYun Kang & Stanley B. Gershwin, IIE Transactions 37(9), 2005 · via Abstract at OpenAlex; Kang's MIT thesis (2004) at DSpace@MIThttps://doi.org/10.1080/07408170590969861
- Inventory record inaccuracy: Causes and labor effectsHoward Hao-Chun Chuang & Rogelio Oliva, Journal of Operations Management 39–40, 2015 · via Abstract at OpenAlexhttps://doi.org/10.1016/j.jom.2015.07.006
- RFID-Enabled Visibility and Retail Inventory Record Inaccuracy: Experiments in the FieldBill C. Hardgrave, John A. Aloysius & Sandeep Goyal, Production and Operations Management 22(4), 2013 · via Abstract at OpenAlexhttps://doi.org/10.1111/poms.12010
- Effects and Causes of Discrepancies in Supply OperationsR. F. Rinehart, Operations Research 8(4), 1960 · via Abstract at OpenAlexhttps://doi.org/10.1287/opre.8.4.543
Editorial method
Each figure was checked for its year, its publisher and what exactly it measures. Where the publisher's page could not be opened, the figure was checked against independent summaries and is marked “via”. The editors' interpretation is marked “Our reading”. Figures that could not be confirmed are not in the issue.
ManagementReview
Management without theatre.
Every issue, one management question, checked against the best research.
All issues
stivencatalyst.com/magazine/management-review.html
Management Review · No. 68 · November 2026 · Stiven Catalyst
Click or swipe a page to turn it. The arrow keys work too.
Management Review · No. 68
The figures of the issue
The charts of the printed pages, with their sources.
65% of the records did not match the physical count.
Source: Nicole DeHoratius & Ananth Raman, Management Science 54(4), 2008 (via Abstract at IDEAS/RePEc and OpenAlex)
Source: Nicole DeHoratius & Ananth Raman, Management Science 54(4), 2008 (via Abstract at IDEAS/RePEc and OpenAlex)
Source: US General Accounting Office, 2002
The whole text Read the issue as text For reading on a small screen, searching or a screen reader. The same words, without the page design.
In this issue
Every order, every replenishment and every promise to a customer starts from a number in the system: how many are there. This issue asks how often that number is wrong, why, and how a team keeps it close to the shelf without stopping work for a full stocktake.
At one retailer, 65% of inventory records did not match a physical count, and the errors gathered by product category more than by store. A US government guide of 2002 shows how leading companies count the important items more often and measure accuracy against a tolerance. Research shows that small undetected losses can empty shelves, that the count itself can create errors, and what helped: full-time staff and RFID.
Stiven Janaqi, Editor
Cover story
The shelf and the system
Retailers had invested heavily in planning systems, wrote Ananth Raman, Nicole DeHoratius and Zeynep Ton in 2001, yet they struggled with execution. At one leading retailer, 65% of inventory records were inaccurate: the recorded level did not reflect what was actually there.
- Loss. goods leave the backroom or the shelf and no transaction records it
- Recording. a receipt, a sale or a correction booked wrongly, or not at all
- Misplacement. the item is in the store, but not where anyone looks for it
At another leading retailer, misplaced items kept one in six customers who asked staff for help from finding products that were in the store. The authors put the cost at more than 10% of profits; stores of one chain, with identical IT, differed widely.
Our reading
The system knows only what it was told. Every unrecorded movement becomes a wrong number, and the next order is planned from it.
The 65% may come from the same retailer as the study on the next page. The three kinds of error follow Raman et al. and Chuang & Oliva; the grouping is the editors'.
Sources: Ananth Raman, Nicole DeHoratius & Zeynep Ton, California Management Review 43(3), 2001 (via Abstract at California Management Review); Howard Hao-Chun Chuang & Rogelio Oliva, Journal of Operations Management 39–40, 2015 (via Abstract at OpenAlex)
The numbers
Where the errors gather
Nicole DeHoratius and Ananth Raman checked nearly 370,000 inventory records in 37 stores of one retailer against physical counts, then asked where the differences cluster.
65% of the records did not match the physical count.
Share of the total variance in record inaccuracy, 2008: Between product categories 26.4%, Between stores 2.7%.
The product category accounted for almost ten times as much of the variance as the store. Auditing practices reduced inaccuracy; a more complex store environment and the distribution structure increased it.
Our reading
Errors are not spread evenly. They gather in certain kinds of product, and that is where to count first.
One retailer, published 2008. Any difference from the count makes a record inaccurate; the size of the gaps is not shown here.
Source: Nicole DeHoratius & Ananth Raman, Management Science 54(4), 2008 (via Abstract at IDEAS/RePEc and OpenAlex)
The model
Count what mat ters more of ten
In 2002 the US General Accounting Office (GAO) studied 12 locations of seven companies known for inventory management. Some counted everything at one point in time; most used cycle counting: a portion daily, weekly or monthly, until all stock has been counted.
Counts per year at one location, by segment (share of items): A · top 10% 4×, B · 20% 3×, C · 30% 2×, D · 40% 1×.
Items were ranked by value times activity. At another company, with some 80 facilities, a site could switch to cycle counting only after a wall-to-wall count and accuracy above 95%. It began at four full cycles a year; getting down to one took about six years. Below 95%, a full count was due again.
Our reading
Cycle counting is earned: it works where the records are already close to right.
The segments are one plant's work in process; at the 12 locations, frequencies ranged from daily to less than yearly. Cycle counting needs a system that books every movement; all seven companies had one.
Source: US General Accounting Office, 2002
What the research says
Small losses, emp t y shelves
Yun Kang and Stanley Gershwin at MIT modelled stock that disappears without the system noticing. Even a small rate of undetected loss disrupted replenishment and led to severe out-of-stocks; the sales lost could far outweigh the goods lost. Lean systems with little stock were even more sensitive.
- ~26% less record inaccuracy with RFID, one category, 13 stores, 23 weeks
- up
t o 81% in five categories and 62 stores; in some, no significant effect
In a simulation, Howard Hao-Chun Chuang and Rogelio Oliva found loss in the backroom and on the shelf to be the main driver; recording and shelving errors mattered little. In five stores of a global chain, full-time staff reduced inaccuracy, part-time staff did not. In 1960, R. F. Rinehart found that about 80% of the discrepancies in a federal supply facility came from the procedures meant to correct them.
Our reading
A record that is too high is the dangerous one: the system sees stock and does not reorder. And a careless count writes a new error into the system.
Kang & Gershwin: models, not field data. Hardgrave et al.: field experiments at one global retailer. Rinehart: one facility; the sources were counting and adjusting balances.
Sources: Yun Kang & Stanley B. Gershwin, IIE Transactions 37(9), 2005 (via Abstract at OpenAlex; Kang's MIT thesis (2004) at DSpace@MIT); Bill C. Hardgrave, John A. Aloysius & Sandeep Goyal, Production and Operations Management 22(4), 2013 (via Abstract at OpenAlex); Howard Hao-Chun Chuang & Rogelio Oliva, Journal of Operations Management 39–40, 2015 (via Abstract at OpenAlex); R. F. Rinehart, Operations Research 8(4), 1960 (via Abstract at OpenAlex)
How it is measured
Count blind, then measure
GAO's guide gives the common measure: records found accurate, divided by records counted, times 100. What counts as accurate is set by a tolerance, the range within which a count may differ from the record and still be correct.
- Count blind. Item and location, not the quantity: at 10 of 12 locations.
- Recount differences. Usually two or three counts, ideally by someone else.
- Find the cause. Transactions, receipts and shipments, the same day or the next.
- Correct and code. Adjust with approval and give the cause a code.
Hypothe tical example, a week of counts in one zone
- Accuracy: 184 of 200 records within tolerance: 92%
- Adjustments: +40 and −36 units: net +4, gross 76
The net figure looks harmless; the gross shows how much was wrong. The numbers are invented.
Experts put the goal at 95% or more (GAO, after Brooks & Wilson); six of eight cycle-counting locations aimed at 95–98%, with tolerances of 0–5%. Those that coded causes used 22 codes on average.
Source: US General Accounting Office, 2002
More in the essay: Where part of the order goes missing
Tool of the issue
The cycle count card
One card per location counted. Write the counted quantity before you look at the system, and give every difference a cause. After a month, rank the causes.
- Item and location item number, description, exact location
- Counted quanti
t y counted blind; a recount if it differs - System quanti
t y filled in only after the count - Difference and
t olerance units, and whether it is within the tolerance - Cause a code: receipt, picking, wrong location, loss, count error
- Correction who approved it, when, and what changes in the process
A practice proposed by the editors, after GAO (2002): blind counts, recounts, research and cause codes. A count error is a cause too, after Rinehart (1960). Rank the codes with the Pareto tool.
Sources: US General Accounting Office, 2002; R. F. Rinehart, Operations Research 8(4), 1960 (via Abstract at OpenAlex)
Open the tool: Pareto 80/20
Sources and method
Every figure has a source.
The figures in this issue come from the sources below. The year shows how recent each one is.
- Ananth Raman, Nicole DeHoratius & Zeynep Ton, California Management Review 43(3), “Execution: The Missing Link in Retail Operations”, 2001 (via Abstract at California Management Review). https://doi.org/10.2307/41166093
- Nicole DeHoratius & Ananth Raman, Management Science 54(4), “Inventory Record Inaccuracy: An Empirical Analysis”, 2008 (via Abstract at IDEAS/RePEc and OpenAlex). https://doi.org/10.1287/mnsc.1070.0789
- US General Accounting Office, “Executive Guide: Best Practices in Achieving Consistent, Accurate Physical Counts of Inventory and Related Property (GAO-02-447G)”, 2002. https://www.gao.gov/products/gao-02-447g
- Yun Kang & Stanley B. Gershwin, IIE Transactions 37(9), “Information inaccuracy in inventory systems: stock loss and stockout”, 2005 (via Abstract at OpenAlex; Kang's MIT thesis (2004) at DSpace@MIT). https://doi.org/10.1080/07408170590969861
- Howard Hao-Chun Chuang & Rogelio Oliva, Journal of Operations Management 39–40, “Inventory record inaccuracy: Causes and labor effects”, 2015 (via Abstract at OpenAlex). https://doi.org/10.1016/j.jom.2015.07.006
- Bill C. Hardgrave, John A. Aloysius & Sandeep Goyal, Production and Operations Management 22(4), “RFID-Enabled Visibility and Retail Inventory Record Inaccuracy: Experiments in the Field”, 2013 (via Abstract at OpenAlex). https://doi.org/10.1111/poms.12010
- R. F. Rinehart, Operations Research 8(4), “Effects and Causes of Discrepancies in Supply Operations”, 1960 (via Abstract at OpenAlex). https://doi.org/10.1287/opre.8.4.543
Edit orial me thod
Each figure was checked for its year, its publisher and what exactly it measures. Where the publisher's page could not be opened, the figure was checked against independent summaries and is marked “via”. The editors' interpretation is marked “Our reading”. Figures that could not be confirmed are not in the issue.
Management Review · Monthly edition