At Leitax, as researchers call a consumer electronics company, every department kept its own forecast. After a monthly consensus process, accuracy three months ahead rose from 58% to 88%. The APICS Dictionary describes S&OP as one integrated set of plans, built in five monthly steps. Reviews of the research find that few studies measure its effect on results, and a study of six companies shows why measuring the process itself is hard.
Management Review · Second series · November 2026 · No. 59
S&OP: demand and capacit y in one plan
A company with a forecast for every department, what one monthly plan changed there, the five steps of S&OP, what reviews of the research find, how to measure the process, and an agenda card.
- No.
- 59
- Pages
- 10
- Sources
- 8
- Topics
- Strategy
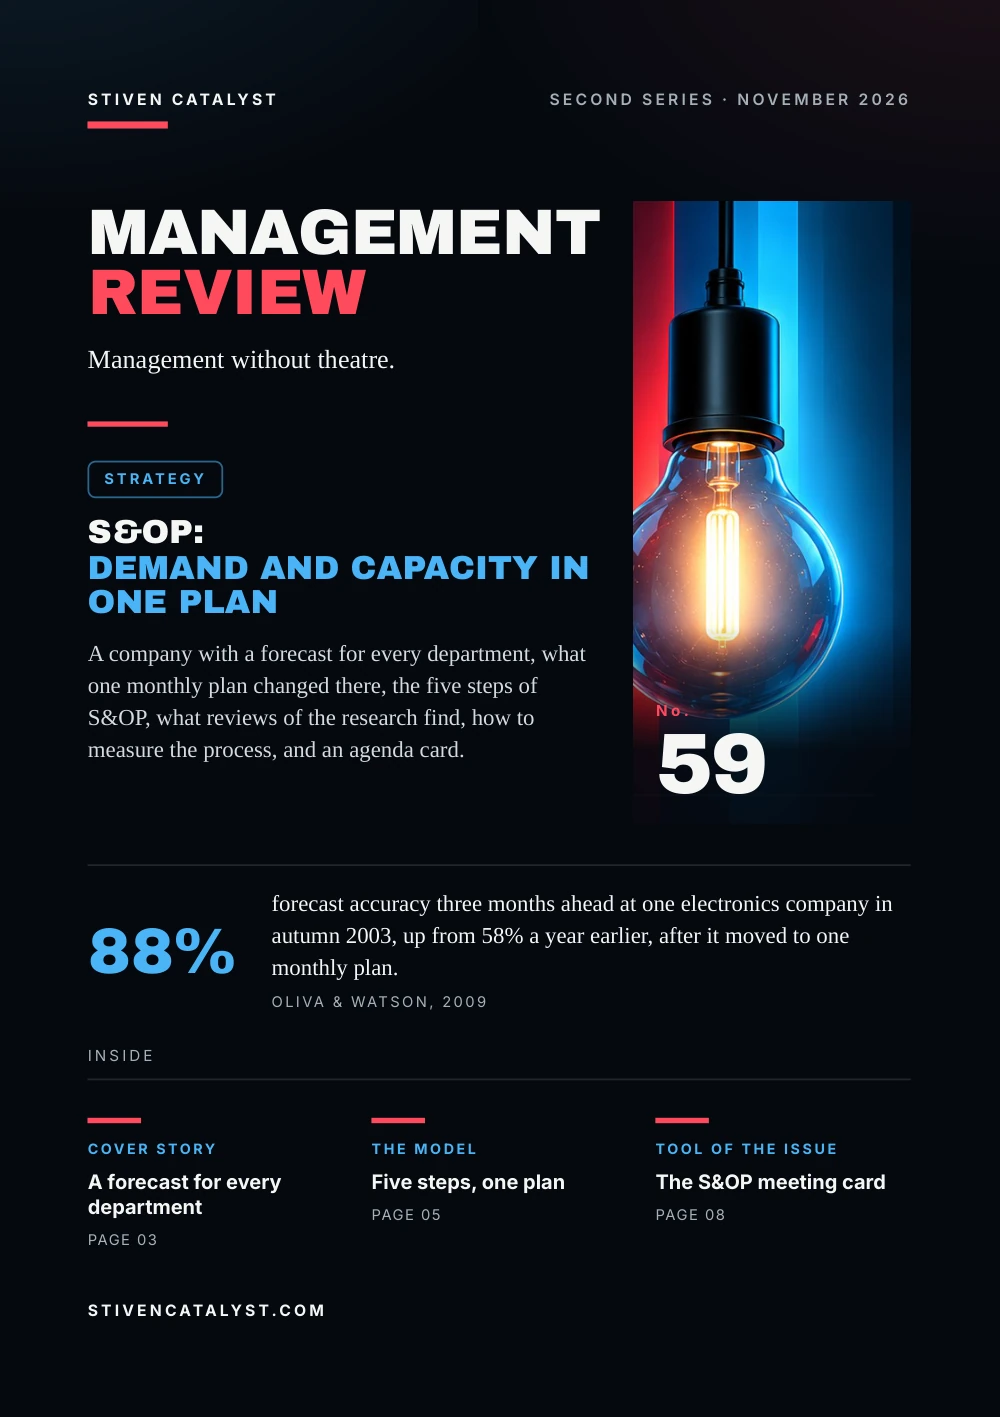
Stiven CatalystSecond series · November 2026
ManagementReview
Management without theatre.
Strategy
S&OP:demand and capacity in one plan
A company with a forecast for every department, what one monthly plan changed there, the five steps of S&OP, what reviews of the research find, how to measure the process, and an agenda card.

No.59
88%
forecast accuracy three months ahead at one electronics company in autumn 2003, up from 58% a year earlier, after it moved to one monthly plan.Oliva & Watson, 2009
stivencatalyst.com
No. 59 · Strategy
In this issue
Sales plans with one number, operations with another, finance with a third. When nobody puts them side by side, the gap shows up later, as shortages or as stock nobody wanted. This issue is about sales and operations planning, S&OP: one plan for demand and capacity, agreed once a month.
- 03Cover storyA forecast for every department
- 04The numbersFrom many forecasts to one
- 05The modelFive steps, one plan
- 06What the research saysOne plan, little proof of results
- 07How it is measuredTwo numbers, two owners
- 08Tool of the issueThe S&OP meeting card
- 09SourcesSources and method
How to read this issue
Figure
Every figure has its source and year at the foot of its page.
Our reading
Where the editors interpret rather than the research, it says so.
Practice
The steps and the card are proposals to try, not research results.
Cover story
A forecast forevery depar tment
Until 2002, demand planning at Leitax, a consumer electronics firm in northern California, was ill-defined. Sales directors made forecasts and passed them to operations and finance informally, sometimes in conversations in the hallway. Rogelio Oliva and Noel Watson describe what happened next.
01
Sales
paid on sales into the shops, so its forecasts were suspected of running high
02
Operations
answerable for shortages, so it made its own forecast
03
Finance
suspected of following market expectations and profit thresholds
Marketing, too, made its own figures when it expected a promotion. Then two product launches ran late and ended in an inventory write-off of about 10% of the revenue of fiscal 2001–02. A new chief executive and five new vice-presidents arrived. In April 2002 a new director of planning started a project, and three analysts took over the forecasting process.
Our reading
Each forecast made sense for the department that made it. The company as a whole had none it could plan on.
Source: Rogelio Oliva & Noel Watson, Production and Operations Management 18(2), 2009 (via Harvard Business School Working Paper 07-024 (2007))
Leitax is a disguised name. The case rests on 25 interviews; the motives of each department are what interviewees suspected, not a measured bias.
The numbers
From many forecastst o one
By summer 2003 a monthly process was in place: sales, product planning and the new demand group each made a forecast, the three were combined, and the group met every month to agree one. Leitax's forecast accuracy three months ahead:
Forecast accuracy three months ahead, Leitax
12 → 26inventory turns a year, Q4 2003 against the year before
$55M → $23Maverage inventory on hand
Our reading
Nobody learned to guess better. The guesses were made in the open, next to each other, and checked every month.
Source: Rogelio Oliva & Noel Watson, Production and Operations Management 18(2), 2009 (via Harvard Business School Working Paper 07-024 (2007))
Accuracy = 1 − |sales − forecast| / forecast. Through 2005 it averaged 85% for sales by the shops. Figures of one company, as the researchers report them: a case, not a controlled comparison.
The model
Five steps,one plan
S&OP is credited to Dick Ling, who ran the first S&OP class at the consultancy Oliver Wight in 1985. The APICS Dictionary describes a process that brings all the plans of a business, from sales and marketing to manufacturing, sourcing and finance, into one integrated set of plans, at least once a month and by product family.
Sales forecast reports
statistical forecasts and figures from the field
Demand planning
the management forecast for each family
Supply planning
capacity set against demand, constraints marked
Pre-S&OP meeting
recommendations and the agenda for the executives
Executive S&OP meeting
one game plan for the whole company
Our reading
Capacity in the plan is not a headcount. It is what people, machines and vehicles can really do to standard.
Sources: Roberta McPhail, APICS, 2015; APICS (today ASCM), 2008 (via Coen Suurmond, BMSD 2016, and an APICS presentation quoting the 14th edition (2015)); Dick Ling, Carol Ptak & Chad Smith, Journal of Supply Chain Management, Logistics and Procurement 5(2), 2023
The steps follow an APICS introduction to S&OP (2015), which plans in volume, not mix, over a rolling 18 months. The definition is from the APICS Dictionary; Ling's role from his author note (2023). The reading is the editors'.
More in the essayHigh-volume days: the standard under pressure
What the research says
One plan, lit tleproof of results
In 2012 Antônio Thomé and colleagues reviewed 271 papers on S&OP. The outcome most of them expected was one: the plans of the departments brought together. In a second review of 55 papers they found that relatively few estimate the effect on the firm's performance.
Five stages of S&OP maturity (Grimson & Pyke, 2007)
- 01
No S&OP
- 02
Reactive
- 03
Standard
- 04
Advanced
- 05
Proactive
In interviews with 15 companies, Andrew Grimson and David Pyke saw little link between firm size or type of process and how well plans were integrated. Business processes helped; information technology not clearly. Consensus has its own risk: at Leitax in 2003 the agreed forecast ran too high for two products, and the write-offs came to more than 1% and 3% of lifetime materials cost.
Our reading
The research backs S&OP as a way to one plan, less as a promise of results. And one plan can still be wrong, together.
Sources: Antônio Márcio Tavares Thomé, Luiz Felipe Scavarda, Nicole Suclla Fernandez & Annibal José Scavarda, International Journal of Production Economics 138(1), 2012 (via Abstract at RePEc (IDEAS)); Antônio Márcio Tavares Thomé, Luiz Felipe Scavarda, Nicole Suclla Fernandez & Annibal José Scavarda, International Journal of Productivity and Performance Management 61(4), 2012; J. Andrew Grimson & David F. Pyke, The International Journal of Logistics Management 18(3), 2007 (via Abstract at vLex; stage names as cited by Hulthén et al. (2017)); Hana Hulthén, Dag Näslund & Andreas Norrman, Operations and Supply Chain Management 10(1), 2017; Rogelio Oliva & Noel Watson, Production and Operations Management 18(2), 2009 (via Harvard Business School Working Paper 07-024 (2007))
Grimson and Pyke call their findings preliminary, from a small sample. The stage names as cited by Hulthén et al. (2017). Oliva and Watson liken the Leitax missteps to groupthink.
How it is measured
Two numbers,two owners
Hana Hulthén, Dag Näslund and Andreas Norrman held 22 interviews in six companies run from Sweden, at maturity stages 2 to 4. At every stage two challenges came back: measures for the trade-offs between departments, and measures in line with strategy and rewards.
01
For the customer
service level, forecast accuracy, delivery on time
02
For resources
inventory, capacity, adherence to the supply plan
03
For the process
who takes part, how the meeting runs, what it decides
Hypothetical example, one product family, one month
- Demand
- forecast 1,000, sold 880: accuracy 88%
- Supply
- planned 1,000, made 940: adherence 94%
Each number has its owner; the meeting looks at both. The numbers are invented.
Sources: Hana Hulthén, Dag Näslund & Andreas Norrman, Operations and Supply Chain Management 10(1), 2017; Rogelio Oliva & Noel Watson, Production and Operations Management 18(2), 2009 (via Harvard Business School Working Paper 07-024 (2007))
The three groups follow the framework of Hulthén et al.; the examples in them are the editors'. Accuracy is computed as at Leitax, where the planning director chose a simple measure to show the direction.
Tool of the issue
The S&OPmee ting card
One meeting a month, one plan at the end. Fill it in before the meeting, by product family, not by item, and bring each gap with options, not only the problem.
01Last monthforecast against sales, plan against output
02Demandvolume by family for the coming months; what changed and why
03Supplyreal capacity against demand: people trained, machines, vehicles
04Gaps and optionseach gap with at least two options and what each costs
05Decisionswhat was decided, what stays open, who takes it higher
06Owners and dateswho does what by when; how the teams hear of it
Sources: Roberta McPhail, APICS, 2015; Rogelio Oliva & Noel Watson, Production and Operations Management 18(2), 2009 (via Harvard Business School Working Paper 07-024 (2007)); Hana Hulthén, Dag Näslund & Andreas Norrman, Operations and Supply Chain Management 10(1), 2017
A practice proposed by the editors, after the five monthly steps in APICS, the Leitax case and the measures of Hulthén et al.
Open the tool: KPI Diagnosticstivencatalyst.com/tools/kpi-diagnostic/
Sources and method
Every figurehas a source.
The figures in this issue come from the sources below. The year shows how recent each one is.
- Managing Functional Biases in Organizational Forecasts: A Case Study of Consensus Forecasting in Supply Chain PlanningRogelio Oliva & Noel Watson, Production and Operations Management 18(2), 2009 · via Harvard Business School Working Paper 07-024 (2007)https://doi.org/10.1111/j.1937-5956.2009.01003.x
- APICS Dictionary, entry "sales and operations planning"APICS (today ASCM), 2008 · via Coen Suurmond, BMSD 2016, and an APICS presentation quoting the 14th edition (2015)
- APICS Introduction to Sales and Operations Planning (S&OP)Roberta McPhail, APICS, 2015https://wc.ascm.org/images/downloads/PDM_s/s_op_to_vancouver_pdm_26_feb_15.pdf
- Demand driven adaptive enterprise and adaptive sales and operations planning (author note)Dick Ling, Carol Ptak & Chad Smith, Journal of Supply Chain Management, Logistics and Procurement 5(2), 2023https://hstalks.com/article/7486/demand-driven-adaptive-enterprise-and-adaptive-sal/
- Sales and operations planning: A research synthesisAntônio Márcio Tavares Thomé, Luiz Felipe Scavarda, Nicole Suclla Fernandez & Annibal José Scavarda, International Journal of Production Economics 138(1), 2012 · via Abstract at RePEc (IDEAS)https://doi.org/10.1016/j.ijpe.2011.11.027
- Sales and operations planning and the firm performanceAntônio Márcio Tavares Thomé, Luiz Felipe Scavarda, Nicole Suclla Fernandez & Annibal José Scavarda, International Journal of Productivity and Performance Management 61(4), 2012https://doi.org/10.1108/17410401211212643
- Sales and operations planning: an exploratory study and frameworkJ. Andrew Grimson & David F. Pyke, The International Journal of Logistics Management 18(3), 2007 · via Abstract at vLex; stage names as cited by Hulthén et al. (2017)https://doi.org/10.1108/09574090710835093
- Challenges of Measuring Performance of the Sales and Operations Planning ProcessHana Hulthén, Dag Näslund & Andreas Norrman, Operations and Supply Chain Management 10(1), 2017https://doi.org/10.31387/oscm0260176
Editorial method
Each figure was checked for its year, its publisher and what exactly it measures. Where the publisher's page could not be opened, the figure was checked against independent summaries and is marked “via”. The editors' interpretation is marked “Our reading”. Figures that could not be confirmed are not in the issue.
ManagementReview
Management without theatre.
Every issue, one management question, checked against the best research.
All issues
stivencatalyst.com/magazine/management-review.html
Management Review · No. 59 · November 2026 · Stiven Catalyst
Click or swipe a page to turn it. The arrow keys work too.
Management Review · No. 59
The figures of the issue
The charts of the printed pages, with their sources.
Source: Rogelio Oliva & Noel Watson, Production and Operations Management 18(2), 2009 (via Harvard Business School Working Paper 07-024 (2007))
The whole text Read the issue as text For reading on a small screen, searching or a screen reader. The same words, without the page design.
In this issue
Sales plans with one number, operations with another, finance with a third. When nobody puts them side by side, the gap shows up later, as shortages or as stock nobody wanted. This issue is about sales and operations planning, S&OP: one plan for demand and capacity, agreed once a month.
At Leitax, as researchers call a consumer electronics company, every department kept its own forecast. After a monthly consensus process, accuracy three months ahead rose from 58% to 88%. The APICS Dictionary describes S&OP as one integrated set of plans, built in five monthly steps. Reviews of the research find that few studies measure its effect on results, and a study of six companies shows why measuring the process itself is hard.
Stiven Janaqi, Editor
Cover story
A forecast for every depar tment
Until 2002, demand planning at Leitax, a consumer electronics firm in northern California, was ill-defined. Sales directors made forecasts and passed them to operations and finance informally, sometimes in conversations in the hallway. Rogelio Oliva and Noel Watson describe what happened next.
- Sales. paid on sales into the shops, so its forecasts were suspected of running high
- Operations. answerable for shortages, so it made its own forecast
- Finance. suspected of following market expectations and profit thresholds
Marketing, too, made its own figures when it expected a promotion. Then two product launches ran late and ended in an inventory write-off of about 10% of the revenue of fiscal 2001–02. A new chief executive and five new vice-presidents arrived. In April 2002 a new director of planning started a project, and three analysts took over the forecasting process.
Our reading
Each forecast made sense for the department that made it. The company as a whole had none it could plan on.
Leitax is a disguised name. The case rests on 25 interviews; the motives of each department are what interviewees suspected, not a measured bias.
Source: Rogelio Oliva & Noel Watson, Production and Operations Management 18(2), 2009 (via Harvard Business School Working Paper 07-024 (2007))
The numbers
From many forecasts t o one
By summer 2003 a monthly process was in place: sales, product planning and the new demand group each made a forecast, the three were combined, and the group met every month to agree one. Leitax's forecast accuracy three months ahead:
Forecast accuracy three months ahead, Leitax: Sales by the shops: Summer 2002 58%, Autumn 2003 88%; Sales into the shops: Summer 2002 49%, Autumn 2003 84%.
- 12 → 26 inventory turns a year, Q4 2003 against the year before
- $55M → $23M average inventory on hand
Our reading
Nobody learned to guess better. The guesses were made in the open, next to each other, and checked every month.
Accuracy = 1 − |sales − forecast| / forecast. Through 2005 it averaged 85% for sales by the shops. Figures of one company, as the researchers report them: a case, not a controlled comparison.
Source: Rogelio Oliva & Noel Watson, Production and Operations Management 18(2), 2009 (via Harvard Business School Working Paper 07-024 (2007))
The model
Five steps, one plan
S&OP is credited to Dick Ling, who ran the first S&OP class at the consultancy Oliver Wight in 1985. The APICS Dictionary describes a process that brings all the plans of a business, from sales and marketing to manufacturing, sourcing and finance, into one integrated set of plans, at least once a month and by product family.
- Sales forecast repo
r ts. statistical forecasts and figures from the field - Demand planning. the management forecast for each family
- Supply planning. capacity set against demand, constraints marked
- Pre-S&OP me
e ting. recommendations and the agenda for the executives - Executive S&OP me
e ting. one game plan for the whole company
Our reading
Capacity in the plan is not a headcount. It is what people, machines and vehicles can really do to standard.
The steps follow an APICS introduction to S&OP (2015), which plans in volume, not mix, over a rolling 18 months. The definition is from the APICS Dictionary; Ling's role from his author note (2023). The reading is the editors'.
Sources: Roberta McPhail, APICS, 2015; APICS (today ASCM), 2008 (via Coen Suurmond, BMSD 2016, and an APICS presentation quoting the 14th edition (2015)); Dick Ling, Carol Ptak & Chad Smith, Journal of Supply Chain Management, Logistics and Procurement 5(2), 2023
More in the essay: High-volume days: the standard under pressure
What the research says
One plan, lit tle proof of results
In 2012 Antônio Thomé and colleagues reviewed 271 papers on S&OP. The outcome most of them expected was one: the plans of the departments brought together. In a second review of 55 papers they found that relatively few estimate the effect on the firm's performance.
Five stages of S&OP maturit y (Grimson & Pyke, 2007)
- No S&OP.
- Reactive.
- Standard.
- Advanced.
- Proactive.
In interviews with 15 companies, Andrew Grimson and David Pyke saw little link between firm size or type of process and how well plans were integrated. Business processes helped; information technology not clearly. Consensus has its own risk: at Leitax in 2003 the agreed forecast ran too high for two products, and the write-offs came to more than 1% and 3% of lifetime materials cost.
Our reading
The research backs S&OP as a way to one plan, less as a promise of results. And one plan can still be wrong, together.
Grimson and Pyke call their findings preliminary, from a small sample. The stage names as cited by Hulthén et al. (2017). Oliva and Watson liken the Leitax missteps to groupthink.
Sources: Antônio Márcio Tavares Thomé, Luiz Felipe Scavarda, Nicole Suclla Fernandez & Annibal José Scavarda, International Journal of Production Economics 138(1), 2012 (via Abstract at RePEc (IDEAS)); Antônio Márcio Tavares Thomé, Luiz Felipe Scavarda, Nicole Suclla Fernandez & Annibal José Scavarda, International Journal of Productivity and Performance Management 61(4), 2012; J. Andrew Grimson & David F. Pyke, The International Journal of Logistics Management 18(3), 2007 (via Abstract at vLex; stage names as cited by Hulthén et al. (2017)); Hana Hulthén, Dag Näslund & Andreas Norrman, Operations and Supply Chain Management 10(1), 2017; Rogelio Oliva & Noel Watson, Production and Operations Management 18(2), 2009 (via Harvard Business School Working Paper 07-024 (2007))
How it is measured
Two numbers, two owners
Hana Hulthén, Dag Näslund and Andreas Norrman held 22 interviews in six companies run from Sweden, at maturity stages 2 to 4. At every stage two challenges came back: measures for the trade-offs between departments, and measures in line with strategy and rewards.
- For the cus
t omer. service level, forecast accuracy, delivery on time - For resources. inventory, capacity, adherence to the supply plan
- For the process. who takes part, how the meeting runs, what it decides
Hypothe tical example, one product family, one month
- Demand: forecast 1,000, sold 880: accuracy 88%
- Supply: planned 1,000, made 940: adherence 94%
Each number has its owner; the meeting looks at both. The numbers are invented.
The three groups follow the framework of Hulthén et al.; the examples in them are the editors'. Accuracy is computed as at Leitax, where the planning director chose a simple measure to show the direction.
Sources: Hana Hulthén, Dag Näslund & Andreas Norrman, Operations and Supply Chain Management 10(1), 2017; Rogelio Oliva & Noel Watson, Production and Operations Management 18(2), 2009 (via Harvard Business School Working Paper 07-024 (2007))
Tool of the issue
The S&OP mee ting card
One meeting a month, one plan at the end. Fill it in before the meeting, by product family, not by item, and bring each gap with options, not only the problem.
- Last month forecast against sales, plan against output
- Demand volume by family for the coming months; what changed and why
- Supply real capacity against demand: people trained, machines, vehicles
- Gaps and o
p tions each gap with at least two options and what each costs - Decisions what was decided, what stays open, who takes it higher
- Owners and dates who does what by when; how the teams hear of it
A practice proposed by the editors, after the five monthly steps in APICS, the Leitax case and the measures of Hulthén et al.
Sources: Roberta McPhail, APICS, 2015; Rogelio Oliva & Noel Watson, Production and Operations Management 18(2), 2009 (via Harvard Business School Working Paper 07-024 (2007)); Hana Hulthén, Dag Näslund & Andreas Norrman, Operations and Supply Chain Management 10(1), 2017
Open the tool: KPI Diagnostic
Sources and method
Every figure has a source.
The figures in this issue come from the sources below. The year shows how recent each one is.
- Rogelio Oliva & Noel Watson, Production and Operations Management 18(2), “Managing Functional Biases in Organizational Forecasts: A Case Study of Consensus Forecasting in Supply Chain Planning”, 2009 (via Harvard Business School Working Paper 07-024 (2007)). https://doi.org/10.1111/j.1937-5956.2009.01003.x
- APICS (today ASCM), “APICS Dictionary, entry "sales and operations planning"”, 2008 (via Coen Suurmond, BMSD 2016, and an APICS presentation quoting the 14th edition (2015)).
- Roberta McPhail, APICS, “APICS Introduction to Sales and Operations Planning (S&OP)”, 2015. https://wc.ascm.org/images/downloads/PDM_s/s_op_to_vancouver_pdm_26_feb_15.pdf
- Dick Ling, Carol Ptak & Chad Smith, Journal of Supply Chain Management, Logistics and Procurement 5(2), “Demand driven adaptive enterprise and adaptive sales and operations planning (author note)”, 2023. https://hstalks.com/article/7486/demand-driven-adaptive-enterprise-and-adaptive-sal/
- Antônio Márcio Tavares Thomé, Luiz Felipe Scavarda, Nicole Suclla Fernandez & Annibal José Scavarda, International Journal of Production Economics 138(1), “Sales and operations planning: A research synthesis”, 2012 (via Abstract at RePEc (IDEAS)). https://doi.org/10.1016/j.ijpe.2011.11.027
- Antônio Márcio Tavares Thomé, Luiz Felipe Scavarda, Nicole Suclla Fernandez & Annibal José Scavarda, International Journal of Productivity and Performance Management 61(4), “Sales and operations planning and the firm performance”, 2012. https://doi.org/10.1108/17410401211212643
- J. Andrew Grimson & David F. Pyke, The International Journal of Logistics Management 18(3), “Sales and operations planning: an exploratory study and framework”, 2007 (via Abstract at vLex; stage names as cited by Hulthén et al. (2017)). https://doi.org/10.1108/09574090710835093
- Hana Hulthén, Dag Näslund & Andreas Norrman, Operations and Supply Chain Management 10(1), “Challenges of Measuring Performance of the Sales and Operations Planning Process”, 2017. https://doi.org/10.31387/oscm0260176
Edit orial me thod
Each figure was checked for its year, its publisher and what exactly it measures. Where the publisher's page could not be opened, the figure was checked against independent summaries and is marked “via”. The editors' interpretation is marked “Our reading”. Figures that could not be confirmed are not in the issue.
Management Review · Monthly edition