In 1984 Eliyahu Goldratt and Jeff Cox told the theory of constraints as a novel, The Goal. Published applications reported average cuts in lead time of around 70%, though not one report of a failure turned up. The five focusing steps show the order of the work. In 42 hospital projects, most reported gains, and in one the queue moved to the next ward. Three measures replace local efficiency.
Management Review · Second series · November 2026 · No. 54
The bot tleneck: theory of constraints
Herbie on the scout hike, what published TOC cases reported, the five focusing steps, what 42 hospital projects found, three measures instead of efficiency, and a card for your own bottleneck.
- No.
- 54
- Pages
- 10
- Sources
- 7
- Topics
- Strategy
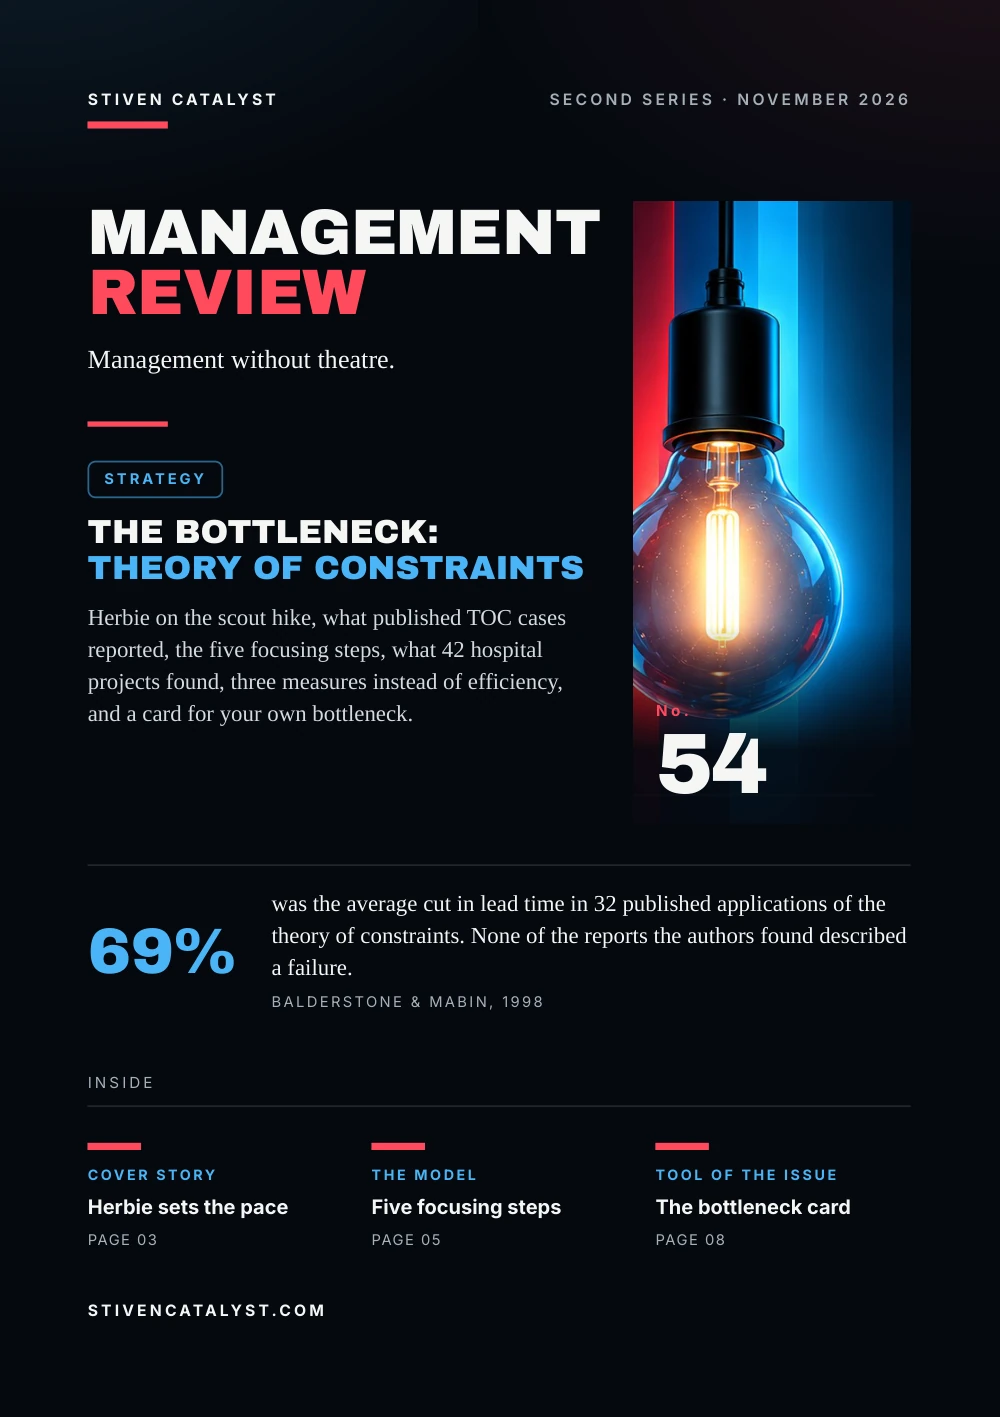
Stiven CatalystSecond series · November 2026
ManagementReview
Management without theatre.
Strategy
The bottleneck:theory of constraints
Herbie on the scout hike, what published TOC cases reported, the five focusing steps, what 42 hospital projects found, three measures instead of efficiency, and a card for your own bottleneck.

No.54
69%
was the average cut in lead time in 32 published applications of the theory of constraints. None of the reports the authors found described a failure.Balderstone & Mabin, 1998
stivencatalyst.com
No. 54 · Strategy
In this issue
Every operation has one step that sets the pace for all the others. Improve anything else and the output stays the same. This issue is about finding that step, working it to the full, and noticing when it moves.
- 03Cover storyHerbie sets the pace
- 04The numbersWhat the cases reported
- 05The modelFive focusing steps
- 06What the research saysWhen the queue moves on
- 07How it is measuredThree measures, one pace
- 08Tool of the issueThe bottleneck card
- 09SourcesSources and method
How to read this issue
Figure
Every figure has its source and year at the foot of its page.
Our reading
Where the editors interpret rather than the research, it says so.
Practice
The steps and the card are proposals to try, not research results.
Cover story
Herbie se tsthe pace
In The Goal (1984), plant manager Alex Rogo leads his son's scout troop on a hike. The line stretches out. The boys cannot overtake the one in front, and the slowest of them, Herbie, decides how fast the whole troop moves.
01
Dependent events
each hiker can go only as fast as the one ahead allows
02
Fluctuations
the delays add up along the line; the gains do not make up for them
03
Bottleneck
in Goldratt's terms, any resource with less capacity than the demand on it
Alex puts Herbie at the front, and the boys share out his heavy pack. The troop stays together and walks faster. Goldratt wrote the novel for workers in plants using his scheduling software, OPT. Its schedules left some stations idle; measured on their own efficiency, workers kept busy and built stock.
Our reading
Everyone busy is not the same as everything moving. The line goes at Herbie's pace, however fast the others walk.
Sources: Eliyahu M. Goldratt & Jeff Cox, North River Press, 1984 (via Watson, Blackstone & Gardiner, 2007; LitCharts); Kevin J. Watson, John H. Blackstone & Stanley C. Gardiner, Journal of Operations Management 25(2), 2007
The hike is fiction from the novel; we know it from summaries, not from the book itself. Why the book was written follows Watson, Blackstone and Gardiner (2007).
The numbers
What the casesrepor ted
Steven Balderstone and Victoria Mabin, at Victoria University of Wellington, searched the literature on the theory of constraints. Of over 100 case reports, 77 companies gave figures. The averages, with the number of cases behind each:
Mean change reported in published TOC applications, 1998
In their 2003 article, with over 80 applications, the means were close: lead time 70% shorter, cycle time 65% shorter, inventory 49% lower. In both searches the authors found no report of a failure.
Our reading
An average of published successes is not an average of attempts. It shows what is possible, not what to expect.
Sources: Steven J. Balderstone & Victoria J. Mabin, Victoria University of Wellington, conference paper, 1998; Victoria J. Mabin & Steven J. Balderstone, International Journal of Operations & Production Management 23(6), 2003 (via Panizzolo, 2016); Roberto Panizzolo, International Journal of Industrial Engineering and Management 7(1), 2016
Reports by the companies or their authors, mostly from manufacturing in North America; the revenue mean leaves out one rise of 600%. The 2003 means as a later study cites them.
The model
Five focusingsteps
The Goal sets out the order in which the theory of constraints is put to work. Later accounts add two things to do first: define the system and its purpose, and choose measures that tie it to that purpose.
Identify the constraint
the one step that limits the output of the whole
Exploit it
get the most from it with the resources you already have
Subordinate everything else
the other steps work at its pace, not at their own
Elevate it
add capacity there, only if more output is still needed
Do not let inertia set in
if the constraint has moved, start again
A constraint can be physical, when capacity is below demand; the market, when demand is below capacity; or a policy, a written or unwritten rule that holds the system back.
Our reading
Exploit comes before elevate. The cheapest hour of capacity is the one the bottleneck loses today, waiting.
Sources: Eliyahu M. Goldratt & Jeff Cox, North River Press, 1984 (via Watson, Blackstone & Gardiner, 2007; LitCharts); Theory of Constraints Institute, 2021; Kevin J. Watson, John H. Blackstone & Stanley C. Gardiner, Journal of Operations Management 25(2), 2007
Steps after the Theory of Constraints Institute; the prerequisites and the three kinds of constraint after Watson et al. (2007), who cite the APICS Dictionary. The reading is the editors'.
More in the essayHigh-volume days: the standard under pressure
What the research says
When the queuemoves on
Gabriel Bacelar-Silva, James Cox and Pedro Rodrigues reviewed 42 uses of the theory of constraints in healthcare, from journals, theses and conference talks, up to 2020. The five focusing steps were the method used most, in 76%. Share of projects that reported a gain:
42 TOC projects in healthcare, 2020
Where they were measured, waiting times fell by half on average. Three projects reported no change. In one, more patients got through, and the ward and the follow-up care after it became congested.
Our reading
Lift one bottleneck and the queue moves to the next. That is why the fifth step exists.
Source: Gabriel M. Bacelar-Silva, James F. Cox III & Pedro P. Rodrigues, Health Systems 11(1), 2020 (via PubMed Central, PMC8812771)
The authors call their review exploratory: few projects, data often incomplete, no statistical tests, and most applied only parts of the method.
How it is measured
Three measures,one pace
In place of the efficiency of each station, The Goal measures the plant as a whole with three numbers. Its aim: raise throughput while cutting inventory and operating expense.
01
Throughput
the rate at which the system makes money through sales
02
Inventory
the money tied up in things it intends to sell
03
Operating expense
the money spent to turn inventory into throughput
Keeping to the schedule is a fair measure at the constraint. Elsewhere, running at full output only builds stock.
Hypothetical example, an evening shift in a dispatch area
- Constraint
- the loading ramp: 4 doors, 16 door-hours
- Lost there
- 2.5 door-hours waiting for trolleys
- Elsewhere
- picking at 105% of plan, 30 trolleys queuing
Picking looks best and the ramp loses the most. The numbers are invented.
Sources: Eliyahu M. Goldratt & Jeff Cox, North River Press, 1984 (via Watson, Blackstone & Gardiner, 2007; LitCharts); Kevin J. Watson, John H. Blackstone & Stanley C. Gardiner, Journal of Operations Management 25(2), 2007
The three measures and their definitions are Goldratt's, as Watson et al. (2007) and a textbook glossary give them. The example is the editors'.
Tool of the issue
The bot tleneckcard
One process, one constraint. Look for where the work waits, not where people look busiest, and write down the date when you will check whether it has moved.
01Process and goalwhere it starts and ends; what output counts
021. The constraintwhere work queues; physical, market or a rule
032. Hours it loseswaiting, breaks, rework; what changes at no cost
043. What the others changerelease, pace and priorities set by the constraint
054. Added capacityonly if still short after step 2; what it costs
065. Check againdate; where the queue is now
Sources: Theory of Constraints Institute, 2021; Gabriel M. Bacelar-Silva, James F. Cox III & Pedro P. Rodrigues, Health Systems 11(1), 2020 (via PubMed Central, PMC8812771)
A practice proposed by the editors, after the five focusing steps and the findings above.
Open the tool: Delay Analyzerstivencatalyst.com/tools/delay-analyzer/
Sources and method
Every figurehas a source.
The figures in this issue come from the sources below. The year shows how recent each one is.
- The Goal: A Process of Ongoing ImprovementEliyahu M. Goldratt & Jeff Cox, North River Press, 1984 · via Watson, Blackstone & Gardiner, 2007; LitCharts
- The evolution of a management philosophy: The theory of constraintsKevin J. Watson, John H. Blackstone & Stanley C. Gardiner, Journal of Operations Management 25(2), 2007https://doi.org/10.1016/j.jom.2006.04.004
- A Review of Goldratt's Theory of Constraints (TOC): lessons from the international literatureSteven J. Balderstone & Victoria J. Mabin, Victoria University of Wellington, conference paper, 1998https://www.tocinstitute.org/uploads/1/2/7/9/12796657/toc_impact_study.pdf
- The performance of the theory of constraints methodology: Analysis and discussion of successful TOC applicationsVictoria J. Mabin & Steven J. Balderstone, International Journal of Operations & Production Management 23(6), 2003 · via Panizzolo, 2016https://doi.org/10.1108/01443570310476636
- Theory of Constraints (TOC) Production and Manufacturing PerformanceRoberto Panizzolo, International Journal of Industrial Engineering and Management 7(1), 2016https://www.research.unipd.it/retrieve/e14fb26b-f0bc-3de1-e053-1705fe0ac030/ijiem_vol7_no1_3.pdf
- The Five Focusing Steps (POOGI)Theory of Constraints Institute, 2021https://www.tocinstitute.org/five-focusing-steps.html
- Outcomes of managing healthcare services using the Theory of Constraints: A systematic reviewGabriel M. Bacelar-Silva, James F. Cox III & Pedro P. Rodrigues, Health Systems 11(1), 2020 · via PubMed Central, PMC8812771https://doi.org/10.1080/20476965.2020.1813056
Editorial method
Each figure was checked for its year, its publisher and what exactly it measures. Where the publisher's page could not be opened, the figure was checked against independent summaries and is marked “via”. The editors' interpretation is marked “Our reading”. Figures that could not be confirmed are not in the issue.
ManagementReview
Management without theatre.
Every issue, one management question, checked against the best research.
All issues
stivencatalyst.com/magazine/management-review.html
Management Review · No. 54 · November 2026 · Stiven Catalyst
Click or swipe a page to turn it. The arrow keys work too.
Management Review · No. 54
The figures of the issue
The charts of the printed pages, with their sources.
Source: Steven J. Balderstone & Victoria J. Mabin, Victoria University of Wellington, conference paper, 1998
Source: Gabriel M. Bacelar-Silva, James F. Cox III & Pedro P. Rodrigues, Health Systems 11(1), 2020 (via PubMed Central, PMC8812771)
The whole text Read the issue as text For reading on a small screen, searching or a screen reader. The same words, without the page design.
In this issue
Every operation has one step that sets the pace for all the others. Improve anything else and the output stays the same. This issue is about finding that step, working it to the full, and noticing when it moves.
In 1984 Eliyahu Goldratt and Jeff Cox told the theory of constraints as a novel, The Goal. Published applications reported average cuts in lead time of around 70%, though not one report of a failure turned up. The five focusing steps show the order of the work. In 42 hospital projects, most reported gains, and in one the queue moved to the next ward. Three measures replace local efficiency.
Stiven Janaqi, Editor
Cover story
Herbie se ts the pace
In The Goal (1984), plant manager Alex Rogo leads his son's scout troop on a hike. The line stretches out. The boys cannot overtake the one in front, and the slowest of them, Herbie, decides how fast the whole troop moves.
- Dependent events. each hiker can go only as fast as the one ahead allows
- Fluctuations. the delays add up along the line; the gains do not make up for them
- Bo
t tleneck. in Goldratt's terms, any resource with less capacity than the demand on it
Alex puts Herbie at the front, and the boys share out his heavy pack. The troop stays together and walks faster. Goldratt wrote the novel for workers in plants using his scheduling software, OPT. Its schedules left some stations idle; measured on their own efficiency, workers kept busy and built stock.
Our reading
Everyone busy is not the same as everything moving. The line goes at Herbie's pace, however fast the others walk.
The hike is fiction from the novel; we know it from summaries, not from the book itself. Why the book was written follows Watson, Blackstone and Gardiner (2007).
Sources: Eliyahu M. Goldratt & Jeff Cox, North River Press, 1984 (via Watson, Blackstone & Gardiner, 2007; LitCharts); Kevin J. Watson, John H. Blackstone & Stanley C. Gardiner, Journal of Operations Management 25(2), 2007
The numbers
What the cases repor ted
Steven Balderstone and Victoria Mabin, at Victoria University of Wellington, searched the literature on the theory of constraints. Of over 100 case reports, 77 companies gave figures. The averages, with the number of cases behind each:
Mean change reported in published TOC applications, 1998: Lead time, shorter (32 cases) 69%, Cycle time, shorter (14) 66%, Revenue or throughput, higher (18) 68%, Inventory, lower (28) 50%.
In their 2003 article, with over 80 applications, the means were close: lead time 70% shorter, cycle time 65% shorter, inventory 49% lower. In both searches the authors found no report of a failure.
Our reading
An average of published successes is not an average of attempts. It shows what is possible, not what to expect.
Reports by the companies or their authors, mostly from manufacturing in North America; the revenue mean leaves out one rise of 600%. The 2003 means as a later study cites them.
Sources: Steven J. Balderstone & Victoria J. Mabin, Victoria University of Wellington, conference paper, 1998; Victoria J. Mabin & Steven J. Balderstone, International Journal of Operations & Production Management 23(6), 2003 (via Panizzolo, 2016); Roberto Panizzolo, International Journal of Industrial Engineering and Management 7(1), 2016
The model
Five focusing steps
The Goal sets out the order in which the theory of constraints is put to work. Later accounts add two things to do first: define the system and its purpose, and choose measures that tie it to that purpose.
- Identi
f y the constraint. the one step that limits the output of the whole - Exploit it. get the most from it with the resources you already have
- Subordinate ever
y thing else. the other steps work at its pace, not at their own - Elevate it. add capacity there, only if more output is still needed
- Do not l
e t iner tia se t in. if the constraint has moved, start again
A constraint can be physical, when capacity is below demand; the market, when demand is below capacity; or a policy, a written or unwritten rule that holds the system back.
Our reading
Exploit comes before elevate. The cheapest hour of capacity is the one the bottleneck loses today, waiting.
Steps after the Theory of Constraints Institute; the prerequisites and the three kinds of constraint after Watson et al. (2007), who cite the APICS Dictionary. The reading is the editors'.
Sources: Eliyahu M. Goldratt & Jeff Cox, North River Press, 1984 (via Watson, Blackstone & Gardiner, 2007; LitCharts); Theory of Constraints Institute, 2021; Kevin J. Watson, John H. Blackstone & Stanley C. Gardiner, Journal of Operations Management 25(2), 2007
More in the essay: High-volume days: the standard under pressure
What the research says
When the queue moves on
Gabriel Bacelar-Silva, James Cox and Pedro Rodrigues reviewed 42 uses of the theory of constraints in healthcare, from journals, theses and conference talks, up to 2020. The five focusing steps were the method used most, in 76%. Share of projects that reported a gain:
42 TOC projects in healthcare, 2020: Productivity 98%, Timeliness of care 83%, Quality of care 48%, Finances 29%.
Where they were measured, waiting times fell by half on average. Three projects reported no change. In one, more patients got through, and the ward and the follow-up care after it became congested.
Our reading
Lift one bottleneck and the queue moves to the next. That is why the fifth step exists.
The authors call their review exploratory: few projects, data often incomplete, no statistical tests, and most applied only parts of the method.
Source: Gabriel M. Bacelar-Silva, James F. Cox III & Pedro P. Rodrigues, Health Systems 11(1), 2020 (via PubMed Central, PMC8812771)
How it is measured
Three measures, one pace
In place of the efficiency of each station, The Goal measures the plant as a whole with three numbers. Its aim: raise throughput while cutting inventory and operating expense.
- Throughput. the rate at which the system makes money through sales
- Inven
t ory. the money tied up in things it intends to sell - Operating expense. the money spent to turn inventory into throughput
Keeping to the schedule is a fair measure at the constraint. Elsewhere, running at full output only builds stock.
Hypothe tical example, an evening shif t in a dispat ch area
- Constraint: the loading ramp: 4 doors, 16 door-hours
- Lost there: 2.5 door-hours waiting for trolleys
- Elsewhere: picking at 105% of plan, 30 trolleys queuing
Picking looks best and the ramp loses the most. The numbers are invented.
The three measures and their definitions are Goldratt's, as Watson et al. (2007) and a textbook glossary give them. The example is the editors'.
Sources: Eliyahu M. Goldratt & Jeff Cox, North River Press, 1984 (via Watson, Blackstone & Gardiner, 2007; LitCharts); Kevin J. Watson, John H. Blackstone & Stanley C. Gardiner, Journal of Operations Management 25(2), 2007
Tool of the issue
The bot tleneck card
One process, one constraint. Look for where the work waits, not where people look busiest, and write down the date when you will check whether it has moved.
- Process and goal where it starts and ends; what output counts
- 1. The constraint where work queues; physical, market or a rule
- 2. Hours it loses waiting, breaks, rework; what changes at no cost
- 3. What the others change release, pace and priorities set by the constraint
- 4. Added capaci
t y only if still short after step 2; what it costs - 5. Check again date; where the queue is now
A practice proposed by the editors, after the five focusing steps and the findings above.
Sources: Theory of Constraints Institute, 2021; Gabriel M. Bacelar-Silva, James F. Cox III & Pedro P. Rodrigues, Health Systems 11(1), 2020 (via PubMed Central, PMC8812771)
Open the tool: Delay Analyzer
Sources and method
Every figure has a source.
The figures in this issue come from the sources below. The year shows how recent each one is.
- Eliyahu M. Goldratt & Jeff Cox, North River Press, “The Goal: A Process of Ongoing Improvement”, 1984 (via Watson, Blackstone & Gardiner, 2007; LitCharts).
- Kevin J. Watson, John H. Blackstone & Stanley C. Gardiner, Journal of Operations Management 25(2), “The evolution of a management philosophy: The theory of constraints”, 2007. https://doi.org/10.1016/j.jom.2006.04.004
- Steven J. Balderstone & Victoria J. Mabin, Victoria University of Wellington, conference paper, “A Review of Goldratt's Theory of Constraints (TOC): lessons from the international literature”, 1998. https://www.tocinstitute.org/uploads/1/2/7/9/12796657/toc_impact_study.pdf
- Victoria J. Mabin & Steven J. Balderstone, International Journal of Operations & Production Management 23(6), “The performance of the theory of constraints methodology: Analysis and discussion of successful TOC applications”, 2003 (via Panizzolo, 2016). https://doi.org/10.1108/01443570310476636
- Roberto Panizzolo, International Journal of Industrial Engineering and Management 7(1), “Theory of Constraints (TOC) Production and Manufacturing Performance”, 2016. https://www.research.unipd.it/retrieve/e14fb26b-f0bc-3de1-e053-1705fe0ac030/ijiem_vol7_no1_3.pdf
- Theory of Constraints Institute, “The Five Focusing Steps (POOGI)”, 2021. https://www.tocinstitute.org/five-focusing-steps.html
- Gabriel M. Bacelar-Silva, James F. Cox III & Pedro P. Rodrigues, Health Systems 11(1), “Outcomes of managing healthcare services using the Theory of Constraints: A systematic review”, 2020 (via PubMed Central, PMC8812771). https://doi.org/10.1080/20476965.2020.1813056
Edit orial me thod
Each figure was checked for its year, its publisher and what exactly it measures. Where the publisher's page could not be opened, the figure was checked against independent summaries and is marked “via”. The editors' interpretation is marked “Our reading”. Figures that could not be confirmed are not in the issue.
Management Review · Monthly edition