The Lean Enterprise Institute defines takt time as the available time divided by customer demand. The idea came from German aircraft plants in the 1930s and spread through Toyota in the 1950s. On one line, eight unevenly loaded operators became two lines of three, and the balance rose from 64% to 93%. On a hospital in Sacramento, a four-day takt brought 11 planned months of exterior work down to 5.5. And measuring cycle time takes a stopwatch, a team that knows why, and at least ten timings per step.
Management Review · Second series · November 2026 · No. 53
Takt time and cycle time: the beat of demand
Available time over demand, where takt came from, a line balanced from 64% to 93%, takt, cycle time and pitch, takt on building sites, how to time a process, and a worksheet.
- No.
- 53
- Pages
- 10
- Sources
- 8
- Topics
- KPIs
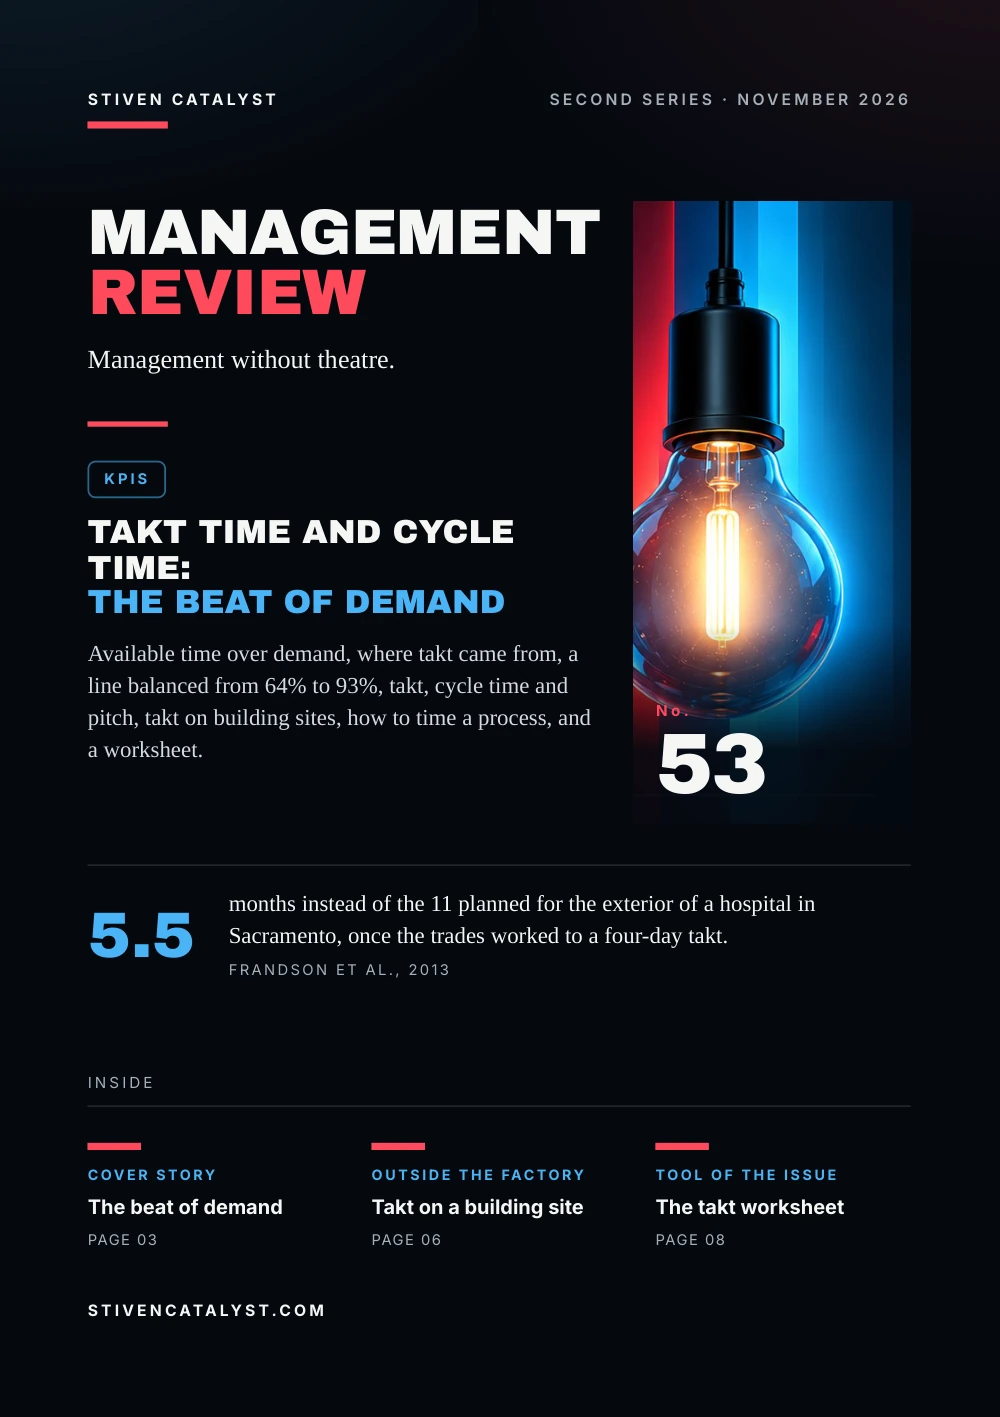
Stiven CatalystSecond series · November 2026
ManagementReview
Management without theatre.
KPIs
Takt time and cycle time:the beat of demand
Available time over demand, where takt came from, a line balanced from 64% to 93%, takt, cycle time and pitch, takt on building sites, how to time a process, and a worksheet.

No.53
5.5
months instead of the 11 planned for the exterior of a hospital in Sacramento, once the trades worked to a four-day takt.Frandson et al., 2013
stivencatalyst.com
No. 53 · KPIs
In this issue
Every operation runs on two clocks. The customer sets one: how often a unit has to be finished to keep up with demand. The process sets the other: how long each step really takes. This issue is about the two, and about what a manager does when they do not match.
- 03Cover storyThe beat of demand
- 04The numbersEight people, two lines
- 05The modelTakt, cycle and pitch
- 06Outside the factoryTakt on a building site
- 07How it is measuredTime it before you balance
- 08Tool of the issueThe takt worksheet
- 09SourcesSources and method
How to read this issue
Figure
Every figure has its source and year at the foot of its page.
Our reading
Where the editors interpret rather than the research, it says so.
Practice
The steps and the card are proposals to try, not research results.
Cover story
The beatof demand
For the Lean Enterprise Institute, takt time is the available production time divided by customer demand. A plant that works 480 minutes a day for 240 units a day has a takt of two minutes. Takt, German for a precise interval such as a musical meter, is the heartbeat of a lean system.
- 1500sRecords of the arsenal of Venice describe a steady, takted output of merchant ships and warships.
- 1913In Detroit, Ford brings the production line to the mass production of cars.
- 1930sIn the German aircraft industry, airframes move to the next station at a fixed interval: the takt.
- 1950sTakt is widely used at Toyota; by the late 1960s, across its suppliers.
The interval is set by demand, not by the machines. According to the institute, Toyota typically reviews the takt of a process every month, with a smaller review every ten days.
Our reading
Takt is not a speed you demand of people. It is the rate at which customers take what you make; every step is measured against it.
Sources: Lean Enterprise Institute, 2014; Shervin Haghsheno, Marco Binninger, Janosch Dlouhy & Simon Sterlike, Proceedings of the 24th Annual Conference of the International Group for Lean Construction (IGLC), 2016
Definition, aircraft and Toyota follow the LEI lexicon; Venice and Ford follow a review by Haghsheno et al. (2016). Accounts of how takt reached Japan through Mitsubishi rest on secondary sources, so we leave that step out.
The numbers
Eight people,two lines
In 2016 Curt Knoll, a former continuous-improvement manager, described a line from a recent project in IndustryWeek. Eight operators worked to a takt of 5.2 minutes; between the least and the most loaded there were exactly four minutes of work. The line balance was 64%.
Line balance, one project, 2016
16 → <2 minoperators' total waiting time, as the author adds it up: 87% less
+38%output after the change
With some training and process kaizen, the team ran two lines at a takt of 10.5 minutes each and spread the work so that every operator came in under it. Work in process between operations fell from several units to one.
Our reading
Waiting on a line rarely shows up in a report. It shows up in the balance chart, as the gap between the tallest bar and the shortest.
Source: Curt Knoll, IndustryWeek, 2016
One unnamed project, reported by the person who led it; the article does not say how the balance rate or the output were calculated. The figures are his.
The model
Takt, cycleand pit ch
Takt comes from demand, cycle time from the process. The institute defines cycle time as the time it takes to make a part or complete a process, as timed by actual measurement. A process keeps pace when every step sits at or just under the takt.
01
Takt time
available time ÷ demand; set by the customer, the same for every step
02
Cycle time
measured at each step: an operator's full round of work, or a machine's work on one piece
03
Pitch
takt × pack-out quantity: a one-minute takt and boxes of 20 give a pitch of 20 minutes
Hypothetical example, parcel packing in one shift
- Takt
- 450 minutes available, 900 parcels: 30 seconds
- Cycle times
- pick 26 s, check 11 s, pack 34 s, label 9 s
- The gap
- packing runs 4 s over takt: 900 parcels need an hour more than the shift has
- People
- 80 s of work ÷ 30 s takt = 2.7: at least three, if the work is shared evenly
The bottleneck is visible before anyone is asked to work faster. The numbers are invented.
Our reading
On a day when demand runs above forecast, the takt gets shorter. The steps that sat just under it are the first to fall behind.
Sources: Lean Enterprise Institute, Lean Lexicon: Takt Time, 2014; Lean Enterprise Institute, Lean Lexicon: Cycle Time, 2014; Lean Enterprise Institute, Lean Lexicon: Pitch, 2014
Definitions follow the LEI lexicon; the example and the count of people are the editors' arithmetic.
More in the essayHigh-volume days: the standard under pressure
Outside the factory
Takt on abuilding site
Builders use takt too; a review by Haghsheno and colleagues names the Empire State Building (1930) as its first recorded use in building construction. In 2013 Adam Frandson, Klas Berghede and Iris Tommelein described the exterior of an eight-storey hospital in Sacramento, divided into zones that each trade had four days to finish.
Exterior work on a hospital in Sacramento, months
Framing was far slower than the other trades, so it got a second crew. The first three production plans were missed; every one after that was met. In Helsinki, a one-day takt per apartment cut the interior phase of a 42-apartment block by two months, nearly 30%, after a chaotic start and a partial restart.
“If the building process is not well-understood, then all the Takt time adds is stress.”
Sources: Shervin Haghsheno, Marco Binninger, Janosch Dlouhy & Simon Sterlike, Proceedings of the 24th Annual Conference of the International Group for Lean Construction (IGLC), 2016; Adam Frandson, Klas Berghede & Iris D. Tommelein, Proceedings of the 21st Annual Conference of the International Group for Lean Construction (IGLC), 2013; Joonas Lehtovaara, Iina Mustonen, Petteri Peuronen, Olli Seppänen & Antti Peltokorpi, Proceedings of the 27th Annual Conference of the International Group for Lean Construction (IGLC), 2019
Two single cases, reported by their authors. The Sacramento paper gives 5.5 months in its abstract and 5 in its results; we chart 5.5. The quote is the Sacramento team's lesson: at first they added time to the takt.
How it is measured
Time it beforeyou balance
Cycle time is measured, not estimated: the institute times an operator's cycle by direct observation. In IndustryWeek, Curt Knoll sets out how he prepares a time study before building the balance chart.
Takt first
Work it out before you pick up a stopwatch.
Walk the line both ways
Write every step on a time observation form.
Tell the team why
You are not timing them to go faster; they work at their normal pace.
Agree start and stop
In Knoll's own check, observers started and stopped the clock at different points.
At least ten timings
Per step; twenty give an average you can trust more.
The institute's aim for the balance chart: each operator's work very nearly equal to, but slightly less than, takt. For a machine, count what comes with every piece: a 20-second cycle, 30 seconds to load and unload, and a 30-second changeover every 30 pieces give an effective cycle of 51 seconds.
Sources: Lean Enterprise Institute, Lean Lexicon: Cycle Time, 2014; Lean Enterprise Institute, Lean Lexicon: Operator Balance Chart, 2014; Curt Knoll, IndustryWeek, 2016
The steps follow Knoll (2016); the definitions and the machine example are the LEI lexicon's.
Tool of the issue
The taktworkshee t
One process, one shift. Work out the takt from demand, time each step, and see which steps sit above the line before you add people or overtime.
01Process and periodwhich process; one shift, day or week
02Available timeminutes in the period, minus breaks and planned stops
03Demandunits the customer takes in the same period
04Taktavailable time ÷ demand, in seconds
05Cycle time per stepat least ten timings each; note the spread, not only the average
06Over takt and one changesteps above takt; total work ÷ takt = people needed; what we move or improve first
Sources: Lean Enterprise Institute, Lean Lexicon: Takt Time, 2014; Lean Enterprise Institute, Lean Lexicon: Operator Balance Chart, 2014; Curt Knoll, IndustryWeek, 2016
A practice proposed by the editors, on the LEI definitions and Knoll's time study. The tool charts the timings and shows their spread.
Open the tool: Sigma & Control Chartstivencatalyst.com/tools/sigma-control-chart/
Sources and method
Every figurehas a source.
The figures in this issue come from the sources below. The year shows how recent each one is.
- Lean Lexicon: Takt TimeLean Enterprise Institute, 2014https://www.lean.org/lexicon-terms/takt-time/
- History and Theoretical Foundations of Takt Planning and Takt ControlShervin Haghsheno, Marco Binninger, Janosch Dlouhy & Simon Sterlike, Proceedings of the 24th Annual Conference of the International Group for Lean Construction (IGLC), 2016https://iglc.net/Papers/Details/1297
- Operator Balance: Why Waiting Is the Worst of the WastesCurt Knoll, IndustryWeek, 2016https://www.industryweek.com/operations/continuous-improvement/article/21987519/operator-balance-why-waiting-is-the-worst-of-the-wastes
- Lean Lexicon: Cycle TimeLean Enterprise Institute, 2014https://www.lean.org/lexicon-terms/cycle-time/
- Lean Lexicon: PitchLean Enterprise Institute, 2014https://www.lean.org/lexicon-terms/pitch/
- Takt Time Planning for Construction of Exterior CladdingAdam Frandson, Klas Berghede & Iris D. Tommelein, Proceedings of the 21st Annual Conference of the International Group for Lean Construction (IGLC), 2013https://iglc.net/Papers/Details/902
- Implementing Takt Planning and Takt Control Into Residential ConstructionJoonas Lehtovaara, Iina Mustonen, Petteri Peuronen, Olli Seppänen & Antti Peltokorpi, Proceedings of the 27th Annual Conference of the International Group for Lean Construction (IGLC), 2019https://doi.org/10.24928/2019/0118
- Lean Lexicon: Operator Balance ChartLean Enterprise Institute, 2014https://www.lean.org/lexicon-terms/operator-balance-chart/
Editorial method
Each figure was checked for its year, its publisher and what exactly it measures. Where the publisher's page could not be opened, the figure was checked against independent summaries and is marked “via”. The editors' interpretation is marked “Our reading”. Figures that could not be confirmed are not in the issue.
ManagementReview
Management without theatre.
Every issue, one management question, checked against the best research.
All issues
stivencatalyst.com/magazine/management-review.html
Management Review · No. 53 · November 2026 · Stiven Catalyst
Click or swipe a page to turn it. The arrow keys work too.
Management Review · No. 53
The figures of the issue
The charts of the printed pages, with their sources.
Source: Curt Knoll, IndustryWeek, 2016
Source: Adam Frandson, Klas Berghede & Iris D. Tommelein, Proceedings of the 21st Annual Conference of the International Group for Lean Construction (IGLC), 2013
The whole text Read the issue as text For reading on a small screen, searching or a screen reader. The same words, without the page design.
In this issue
Every operation runs on two clocks. The customer sets one: how often a unit has to be finished to keep up with demand. The process sets the other: how long each step really takes. This issue is about the two, and about what a manager does when they do not match.
The Lean Enterprise Institute defines takt time as the available time divided by customer demand. The idea came from German aircraft plants in the 1930s and spread through Toyota in the 1950s. On one line, eight unevenly loaded operators became two lines of three, and the balance rose from 64% to 93%. On a hospital in Sacramento, a four-day takt brought 11 planned months of exterior work down to 5.5. And measuring cycle time takes a stopwatch, a team that knows why, and at least ten timings per step.
Stiven Janaqi, Editor
Cover story
The beat of demand
For the Lean Enterprise Institute, takt time is the available production time divided by customer demand. A plant that works 480 minutes a day for 240 units a day has a takt of two minutes. Takt, German for a precise interval such as a musical meter, is the heartbeat of a lean system.
- 1500s Records of the arsenal of Venice describe a steady, takted output of merchant ships and warships.
- 1913 In Detroit, Ford brings the production line to the mass production of cars.
- 1930s In the German aircraft industry, airframes move to the next station at a fixed interval: the takt.
- 1950s Takt is widely used at Toyota; by the late 1960s, across its suppliers.
The interval is set by demand, not by the machines. According to the institute, Toyota typically reviews the takt of a process every month, with a smaller review every ten days.
Our reading
Takt is not a speed you demand of people. It is the rate at which customers take what you make; every step is measured against it.
Definition, aircraft and Toyota follow the LEI lexicon; Venice and Ford follow a review by Haghsheno et al. (2016). Accounts of how takt reached Japan through Mitsubishi rest on secondary sources, so we leave that step out.
Sources: Lean Enterprise Institute, 2014; Shervin Haghsheno, Marco Binninger, Janosch Dlouhy & Simon Sterlike, Proceedings of the 24th Annual Conference of the International Group for Lean Construction (IGLC), 2016
The numbers
Eight people, two lines
In 2016 Curt Knoll, a former continuous-improvement manager, described a line from a recent project in IndustryWeek. Eight operators worked to a takt of 5.2 minutes; between the least and the most loaded there were exactly four minutes of work. The line balance was 64%.
Line balance, one project, 2016: One line of eight 64%, Two lines of three 93%.
- 16 → <2 min operators' total waiting time, as the author adds it up: 87% less
- +38% output after the change
With some training and process kaizen, the team ran two lines at a takt of 10.5 minutes each and spread the work so that every operator came in under it. Work in process between operations fell from several units to one.
Our reading
Waiting on a line rarely shows up in a report. It shows up in the balance chart, as the gap between the tallest bar and the shortest.
One unnamed project, reported by the person who led it; the article does not say how the balance rate or the output were calculated. The figures are his.
Source: Curt Knoll, IndustryWeek, 2016
The model
Takt, cycle and pit ch
Takt comes from demand, cycle time from the process. The institute defines cycle time as the time it takes to make a part or complete a process, as timed by actual measurement. A process keeps pace when every step sits at or just under the takt.
- Takt time. available time ÷ demand; set by the customer, the same for every step
- Cycle time. measured at each step: an operator's full round of work, or a machine's work on one piece
- Pi
t ch. takt × pack-out quantity: a one-minute takt and boxes of 20 give a pitch of 20 minutes
Hypothe tical example, parcel packing in one shif t
- Takt: 450 minutes available, 900 parcels: 30 seconds
- Cycle times: pick 26 s, check 11 s, pack 34 s, label 9 s
- The gap: packing runs 4 s over takt: 900 parcels need an hour more than the shift has
- People: 80 s of work ÷ 30 s takt = 2.7: at least three, if the work is shared evenly
The bottleneck is visible before anyone is asked to work faster. The numbers are invented.
Our reading
On a day when demand runs above forecast, the takt gets shorter. The steps that sat just under it are the first to fall behind.
Definitions follow the LEI lexicon; the example and the count of people are the editors' arithmetic.
Sources: Lean Enterprise Institute, Lean Lexicon: Takt Time, 2014; Lean Enterprise Institute, Lean Lexicon: Cycle Time, 2014; Lean Enterprise Institute, Lean Lexicon: Pitch, 2014
More in the essay: High-volume days: the standard under pressure
Outside the factory
Takt on a building site
Builders use takt too; a review by Haghsheno and colleagues names the Empire State Building (1930) as its first recorded use in building construction. In 2013 Adam Frandson, Klas Berghede and Iris Tommelein described the exterior of an eight-storey hospital in Sacramento, divided into zones that each trade had four days to finish.
Exterior work on a hospital in Sacramento, months: Original schedule 11, With a four-day takt 5.5.
Framing was far slower than the other trades, so it got a second crew. The first three production plans were missed; every one after that was met. In Helsinki, a one-day takt per apartment cut the interior phase of a 42-apartment block by two months, nearly 30%, after a chaotic start and a partial restart.
If the building process is not well-understood, then all the Takt time adds is stress.
Two single cases, reported by their authors. The Sacramento paper gives 5.5 months in its abstract and 5 in its results; we chart 5.5. The quote is the Sacramento team's lesson: at first they added time to the takt.
Sources: Shervin Haghsheno, Marco Binninger, Janosch Dlouhy & Simon Sterlike, Proceedings of the 24th Annual Conference of the International Group for Lean Construction (IGLC), 2016; Adam Frandson, Klas Berghede & Iris D. Tommelein, Proceedings of the 21st Annual Conference of the International Group for Lean Construction (IGLC), 2013; Joonas Lehtovaara, Iina Mustonen, Petteri Peuronen, Olli Seppänen & Antti Peltokorpi, Proceedings of the 27th Annual Conference of the International Group for Lean Construction (IGLC), 2019
How it is measured
Time it before you balance
Cycle time is measured, not estimated: the institute times an operator's cycle by direct observation. In IndustryWeek, Curt Knoll sets out how he prepares a time study before building the balance chart.
- Takt first. Work it out before you pick up a stopwatch.
- Walk the line both ways. Write every step on a time observation form.
- Tell the team why. You are not timing them to go faster; they work at their normal pace.
- Agree sta
r t and st op. In Knoll's own check, observers started and stopped the clock at different points. - At least ten timings. Per step; twenty give an average you can trust more.
The institute's aim for the balance chart: each operator's work very nearly equal to, but slightly less than, takt. For a machine, count what comes with every piece: a 20-second cycle, 30 seconds to load and unload, and a 30-second changeover every 30 pieces give an effective cycle of 51 seconds.
The steps follow Knoll (2016); the definitions and the machine example are the LEI lexicon's.
Sources: Lean Enterprise Institute, Lean Lexicon: Cycle Time, 2014; Lean Enterprise Institute, Lean Lexicon: Operator Balance Chart, 2014; Curt Knoll, IndustryWeek, 2016
Tool of the issue
The takt workshee t
One process, one shift. Work out the takt from demand, time each step, and see which steps sit above the line before you add people or overtime.
- Process and period which process; one shift, day or week
- Available time minutes in the period, minus breaks and planned stops
- Demand units the customer takes in the same period
- Takt available time ÷ demand, in seconds
- Cycle time per step at least ten timings each; note the spread, not only the average
- Over takt and one change steps above takt; total work ÷ takt = people needed; what we move or improve first
A practice proposed by the editors, on the LEI definitions and Knoll's time study. The tool charts the timings and shows their spread.
Sources: Lean Enterprise Institute, Lean Lexicon: Takt Time, 2014; Lean Enterprise Institute, Lean Lexicon: Operator Balance Chart, 2014; Curt Knoll, IndustryWeek, 2016
Open the tool: Sigma & Control Chart
Sources and method
Every figure has a source.
The figures in this issue come from the sources below. The year shows how recent each one is.
- Lean Enterprise Institute, “Lean Lexicon: Takt Time”, 2014. https://www.lean.org/lexicon-terms/takt-time/
- Shervin Haghsheno, Marco Binninger, Janosch Dlouhy & Simon Sterlike, Proceedings of the 24th Annual Conference of the International Group for Lean Construction (IGLC), “History and Theoretical Foundations of Takt Planning and Takt Control”, 2016. https://iglc.net/Papers/Details/1297
- Curt Knoll, IndustryWeek, “Operator Balance: Why Waiting Is the Worst of the Wastes”, 2016. https://www.industryweek.com/operations/continuous-improvement/article/21987519/operator-balance-why-waiting-is-the-worst-of-the-wastes
- Lean Enterprise Institute, “Lean Lexicon: Cycle Time”, 2014. https://www.lean.org/lexicon-terms/cycle-time/
- Lean Enterprise Institute, “Lean Lexicon: Pitch”, 2014. https://www.lean.org/lexicon-terms/pitch/
- Adam Frandson, Klas Berghede & Iris D. Tommelein, Proceedings of the 21st Annual Conference of the International Group for Lean Construction (IGLC), “Takt Time Planning for Construction of Exterior Cladding”, 2013. https://iglc.net/Papers/Details/902
- Joonas Lehtovaara, Iina Mustonen, Petteri Peuronen, Olli Seppänen & Antti Peltokorpi, Proceedings of the 27th Annual Conference of the International Group for Lean Construction (IGLC), “Implementing Takt Planning and Takt Control Into Residential Construction”, 2019. https://doi.org/10.24928/2019/0118
- Lean Enterprise Institute, “Lean Lexicon: Operator Balance Chart”, 2014. https://www.lean.org/lexicon-terms/operator-balance-chart/
Edit orial me thod
Each figure was checked for its year, its publisher and what exactly it measures. Where the publisher's page could not be opened, the figure was checked against independent summaries and is marked “via”. The editors' interpretation is marked “Our reading”. Figures that could not be confirmed are not in the issue.
Management Review · Monthly edition