Fred Reichheld's Net Promoter Score counts a 6 out of 10 as a detractor, just like a 0, and very different teams can end up with the same score. Studies from Norway and the US could not confirm that NPS predicts growth better than satisfaction measures, and across 93 firms satisfaction measured as top-2-box predicted retention best. In CEB's research, 96% of customers who had to work hard to get help became more disloyal, against 9% when it was easy.
Management Review · Monthly edition · October 2026 · No. 32
NPS, CSAT, CES: what the y really measure
Why a 6 counts as a detractor, what customer effort does to loyalty, three metrics and three questions, whether NPS predicts growth, one set of answers with three scores, and a card.
- No.
- 32
- Pages
- 10
- Sources
- 8
- Topics
- KPIs
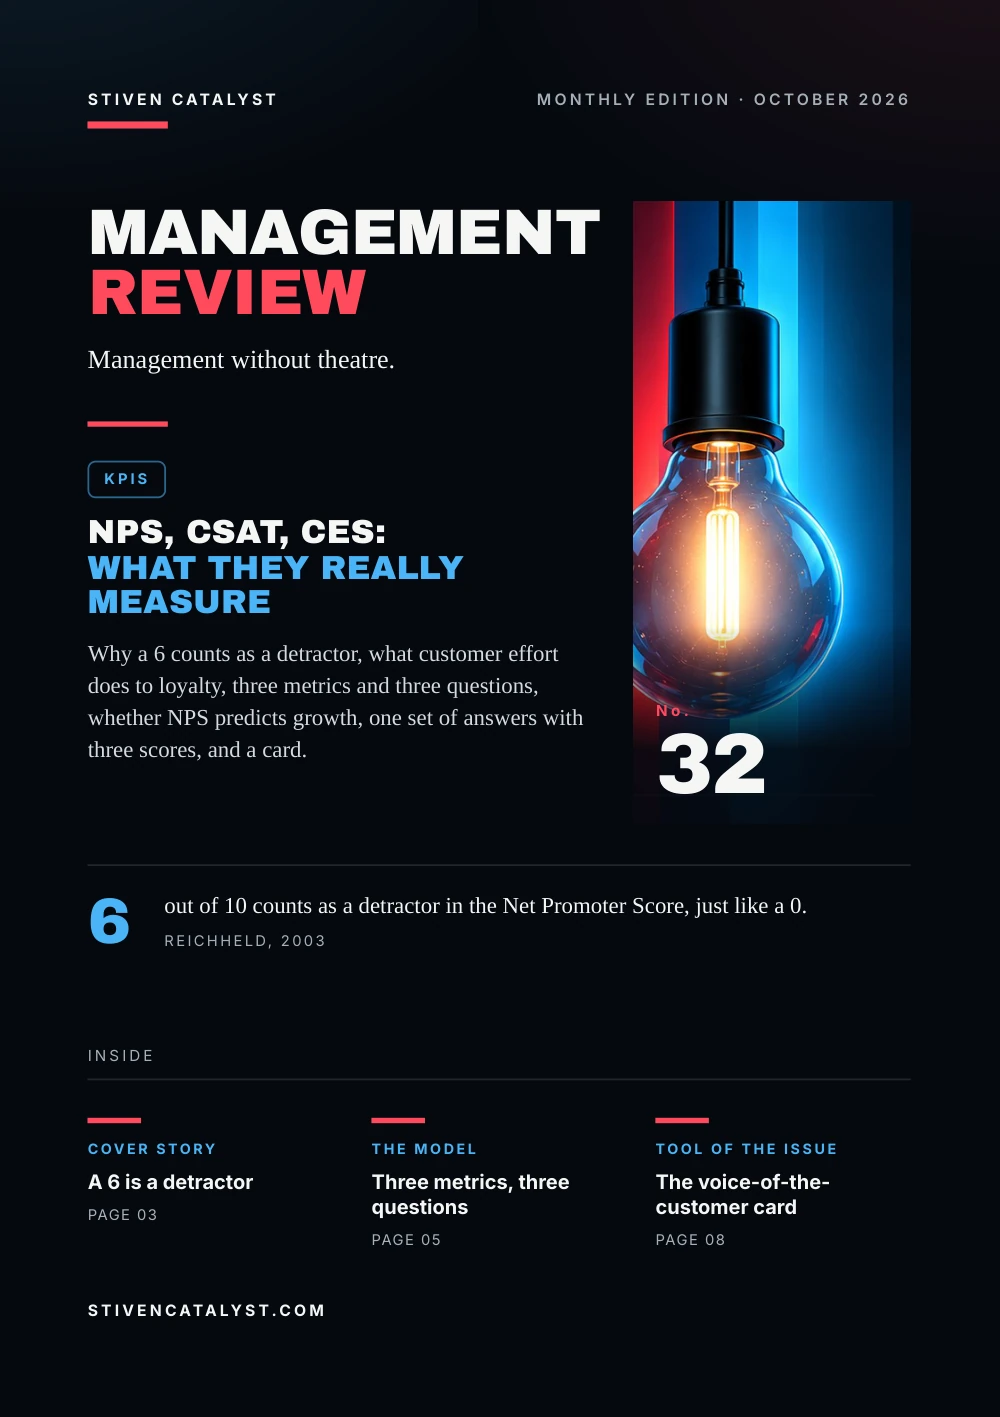
Stiven CatalystMonthly edition · October 2026
ManagementReview
Management without theatre.
KPIs
NPS, CSAT, CES:what they really measure
Why a 6 counts as a detractor, what customer effort does to loyalty, three metrics and three questions, whether NPS predicts growth, one set of answers with three scores, and a card.

No.32
6
out of 10 counts as a detractor in the Net Promoter Score, just like a 0.Reichheld, 2003
stivencatalyst.com
No. 32 · KPIs
In this issue
Most companies ask their customers for a number. This issue asks what NPS, CSAT and CES each measure, how well they predict what matters, and how to read a score without fooling yourself.
- 03Cover storyA 6 is a detractor
- 04The numbersEffort costs loyalty
- 05The modelThree metrics, three questions
- 06What the research saysDoes it predict growth?
- 07How it is measuredOne set of answers, three scores
- 08Tool of the issueThe voice-of-the- customer card
- 09SourcesSources and method
How to read this issue
Figure
Every figure has its source and year at the foot of its page.
Our reading
Where the editors interpret rather than the research, it says so.
Practice
The steps and the card are proposals to try, not research results.
Cover story
A 6 isa de tract or
In December 2003 Fred Reichheld proposed in Harvard Business Review that one question could replace long satisfaction surveys: how likely is it that you would recommend the company to a friend or colleague, from 0 to 10?
0–6
Detractors
count against the score
7–8
Passives
count in the total, not in the score
9–10
Promoters
count for the score
NPS is the share of promoters minus the share of detractors, from −100 to +100. Two teams can reach the same score in very different ways:
Two hypothetical teams, both with an NPS of +25 (% of answers)
Source: Frederick F. Reichheld, Harvard Business Review, 2003
The teams and numbers are invented; the method follows Reichheld (2003). Net Promoter and NPS are registered trademarks of Bain & Company, NICE Systems and Fred Reichheld.
The numbers
Effor t costsloyalt y
In 2010 Matthew Dixon, Karen Freeman and Nicholas Toman reported a study of more than 75,000 customers who had contacted service by phone, web, chat or e-mail. Delighting customers, they concluded, does not build loyalty; reducing their effort does.
Customers who became more disloyal after a service interaction (CEB research, self-reported)
In CEB's research, service interactions were about four times more likely to drive disloyalty than loyalty. The 2010 article introduced the Customer Effort Score; in 2013 CEB replaced the first question with a statement rated from 1 to 7: the company made it easy for me to handle my issue.
Our reading
Customers rarely leave because service was not dazzling. They leave because it was hard work.
Sources: Matthew Dixon, Karen Freeman & Nicholas Toman, Harvard Business Review, 2010; Matthew Dixon, Nick Toman & Rick DeLisi, Portfolio/Penguin, 2013
Research by CEB, a firm that sold the method; it rests on intentions that customers reported, not on measured behaviour.
The model
Three me trics,three questions
The three best-known customer metrics ask different questions, so they measure different things. None of them is a standard, and CSAT has no owner at all.
NPS
Would you recommend us?
0 to 10; share of 9–10 minus share of 0–6
CSAT
How satisfied were you?
often 1 to 5; often the share of the two highest answers
CES
Was it easy?
since 2013, agreement from 1 to 7 with a statement
The model behind the American Customer Satisfaction Index (ACSI), 1994
- 01
Expectations
what customers expect
- 02
Quality and value
as customers perceive them
- 03
Satisfaction
scored from 0 to 100
- 04
Complaints, loyalty
the consequences
Our reading
Recommendation, satisfaction and effort are different things. Pick the question that fits the decision you have to make.
Sources: Frederick F. Reichheld, Harvard Business Review, 2003; Neil A. Morgan & Lopo Leotte Rego, Marketing Science, 2006; Matthew Dixon, Nick Toman & Rick DeLisi, Portfolio/Penguin, 2013; Claes Fornell et al., Journal of Marketing, 1996
The CSAT practice is common usage, not a standard. The ACSI has been published since October 1994; its satisfaction score is a weighted average of three questions.
More in the essay61 resellers: what wholesale taught me about trust
What the research says
Does it predictgrowth?
Reichheld wrote that the recommend question predicts loyalty and growth better than satisfaction surveys. Independent studies tested the claim.
Keiningham et al., 2007
21 firms and over 15,500 interviews in Norway, compared with the ACSI: no clear superiority of Net Promoter over other measures.
Morgan & Rego, 2006
ACSI data for 1994–2000: average satisfaction predicted business performance best; recommendation measures had little or no value.
de Haan et al., 2015
Customers of 93 firms in 18 industries: top-2-box satisfaction predicted retention best; the best metric varied by industry, and combining helped.
Our reading
No single number wins everywhere. Which one predicts best depends on the business, so test it on your own customers.
Sources: Timothy L. Keiningham et al., Journal of Marketing, 2007; Neil A. Morgan & Lopo Leotte Rego, Marketing Science, 2006; Evert de Haan, Peter C. Verhoef & Thorsten Wiesel, International Journal of Research in Marketing, 2015
Associations, not proof of cause. Morgan and Rego did not use the 0–10 question. Each camp has an interest: Bain advises on NPS, CEB sold CES research, and Ipsos announced the 2007 critique.
How it is measured
One se t of answers,three scores
CSAT is often reported as top-2-box: the share of answers in the two highest points of the scale. Change the rule and the same answers give a different number.
Hypothetical example, 100 answers on a 1–5 scale
- Answers
- 5: 30 · 4: 40 · 3: 15 · 2: 10 · 1: 5
- Top-2-box
- 4s and 5s of all answers: 70%
- No neutrals
- the 3s left out of the count: 70 of 85 = 82%
- Top box
- only the 5s: 30%
Say which rule you use, and keep it. The answers are invented.
Fix the question, the scale and the rule
Otherwise a change in the score may only be a change in the method.
Report the spread, not only the score
The same score can hide very different customers.
Keep the score out of bonuses
NPS's own authors say tying it to frontline bonuses made people chase the score.
Sources: Evert de Haan, Peter C. Verhoef & Thorsten Wiesel, International Journal of Research in Marketing, 2015; Fred Reichheld, Darci Darnell & Maureen Burns, Harvard Business Review, 2021
The steps and the example are the editors'. Top-2-box follows the studies of Morgan & Rego and de Haan et al.; on bonuses, Reichheld, Darnell & Burns (2021).
Open the tool: Last-Mile CX Control Towerstivencatalyst.com/tools/cx-control-tower/
Tool of the issue
The voice-of-the-cust omer card
One card per month. The score is the start of the conversation: the spread, the reasons and the effort tell you what to fix.
01Question and scaleword for word, and the rule for the score
02Answershow many, and how many customers did not answer
03Score and spreadthe score, and the share in each group
04Top three reasonsfrom the comments of the lowest scores
05Where customers worked hardrepeat contacts, switching channels, waiting
06One fixwhat, who, by when; check it next month
Sources: Frederick F. Reichheld, Harvard Business Review, 2003; Matthew Dixon, Karen Freeman & Nicholas Toman, Harvard Business Review, 2010
A practice proposed by the editors, after Reichheld (2003) and Dixon, Freeman & Toman (2010).
Sources and method
Every figurehas a source.
The figures in this issue come from the sources below. The year shows how recent each one is.
- The One Number You Need to GrowFrederick F. Reichheld, Harvard Business Review, 2003https://hbr.org/2003/12/the-one-number-you-need-to-grow
- Stop Trying to Delight Your CustomersMatthew Dixon, Karen Freeman & Nicholas Toman, Harvard Business Review, 2010https://hbr.org/2010/07/stop-trying-to-delight-your-customers
- The Effortless Experience: Conquering the New Battleground for Customer LoyaltyMatthew Dixon, Nick Toman & Rick DeLisi, Portfolio/Penguin, 2013
- The American Customer Satisfaction Index: Nature, Purpose, and FindingsClaes Fornell et al., Journal of Marketing, 1996https://doi.org/10.2307/1251898
- The Value of Different Customer Satisfaction and Loyalty Metrics in Predicting Business PerformanceNeil A. Morgan & Lopo Leotte Rego, Marketing Science, 2006https://doi.org/10.1287/mksc.1050.0180
- A Longitudinal Examination of Net Promoter and Firm Revenue GrowthTimothy L. Keiningham et al., Journal of Marketing, 2007https://doi.org/10.1509/jmkg.71.3.39
- The predictive ability of different customer feedback metrics for retentionEvert de Haan, Peter C. Verhoef & Thorsten Wiesel, International Journal of Research in Marketing, 2015https://doi.org/10.1016/j.ijresmar.2015.02.004
- Net Promoter 3.0Fred Reichheld, Darci Darnell & Maureen Burns, Harvard Business Review, 2021https://www.bain.com/insights/net-promoter-3-0/
Editorial method
Each figure was checked for its year, its publisher and what exactly it measures. Where the publisher's page could not be opened, the figure was checked against independent summaries and is marked “via”. The editors' interpretation is marked “Our reading”. Figures that could not be confirmed are not in the issue.
ManagementReview
Management without theatre.
Every issue, one management question, checked against the best research.
All issues
stivencatalyst.com/magazine/management-review.html
Management Review · No. 32 · October 2026 · Stiven Catalyst
Click or swipe a page to turn it. The arrow keys work too.
Management Review · No. 32
The figures of the issue
The charts of the printed pages, with their sources.
Source: Frederick F. Reichheld, Harvard Business Review, 2003
Source: Matthew Dixon, Nick Toman & Rick DeLisi, Portfolio/Penguin, 2013
The whole text Read the issue as text For reading on a small screen, searching or a screen reader. The same words, without the page design.
In this issue
Most companies ask their customers for a number. This issue asks what NPS, CSAT and CES each measure, how well they predict what matters, and how to read a score without fooling yourself.
Fred Reichheld's Net Promoter Score counts a 6 out of 10 as a detractor, just like a 0, and very different teams can end up with the same score. Studies from Norway and the US could not confirm that NPS predicts growth better than satisfaction measures, and across 93 firms satisfaction measured as top-2-box predicted retention best. In CEB's research, 96% of customers who had to work hard to get help became more disloyal, against 9% when it was easy.
Stiven Janaqi, Editor
Cover story
A 6 is a de tract or
In December 2003 Fred Reichheld proposed in Harvard Business Review that one question could replace long satisfaction surveys: how likely is it that you would recommend the company to a friend or colleague, from 0 to 10?
- 0–6: D
e tract ors. count against the score - 7–8: Passives. count in the total, not in the score
- 9–10: Promoters. count for the score
NPS is the share of promoters minus the share of detractors, from −100 to +100. Two teams can reach the same score in very different ways:
Two hypothetical teams, both with an NPS of +25 (% of answers): Promoters: Team A 45%, Team B 60%; Passives: Team A 35%, Team B 5%; Detractors: Team A 20%, Team B 35%.
The teams and numbers are invented; the method follows Reichheld (2003). Net Promoter and NPS are registered trademarks of Bain & Company, NICE Systems and Fred Reichheld.
Source: Frederick F. Reichheld, Harvard Business Review, 2003
The numbers
Effor t costs loyalt y
In 2010 Matthew Dixon, Karen Freeman and Nicholas Toman reported a study of more than 75,000 customers who had contacted service by phone, web, chat or e-mail. Delighting customers, they concluded, does not build loyalty; reducing their effort does.
Customers who became more disloyal after a service interaction (CEB research, self-reported): High effort 96%, Low effort 9%.
In CEB's research, service interactions were about four times more likely to drive disloyalty than loyalty. The 2010 article introduced the Customer Effort Score; in 2013 CEB replaced the first question with a statement rated from 1 to 7: the company made it easy for me to handle my issue.
Our reading
Customers rarely leave because service was not dazzling. They leave because it was hard work.
Research by CEB, a firm that sold the method; it rests on intentions that customers reported, not on measured behaviour.
Sources: Matthew Dixon, Karen Freeman & Nicholas Toman, Harvard Business Review, 2010; Matthew Dixon, Nick Toman & Rick DeLisi, Portfolio/Penguin, 2013
The model
Three me trics, three questions
The three best-known customer metrics ask different questions, so they measure different things. None of them is a standard, and CSAT has no owner at all.
- NPS: Would you recommend us?. 0 to 10; share of 9–10 minus share of 0–6
- CSAT: How satisfied were you?. often 1 to 5; often the share of the two highest answers
- CES: Was it easy?. since 2013, agreement from 1 to 7 with a statement
The model behind the American Cust omer Satisfaction Index (ACSI), 1994
- Expectations. what customers expect
- Quali
t y and value. as customers perceive them - Satisfaction. scored from 0 to 100
- Complaints, loyal
t y. the consequences
Our reading
Recommendation, satisfaction and effort are different things. Pick the question that fits the decision you have to make.
The CSAT practice is common usage, not a standard. The ACSI has been published since October 1994; its satisfaction score is a weighted average of three questions.
Sources: Frederick F. Reichheld, Harvard Business Review, 2003; Neil A. Morgan & Lopo Leotte Rego, Marketing Science, 2006; Matthew Dixon, Nick Toman & Rick DeLisi, Portfolio/Penguin, 2013; Claes Fornell et al., Journal of Marketing, 1996
More in the essay: 61 resellers: what wholesale taught me about trust
What the research says
Does it predict growth?
Reichheld wrote that the recommend question predicts loyalty and growth better than satisfaction surveys. Independent studies tested the claim.
- Keiningham
e t al., 2007. 21 firms and over 15,500 interviews in Norway, compared with the ACSI: no clear superiority of Net Promoter over other measures. - Morgan & Rego, 2006. ACSI data for 1994–2000: average satisfaction predicted business performance best; recommendation measures had little or no value.
- de Haan
e t al., 2015. Customers of 93 firms in 18 industries: top-2-box satisfaction predicted retention best; the best metric varied by industry, and combining helped.
Our reading
No single number wins everywhere. Which one predicts best depends on the business, so test it on your own customers.
Associations, not proof of cause. Morgan and Rego did not use the 0–10 question. Each camp has an interest: Bain advises on NPS, CEB sold CES research, and Ipsos announced the 2007 critique.
Sources: Timothy L. Keiningham et al., Journal of Marketing, 2007; Neil A. Morgan & Lopo Leotte Rego, Marketing Science, 2006; Evert de Haan, Peter C. Verhoef & Thorsten Wiesel, International Journal of Research in Marketing, 2015
How it is measured
One se t of answers, three scores
CSAT is often reported as top-2-box: the share of answers in the two highest points of the scale. Change the rule and the same answers give a different number.
Hypothe tical example, 100 answers on a 1–5 scale
- Answers: 5: 30 · 4: 40 · 3: 15 · 2: 10 · 1: 5
T op-2-box: 4s and 5s of all answers: 70%- No neutrals: the 3s left out of the count: 70 of 85 = 82%
T op box: only the 5s: 30%
Say which rule you use, and keep it. The answers are invented.
- Fix the question, the scale and the rule. Otherwise a change in the score may only be a change in the method.
- Repo
r t the spread, not only the score. The same score can hide very different customers. - Keep the score out of bonuses. NPS's own authors say tying it to frontline bonuses made people chase the score.
The steps and the example are the editors'. Top-2-box follows the studies of Morgan & Rego and de Haan et al.; on bonuses, Reichheld, Darnell & Burns (2021).
Sources: Evert de Haan, Peter C. Verhoef & Thorsten Wiesel, International Journal of Research in Marketing, 2015; Fred Reichheld, Darci Darnell & Maureen Burns, Harvard Business Review, 2021
Open the tool: Last-Mile CX Control Tower
Tool of the issue
The voice-of-the- cust omer card
One card per month. The score is the start of the conversation: the spread, the reasons and the effort tell you what to fix.
- Question and scale word for word, and the rule for the score
- Answers how many, and how many customers did not answer
- Score and spread the score, and the share in each group
T op three reasons from the comments of the lowest scores- Where cus
t omers worked hard repeat contacts, switching channels, waiting - One fix what, who, by when; check it next month
A practice proposed by the editors, after Reichheld (2003) and Dixon, Freeman & Toman (2010).
Sources: Frederick F. Reichheld, Harvard Business Review, 2003; Matthew Dixon, Karen Freeman & Nicholas Toman, Harvard Business Review, 2010
Sources and method
Every figure has a source.
The figures in this issue come from the sources below. The year shows how recent each one is.
- Frederick F. Reichheld, Harvard Business Review, “The One Number You Need to Grow”, 2003. https://hbr.org/2003/12/the-one-number-you-need-to-grow
- Matthew Dixon, Karen Freeman & Nicholas Toman, Harvard Business Review, “Stop Trying to Delight Your Customers”, 2010. https://hbr.org/2010/07/stop-trying-to-delight-your-customers
- Matthew Dixon, Nick Toman & Rick DeLisi, Portfolio/Penguin, “The Effortless Experience: Conquering the New Battleground for Customer Loyalty”, 2013.
- Claes Fornell et al., Journal of Marketing, “The American Customer Satisfaction Index: Nature, Purpose, and Findings”, 1996. https://doi.org/10.2307/1251898
- Neil A. Morgan & Lopo Leotte Rego, Marketing Science, “The Value of Different Customer Satisfaction and Loyalty Metrics in Predicting Business Performance”, 2006. https://doi.org/10.1287/mksc.1050.0180
- Timothy L. Keiningham et al., Journal of Marketing, “A Longitudinal Examination of Net Promoter and Firm Revenue Growth”, 2007. https://doi.org/10.1509/jmkg.71.3.39
- Evert de Haan, Peter C. Verhoef & Thorsten Wiesel, International Journal of Research in Marketing, “The predictive ability of different customer feedback metrics for retention”, 2015. https://doi.org/10.1016/j.ijresmar.2015.02.004
- Fred Reichheld, Darci Darnell & Maureen Burns, Harvard Business Review, “Net Promoter 3.0”, 2021. https://www.bain.com/insights/net-promoter-3-0/
Edit orial me thod
Each figure was checked for its year, its publisher and what exactly it measures. Where the publisher's page could not be opened, the figure was checked against independent summaries and is marked “via”. The editors' interpretation is marked “Our reading”. Figures that could not be confirmed are not in the issue.
Management Review · Monthly edition