When 75 managers checked the newest records of their own units, 47% had at least one critical error on average, and fewer than 3% of the scores met the bar they set themselves. Estimates of the cost run from Gartner's $12.9 million a year per organisation to IBM's $3.1 trillion for the US, neither with a visible method. In AI, 92% of 53 practitioners interviewed had met a data cascade, and the test sets of widely used benchmarks hold at least 3.3% wrong labels on average.
Management Review · Monthly edition · October 2026 · No. 30
The qualit y of data
How many new records carry an error, what bad data costs, six dimensions of quality, data cascades and wrong labels in AI, and a card for measuring your data in one afternoon.
- No.
- 30
- Pages
- 10
- Sources
- 8
- Topics
- AI
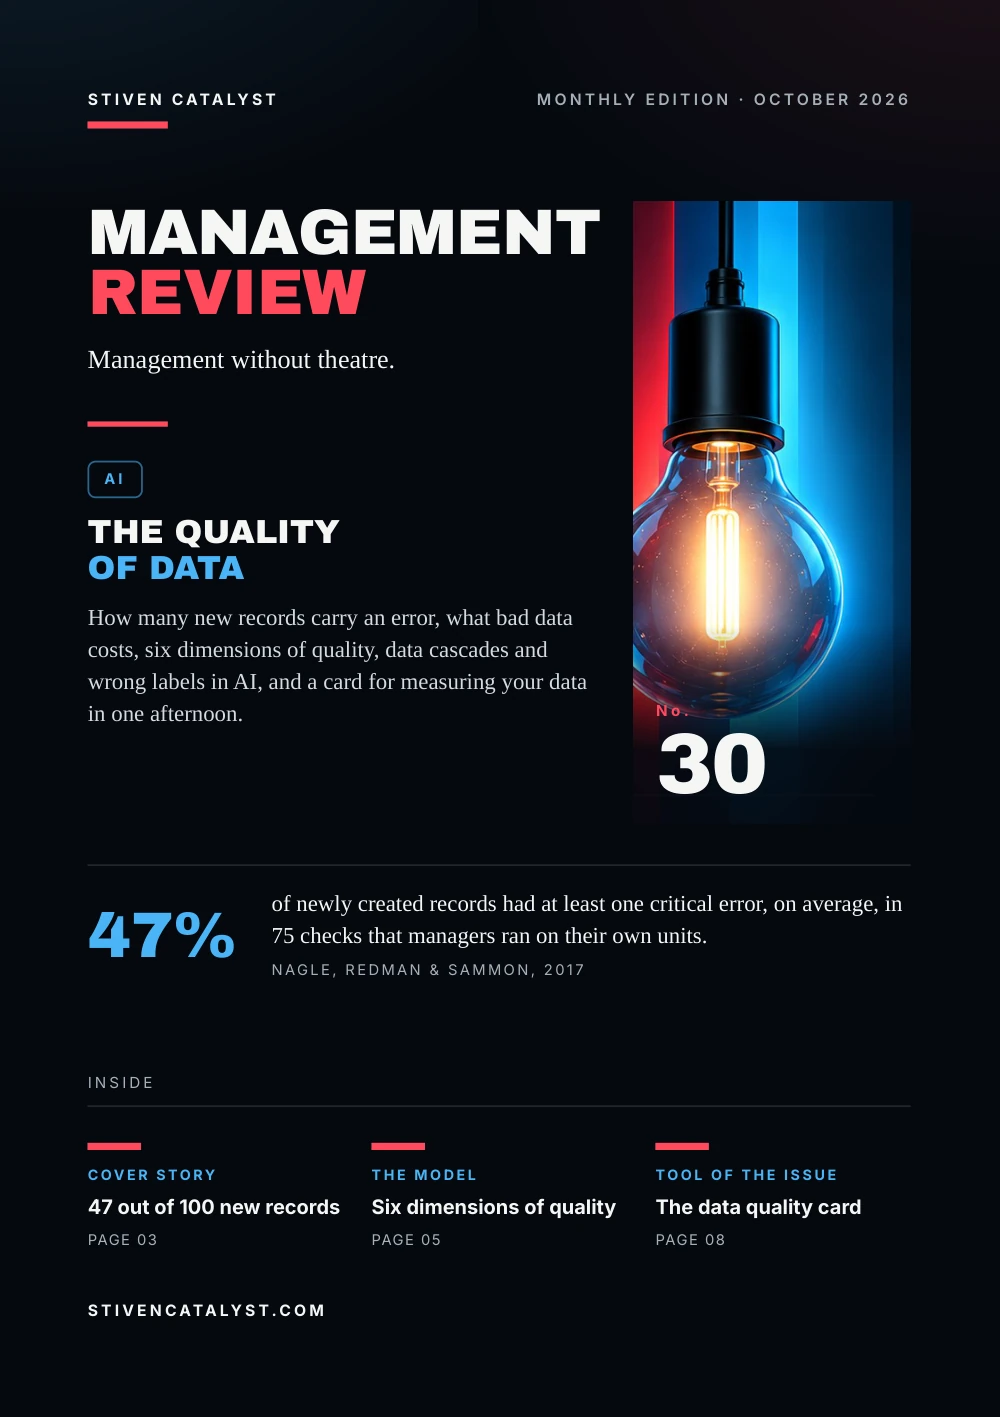
Stiven CatalystMonthly edition · October 2026
ManagementReview
Management without theatre.
AI
The qualityof data
How many new records carry an error, what bad data costs, six dimensions of quality, data cascades and wrong labels in AI, and a card for measuring your data in one afternoon.

No.30
47%
of newly created records had at least one critical error, on average, in 75 checks that managers ran on their own units.Nagle, Redman & Sammon, 2017
stivencatalyst.com
No. 30 · AI
In this issue
Every report, KPI and AI model is only as good as the records behind it. This issue asks how many of those records are wrong, what that costs, and how a team can find out in one afternoon.
- 03Cover story47 out of 100 new records
- 04The numbersWhat bad data costs
- 05The modelSix dimensions of quality
- 06What the research saysEveryone wants the model work
- 07How it is measuredThe Friday afternoon measurement
- 08Tool of the issueThe data quality card
- 09SourcesSources and method
How to read this issue
Figure
Every figure has its source and year at the foot of its page.
Our reading
Where the editors interpret rather than the research, it says so.
Practice
The steps and the card are proposals to try, not research results.
Cover story
47 out of 100new records
Over two years, 75 managers ran the same test on their own units: they took the last 100 records their teams had created or used and counted those without a critical error, one that affects the work.
of newly created records had at least one critical error, on average.
Asked how good the data had to be, no manager called a score below the high nineties acceptable, and fewer than 3% of the scores reached that bar. The scores ranged from 0 to 99, and the authors found no significant differences between industries.
Our reading
The test takes an afternoon and needs no software. The hard part is looking at the records your own team made.
Source: Tadhg Nagle, Thomas C. Redman & David Sammon, Harvard Business Review, 2017
75 measurements by managers in their own units: a small sample, not representative. The bar was the managers' own, and the 3% are measurements, not companies.
The numbers
What bad datacosts
Nobody has measured the full cost of poor data. What exists are estimates and rules of thumb, worth reading together with their caveats.
$12.9ma year: Gartner's average cost of poor data quality per organisation (2021)
50%of knowledge workers' time lost in hidden data factories, by Redman's estimate
44%of German firms that considered AI but do not use it cite the availability or quality of data (2025)
Cost of 100 units of work at $1 each, by Redman's rule of ten ($)
Redman calls the extra steps a team adds to cope with errors made upstream hidden data factories, and his rule of ten says flawed data make a unit of work cost ten times as much. Both are his estimates, not measurements. The best-known figure, $3.1 trillion a year for the US in 2016, was IBM's; Redman later wrote that it could be off by a trillion dollars either way.
Sources: Manasi Sakpal, Gartner, 2021; Thomas C. Redman, Harvard Business Review, 2016 (via SAP Community, 2023); Statistisches Bundesamt (Destatis), 2025; Tadhg Nagle, Thomas C. Redman & David Sammon, Harvard Business Review, 2017
Estimates, not measurements, and not to be added up or compared. Gartner does not show how it reached its average; the German figure is a reason firms report, not a measure of data quality.
The model
Six dimensionsof qualit y
In 2013 a working group of DAMA UK, the data management association, named six primary dimensions for assessing data quality. The UK government adopted them in its 2020 data quality framework.
01
Completeness
nothing that should be there is missing
02
Uniqueness
no record appears twice
03
Timeliness
changes at the source show up quickly where the data are used
04
Validity
values fit the agreed format and rules
05
Accuracy
the data reflect reality
06
Consistency
the data agree across sources, which does not make them accurate
For AI, Gartner sets a different test: data are AI-ready when they represent the use case, including the patterns, errors and outliers a model needs. In a 2024 Gartner survey of 1,203 data management leaders, 63% said their organisation did not have, or was not sure it had, the right data practices for AI.
Our reading
Clean is not the same as fit for use. The question is always: good enough for what?
Sources: DAMA UK Working Group, 2013 (via UK Government Data Quality Framework, 2020); Gartner, 2025
The definitions follow summaries of the DAMA UK document; DAMA-DMBOK and other sources give longer lists. The 63% is a self-report.
More in the essayMistakes get lost between departments
What the research says
Everyone wantsthe model work
Nithya Sambasivan and colleagues at Google interviewed 53 practitioners who build AI for high-stakes uses in India, East and West Africa and the US. 92% had met at least one data cascade: a data problem that compounds and harms results further down the line.
Wrong labels in the test sets of widely used benchmarks (%)
Curtis Northcutt, Anish Athalye and Jonas Mueller found at least 3.3% wrong labels on average in the test sets of ten widely used datasets of images, text and audio. Such errors can reverse the ranking of models: on ImageNet, the smaller ResNet-18 beats ResNet-50 if the share of originally mislabelled test examples rises by just 6%.
Our reading
A model is judged against data. If the data are wrong, so is the judgment.
Sources: Nithya Sambasivan et al., ACM CHI, 2021; Curtis G. Northcutt, Anish Athalye & Jonas Mueller, NeurIPS Datasets and Benchmarks, 2021
Interviews with 53 people, not a representative survey; public test sets, not company data. Versions of the paper give 3.3% or 3.4%.
How it is measured
The Friday af ternoonmeasurement
The method of Nagle, Redman and Sammon needs no software: a team, an afternoon and the last 100 records it created or used.
Take the last 100 records
the ones your unit created or used most recently
Pick the 10–15 most important fields
the ones the next step depends on
Mark every visible error
record by record, with people who know the data
Count the error-free records
that number, from 0 to 100, is the score
Hypothetical example, 100 customer orders
- Errors
- wrong address in 9, no phone number in 14, wrong quantity in 5; 4 orders have two errors
- Score
- 24 orders have an error, 76 are clean: score 76
- Rule of ten
- $100 of work costs 76 + 24 × 10 = $316
The orders and errors are invented.
Source: Tadhg Nagle, Thomas C. Redman & David Sammon, Harvard Business Review, 2017
The steps follow Nagle, Redman & Sammon (2017); the rule of ten is Redman's rule of thumb; the example is the editors'.
Tool of the issue
The data qualit ycard
One card per check, once a month. Count the errors by field, then sort them: a few fields usually carry most of them.
01Records checkedwhich 100, from which step, on which date
02Critical fieldsthe 10–15 fields the next step depends on
03Errors by fieldmissing, wrong, duplicate or out of date
04Scoreerror-free records out of 100
05Where errors startthe step or system where most are created
06Fix at the sourceone change, who, by when; measure again next month
Sources: Tadhg Nagle, Thomas C. Redman & David Sammon, Harvard Business Review, 2017; DAMA UK Working Group, 2013 (via UK Government Data Quality Framework, 2020)
A practice proposed by the editors, after the Friday afternoon measurement (2017) and the DAMA UK dimensions (2013).
Open the tool: Pareto 80/20stivencatalyst.com/tools/pareto/
Sources and method
Every figurehas a source.
The figures in this issue come from the sources below. The year shows how recent each one is.
- Only 3% of Companies’ Data Meets Basic Quality StandardsTadhg Nagle, Thomas C. Redman & David Sammon, Harvard Business Review, 2017https://hbr.org/2017/09/only-3-of-companies-data-meets-basic-quality-standards
- Gründe gegen die Nutzung von Technologien der künstlichen Intelligenz nach BeschäftigtengrößenklassenStatistisches Bundesamt (Destatis), 2025https://www.destatis.de/DE/Themen/Branchen-Unternehmen/Unternehmen/IKT-in-Unternehmen-IKT-Branche/Tabellen/ikti-gegen-nutzung-kuenstliche-intelligenz.html
- “Everyone wants to do the model work, not the data work”: Data Cascades in High-Stakes AINithya Sambasivan et al., ACM CHI, 2021https://research.google/pubs/everyone-wants-to-do-the-model-work-not-the-data-work-data-cascades-in-high-stakes-ai/
- Pervasive Label Errors in Test Sets Destabilize Machine Learning BenchmarksCurtis G. Northcutt, Anish Athalye & Jonas Mueller, NeurIPS Datasets and Benchmarks, 2021https://arxiv.org/abs/2103.14749
- Bad Data Costs the U.S. $3 Trillion Per YearThomas C. Redman, Harvard Business Review, 2016 · via SAP Community, 2023https://hbr.org/2016/09/bad-data-costs-the-u-s-3-trillion-per-year
- Lack of AI-Ready Data Puts AI Projects at RiskGartner, 2025https://www.gartner.com/en/newsroom/press-releases/2025-02-26-lack-of-ai-ready-data-puts-ai-projects-at-risk
- How to Improve Your Data QualityManasi Sakpal, Gartner, 2021https://www.gartner.com/smarterwithgartner/how-to-improve-your-data-quality
- The Six Primary Dimensions for Data Quality AssessmentDAMA UK Working Group, 2013 · via UK Government Data Quality Framework, 2020
Editorial method
Each figure was checked for its year, its publisher and what exactly it measures. Where the publisher's page could not be opened, the figure was checked against independent summaries and is marked “via”. The editors' interpretation is marked “Our reading”. Figures that could not be confirmed are not in the issue.
ManagementReview
Management without theatre.
Every issue, one management question, checked against the best research.
All issues
stivencatalyst.com/magazine/management-review.html
Management Review · No. 30 · October 2026 · Stiven Catalyst
Click or swipe a page to turn it. The arrow keys work too.
Management Review · No. 30
The figures of the issue
The charts of the printed pages, with their sources.
47% of newly created records had at least one critical error, on average.
Source: Tadhg Nagle, Thomas C. Redman & David Sammon, Harvard Business Review, 2017
Source: Tadhg Nagle, Thomas C. Redman & David Sammon, Harvard Business Review, 2017
Source: Curtis G. Northcutt, Anish Athalye & Jonas Mueller, NeurIPS Datasets and Benchmarks, 2021
The whole text Read the issue as text For reading on a small screen, searching or a screen reader. The same words, without the page design.
In this issue
Every report, KPI and AI model is only as good as the records behind it. This issue asks how many of those records are wrong, what that costs, and how a team can find out in one afternoon.
When 75 managers checked the newest records of their own units, 47% had at least one critical error on average, and fewer than 3% of the scores met the bar they set themselves. Estimates of the cost run from Gartner's $12.9 million a year per organisation to IBM's $3.1 trillion for the US, neither with a visible method. In AI, 92% of 53 practitioners interviewed had met a data cascade, and the test sets of widely used benchmarks hold at least 3.3% wrong labels on average.
Stiven Janaqi, Editor
Cover story
47 out of 100 new records
Over two years, 75 managers ran the same test on their own units: they took the last 100 records their teams had created or used and counted those without a critical error, one that affects the work.
47% of newly created records had at least one critical error, on average.
Asked how good the data had to be, no manager called a score below the high nineties acceptable, and fewer than 3% of the scores reached that bar. The scores ranged from 0 to 99, and the authors found no significant differences between industries.
Our reading
The test takes an afternoon and needs no software. The hard part is looking at the records your own team made.
75 measurements by managers in their own units: a small sample, not representative. The bar was the managers' own, and the 3% are measurements, not companies.
Source: Tadhg Nagle, Thomas C. Redman & David Sammon, Harvard Business Review, 2017
The numbers
What bad data costs
Nobody has measured the full cost of poor data. What exists are estimates and rules of thumb, worth reading together with their caveats.
- $12.9m a year: Gartner's average cost of poor data quality per organisation (2021)
- 50% of knowledge workers' time lost in hidden data factories, by Redman's estimate
- 44% of German firms that considered AI but do not use it cite the availability or quality of data (2025)
Cost of 100 units of work at $1 each, by Redman's rule of ten ($): All data clean 100, 11 records flawed 199.
Redman calls the extra steps a team adds to cope with errors made upstream hidden data factories, and his rule of ten says flawed data make a unit of work cost ten times as much. Both are his estimates, not measurements. The best-known figure, $3.1 trillion a year for the US in 2016, was IBM's; Redman later wrote that it could be off by a trillion dollars either way.
Estimates, not measurements, and not to be added up or compared. Gartner does not show how it reached its average; the German figure is a reason firms report, not a measure of data quality.
Sources: Manasi Sakpal, Gartner, 2021; Thomas C. Redman, Harvard Business Review, 2016 (via SAP Community, 2023); Statistisches Bundesamt (Destatis), 2025; Tadhg Nagle, Thomas C. Redman & David Sammon, Harvard Business Review, 2017
The model
Six dimensions of qualit y
In 2013 a working group of DAMA UK, the data management association, named six primary dimensions for assessing data quality. The UK government adopted them in its 2020 data quality framework.
- Compl
e teness. nothing that should be there is missing - Uniqueness. no record appears twice
- Timeliness. changes at the source show up quickly where the data are used
- Validi
t y. values fit the agreed format and rules - Accuracy. the data reflect reality
- Consistency. the data agree across sources, which does not make them accurate
For AI, Gartner sets a different test: data are AI-ready when they represent the use case, including the patterns, errors and outliers a model needs. In a 2024 Gartner survey of 1,203 data management leaders, 63% said their organisation did not have, or was not sure it had, the right data practices for AI.
Our reading
Clean is not the same as fit for use. The question is always: good enough for what?
The definitions follow summaries of the DAMA UK document; DAMA-DMBOK and other sources give longer lists. The 63% is a self-report.
Sources: DAMA UK Working Group, 2013 (via UK Government Data Quality Framework, 2020); Gartner, 2025
More in the essay: Mistakes get lost between departments
What the research says
Everyone wants the model work
Nithya Sambasivan and colleagues at Google interviewed 53 practitioners who build AI for high-stakes uses in India, East and West Africa and the US. 92% had met at least one data cascade: a data problem that compounds and harms results further down the line.
Wrong labels in the test sets of widely used benchmarks (%): MNIST 0.15, Average of 10 datasets 3.3, ImageNet validation set 6, QuickDraw 10.12.
Curtis Northcutt, Anish Athalye and Jonas Mueller found at least 3.3% wrong labels on average in the test sets of ten widely used datasets of images, text and audio. Such errors can reverse the ranking of models: on ImageNet, the smaller ResNet-18 beats ResNet-50 if the share of originally mislabelled test examples rises by just 6%.
Our reading
A model is judged against data. If the data are wrong, so is the judgment.
Interviews with 53 people, not a representative survey; public test sets, not company data. Versions of the paper give 3.3% or 3.4%.
Sources: Nithya Sambasivan et al., ACM CHI, 2021; Curtis G. Northcutt, Anish Athalye & Jonas Mueller, NeurIPS Datasets and Benchmarks, 2021
How it is measured
The Friday af ternoon measurement
The method of Nagle, Redman and Sammon needs no software: a team, an afternoon and the last 100 records it created or used.
- Take the last 100 records. the ones your unit created or used most recently
- Pick the 10–15 most impo
r tant fields. the ones the next step depends on - Mark every visible error. record by record, with people who know the data
- Count the error-free records. that number, from 0 to 100, is the score
Hypothe tical example, 100 cust omer orders
- Errors: wrong address in 9, no phone number in 14, wrong quantity in 5; 4 orders have two errors
- Score: 24 orders have an error, 76 are clean: score 76
- Rule of ten: $100 of work costs 76 + 24 × 10 = $316
The orders and errors are invented.
The steps follow Nagle, Redman & Sammon (2017); the rule of ten is Redman's rule of thumb; the example is the editors'.
Source: Tadhg Nagle, Thomas C. Redman & David Sammon, Harvard Business Review, 2017
Tool of the issue
The data qualit y card
One card per check, once a month. Count the errors by field, then sort them: a few fields usually carry most of them.
- Records checked which 100, from which step, on which date
- Critical fields the 10–15 fields the next step depends on
- Errors by field missing, wrong, duplicate or out of date
- Score error-free records out of 100
- Where errors sta
r t the step or system where most are created - Fix at the source one change, who, by when; measure again next month
A practice proposed by the editors, after the Friday afternoon measurement (2017) and the DAMA UK dimensions (2013).
Sources: Tadhg Nagle, Thomas C. Redman & David Sammon, Harvard Business Review, 2017; DAMA UK Working Group, 2013 (via UK Government Data Quality Framework, 2020)
Open the tool: Pareto 80/20
Sources and method
Every figure has a source.
The figures in this issue come from the sources below. The year shows how recent each one is.
- Tadhg Nagle, Thomas C. Redman & David Sammon, Harvard Business Review, “Only 3% of Companies’ Data Meets Basic Quality Standards”, 2017. https://hbr.org/2017/09/only-3-of-companies-data-meets-basic-quality-standards
- Statistisches Bundesamt (Destatis), “Gründe gegen die Nutzung von Technologien der künstlichen Intelligenz nach Beschäftigtengrößenklassen”, 2025. https://www.destatis.de/DE/Themen/Branchen-Unternehmen/Unternehmen/IKT-in-Unternehmen-IKT-Branche/Tabellen/ikti-gegen-nutzung-kuenstliche-intelligenz.html
- Nithya Sambasivan et al., ACM CHI, ““Everyone wants to do the model work, not the data work”: Data Cascades in High-Stakes AI”, 2021. https://research.google/pubs/everyone-wants-to-do-the-model-work-not-the-data-work-data-cascades-in-high-stakes-ai/
- Curtis G. Northcutt, Anish Athalye & Jonas Mueller, NeurIPS Datasets and Benchmarks, “Pervasive Label Errors in Test Sets Destabilize Machine Learning Benchmarks”, 2021. https://arxiv.org/abs/2103.14749
- Thomas C. Redman, Harvard Business Review, “Bad Data Costs the U.S. $3 Trillion Per Year”, 2016 (via SAP Community, 2023). https://hbr.org/2016/09/bad-data-costs-the-u-s-3-trillion-per-year
- Gartner, “Lack of AI-Ready Data Puts AI Projects at Risk”, 2025. https://www.gartner.com/en/newsroom/press-releases/2025-02-26-lack-of-ai-ready-data-puts-ai-projects-at-risk
- Manasi Sakpal, Gartner, “How to Improve Your Data Quality”, 2021. https://www.gartner.com/smarterwithgartner/how-to-improve-your-data-quality
- DAMA UK Working Group, “The Six Primary Dimensions for Data Quality Assessment”, 2013 (via UK Government Data Quality Framework, 2020).
Edit orial me thod
Each figure was checked for its year, its publisher and what exactly it measures. Where the publisher's page could not be opened, the figure was checked against independent summaries and is marked “via”. The editors' interpretation is marked “Our reading”. Figures that could not be confirmed are not in the issue.
Management Review · Monthly edition