

In this issue
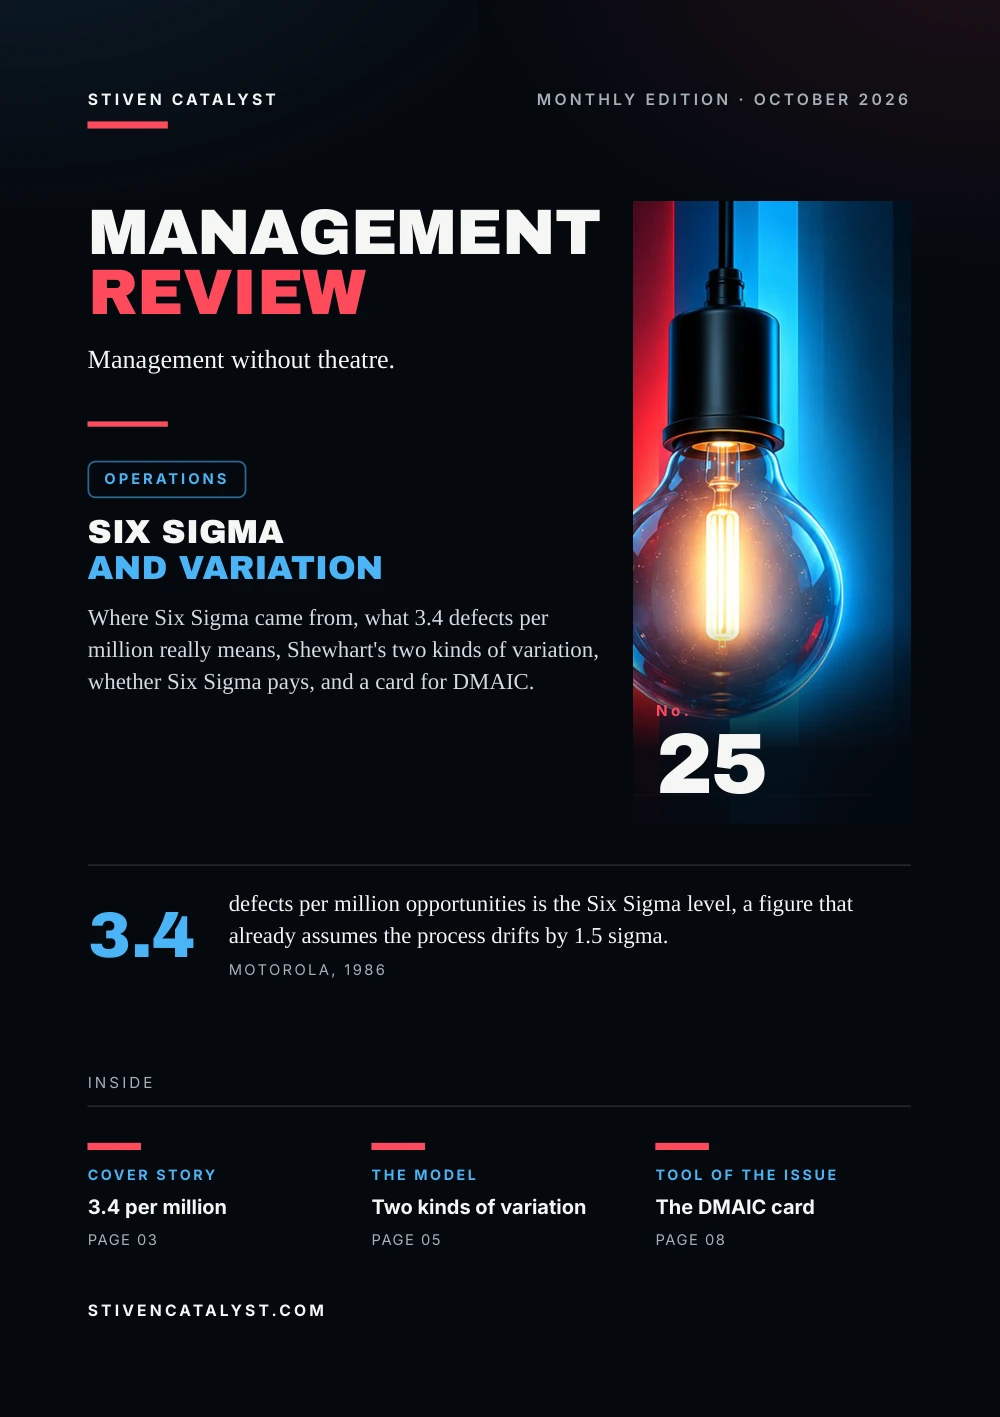
Every process varies: the same task takes eight minutes one day and twelve the next. This issue is about telling the variation that belongs to the process from the variation that has a cause you can find, and about Six Sigma, the programme built to reduce it.
Motorola dates Six Sigma to 1986. Its 3.4 defects per million opportunities assumes that a process drifts by 1.5 sigma over time. The idea behind it is older: in 1924 Walter Shewhart proposed the control chart to separate two sources of variation, and Deming estimated that 94% of troubles belong to the system. Two studies of 200 and 84 firms found that adopting Six Sigma went with better performance.
Stiven Janaqi, Editor
Cover story
3.4 per million
Motorola dates the invention of Six Sigma to 1986. The term is credited to its engineer Bill Smith; chairman Bob Galvin launched the programme across the company in 1987.
Six Sigma sets out to reduce the variation of processes, because defects come from it. A process at six sigma gives 3.4 defects per million opportunities: not per million products, since one product can fail in many places.
- 3.4 defects per million opportunities, with the 1.5 sigma shift
- ≈0.002 per million at ±6 sigma without the shift
The 3.4 rests on a convention. Over time, the mean of a process is assumed to drift by up to 1.5 sigma, so a six-sigma process behaves in the long run like a 4.5-sigma one. The shift is Motorola's choice, not a law of statistics, and it has been criticised in the literature.
Our reading
Six Sigma is less a number than a habit: measuring variation before arguing about it.
Sources: Motorola Solutions, 2026; iSixSigma, 2026
The numbers
From three t o six sigma
With the 1.5 sigma convention, each step up the scale cuts the defects per million opportunities sharply.
Defects per million opportunities, by sigma level, with the 1.5 sigma shift: 3σ 66,807, 4σ 6,210, 5σ 233, 6σ 3.4.
- 93.32% of opportunities without a defect at three sigma
- 99.99966% at six sigma
Our reading
The table is arithmetic on a convention, not measurements from factories. Its value is in showing how far apart three and six sigma are.
Calculated with the 1.5 sigma shift; some tables round three sigma to 66,810 or 66,800.
Source: iSixSigma, 2026
The model
Two kinds of variation
In an internal memo of 16 May 1924, Walter Shewhart of Western Electric proposed the control chart to his superiors. He separated two sources of variation.
Common causes
- Part of the process itself
- Reduced only by changing the process
Special causes
- Appear now and then
- Can be found and removed
94% of troubles and possibilities for improvement belong to the system, by Deming's estimate from experience; 6% are special.
Our reading
Blaming a person for what the system produces changes nothing. Treating a special cause as normal lets it come back.
Shewhart called them chance and assignable causes; Deming named them common and special. The 94% is Deming's estimate, not a measurement.
Sources: ASQ, Honorary Members, 2026; W. Edwards Deming, MIT Center for Advanced Engineering Study, 1986
More in the essay: A good SOP is not a document
What the research says
Does Six Sigma pay?
Two studies in the Journal of Operations Management in 2012 compared firms that adopted Six Sigma with similar firms that did not.
- 200 firms. Morgan Swink and Brian Jacobs matched each firm with control firms of similar return on assets before adoption, industry and size. Six Sigma had a positive effect on return on assets, mainly through significant cuts in indirect costs.
- 84 firms, ten years. Scott Shafer and Sara Moeller followed firms from three years before adoption to six years after, against control groups. Overall, adopting Six Sigma went with better firm performance.
Our reading
Both studies look at firms that announced adoption. They show what tended to follow, not what Six Sigma guarantees.
Associations, not full proof of cause; we could not see the effect sizes of the second study.
Sources: Morgan Swink & Brian W. Jacobs, Journal of Operations Management, 2012; Scott M. Shafer & Sara B. Moeller, Journal of Operations Management, 2012
How it is measured
Reading a control char t
A control chart plots one measure over time, with limits three standard deviations from the mean. In a stable process a point falls outside them with a probability of 0.27%: about one false alarm in 370 points.
- Plot one measure in time order. Per day, shift or batch, always counted the same way.
- Draw the mean and the limits. Three standard deviations above and below the mean.
- Act on signals. A point outside the limits points to a special cause: look for it.
- Improve the process for the rest. Inside the limits, work on the process as a whole, not on single points.
Hypothe tical example, minutes t o load a truck
- Mean: 42 minutes
- Limits: 30 to 54 minutes
- Day 17: 61 minutes: outside, a forklift was down
Only day 17 calls for a search for a cause; the rest is the process. The numbers are invented.
The steps and the example are the editors'; the limits and the false-alarm rate follow NIST.
Source: NIST & SEMATECH, 2026
Open the tool: Sigma & Control Chart
Tool of the week
The DMAIC card
DMAIC is ASQ's structured way to improve an existing process that falls short of its standard or of what the customer expects. One card per project.
- Define the problem, the customer and the goal, on one page
- Measure the baseline, and whether the measurement itself can be trusted
- Anal
y ze the main causes, shown with data - Improve the change, tested before it is rolled out
- Control the control plan and the chart that keeps the gain
- For a new process DMADV instead: define, measure, analyze, design, verify
The five phases follow ASQ; the card is the editors'.
Source: ASQ, 2026
Open the tool: Six Sigma in the Warehouse
Sources and method
Every figure has a source.
The figures in this issue come from the sources below. The year shows how recent each one is.
- Motorola Solutions, “Timeline”, 2026. https://www.motorolasolutions.com/en_xl/about/history/timeline.html
- iSixSigma, “Sigma Performance Levels: One to Six Sigma”, 2026. https://isixsigma.com/basics/sigma-performance-levels-one-six-sigma
- ASQ, Honorary Members, “Walter A. Shewhart”, 2026. https://asq.org/about-asq/honorary-members/shewhart
- W. Edwards Deming, MIT Center for Advanced Engineering Study, “Out of the Crisis”, 1986.
- Morgan Swink & Brian W. Jacobs, Journal of Operations Management, “Six Sigma adoption: Operating performance impacts and contextual drivers of success”, 2012. https://doi.org/10.1016/j.jom.2012.05.001
- Scott M. Shafer & Sara B. Moeller, Journal of Operations Management, “The effects of Six Sigma on corporate performance: An empirical investigation”, 2012. https://doi.org/10.1016/j.jom.2012.10.002
- NIST & SEMATECH, “NIST/SEMATECH e-Handbook of Statistical Methods: Cusum Average Run Length”, 2026. https://www.itl.nist.gov/div898/handbook/pmc/section3/pmc3231.htm
- ASQ, “DMAIC Process: Define, Measure, Analyze, Improve, Control”, 2026. https://asq.org/quality-resources/dmaic
Edit orial me thod
Each figure was checked for its year, its publisher and what exactly it measures. Where the publisher's page could not be opened, the figure was checked against independent summaries and is marked “via”. The editors' interpretation is marked “Our reading”. Figures that could not be confirmed are not in the issue.