

In this issue
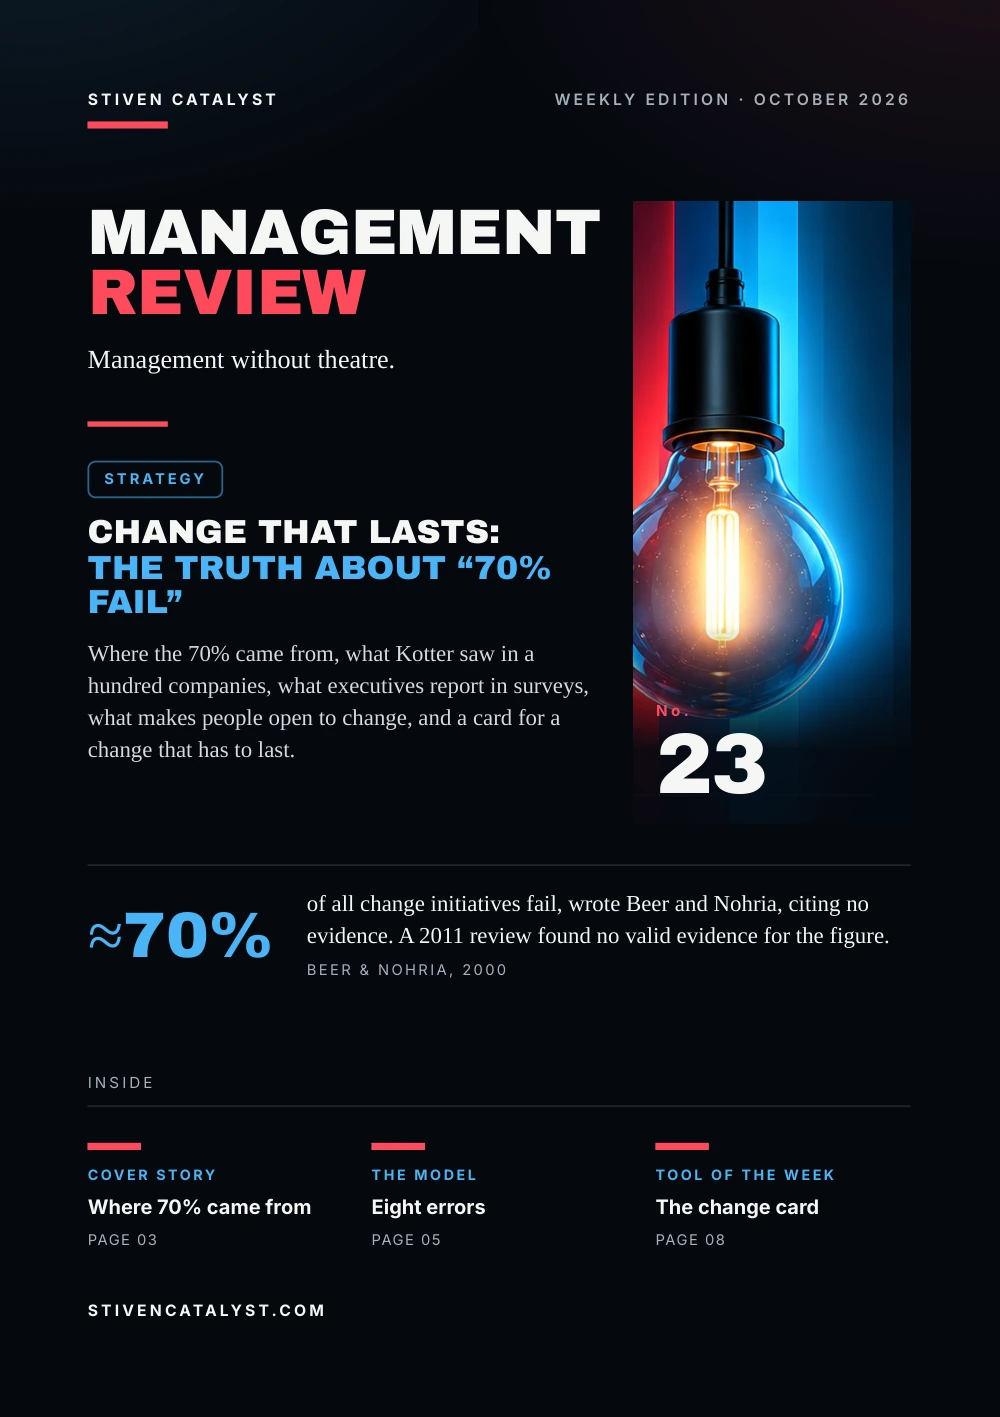
Few management claims are repeated as often as “70% of change efforts fail”. This issue asks where the figure came from, what the evidence actually says, and what makes a change last after the project ends.
In 1993 Hammer and Champy gave an “unscientific estimate” that up to 50–70% of organisations that start reengineering miss the dramatic results they intended. In 2000 Beer and Nohria wrote, without evidence, that about 70% of all change initiatives fail; in 2011 Mark Hughes found no valid evidence for the figure. Kotter, who followed more than a hundred companies, gave no percentage. In McKinsey's 2015 survey, 26% of executives said their transformation had improved performance and kept the gains.
Stiven Janaqi, Editor
Cover story
Where 70% came from
The figure has a history. It began as a cautious estimate about one kind of change and became a rule about all of them.
- 1993 Hammer and Champy, Reengineering the Corporation: an “unscientific estimate” that up to 50–70% of organisations that start reengineering miss the dramatic results they intended.
- 1995 Kotter, in Harvard Business Review, after following more than 100 companies: a few very successful, a few utter failures, most in between. No percentage.
- 2000 Beer and Nohria, in Harvard Business Review: about 70% of all change initiatives fail. No source is given.
- 2011 Mark Hughes, Journal of Change Management: no valid and reliable empirical evidence supports the figure.
Missing the dramatic results intended is not the same as failing, and reengineering is not every kind of change. Between 1993 and 2000 both distinctions were lost.
Our reading
The 70% says more about how management ideas travel than about change. When someone quotes it, ask: failed at what, and measured how?
Sources: Michael Hammer & James Champy, HarperBusiness, 1993; John P. Kotter, Harvard Business Review, 1995; Michael Beer & Nitin Nohria, Harvard Business Review, 2000; Mark Hughes, Journal of Change Management, 2011
The numbers
What executives repor t
McKinsey has asked executives for years how their transformations went. The answers are their own assessments, and each survey defines success in its own way.
Where the lost value of a transformation goes, as respondents estimate it (2021): Setting targets 22%, Planning 23%, Implementation 35%, After implementation 20%.
- 26% said their transformation improved performance and kept the gains (2015; 20% in 2012)
- 79% said so among those who followed a rigorous approach and completed every action
Our reading
More than half of the lost value goes during and after implementation. The plan is rarely the weakest part; carrying it out and keeping it is.
Executives' own assessments, not measured results; we have not seen the sample sizes.
Sources: McKinsey & Company, 2021; McKinsey & Company, 2015
The model
Eight errors
Kotter gave no failure rate. He described the errors he saw most often, in the order a change passes through them.
Ge t ting star ted
- 1 Not enough urgency
- 2 A guiding coalition that is not strong enough
- 3 No vision
- 4 The vision communicated far too little
Carrying it through
- 5 Obstacles not removed
- 6 No short-term wins planned
- 7 Victory declared too soon
- 8 Changes not anchored in the culture
Well over half of the companies he followed failed at the first step. Urgency is enough, he wrote, when about 75% of the management is honestly convinced that business as usual is unacceptable. A review in 2012 found support for most steps one by one, but no formal test of the whole model.
Our reading
Kotter's list is a map of where change breaks, not a proof of how it succeeds. Used that way, it is useful.
Sources: John P. Kotter, Harvard Business Review, 1995; Steven H. Appelbaum et al., Journal of Management Development, 2012
More in the essay: The first 30 days: how I read an operation I do not know
What the research says
What opens people t o change
Connie Wanberg and Joseph Banas followed the employees of one organisation through a large reorganisation and asked who stayed open to the changes.
- Information. Those who were told about the changes were more open to them.
- Confidence. Those who felt able to cope with the changes were more open.
- A say. Those who took part in decisions about the changes were more open.
Lower acceptance went with less job satisfaction, more irritation and a stronger intention to leave. In McKinsey's 2015 survey, continuous-improvement activities went with about twice the odds that results lasted.
Our reading
A change lasts in the people who carry it. Information, confidence and a say cost little next to a change that has to be made twice.
One organisation and questionnaires; McKinsey's figures are self-reports. We have not seen the sample sizes.
Sources: Connie R. Wanberg & Joseph T. Banas, Journal of Applied Psychology, 2000; McKinsey & Company, 2015
How it is measured
Measure af ter the project
A change is usually measured when the project closes. Whether it lasted shows later, when nobody is watching any more.
- Name the result and the date. One number the change should move, and by when.
- Measure before. Four weeks of the old way, so the start is known.
- Measure at the end. On the day the project closes.
- Measure again at 3, 6 and 12 months. Until a change takes root, Kotter warned, it can slide back.
Hypothe tical example, a new handover routine
- Before: 6 of 10 handovers complete
- Project end: 9 of 10
- 3 months: 9 of 10
- 6 months: 7 of 10
The slide at six months is the signal to act again. The numbers are invented.
The steps and the example are the editors'.
Source: John P. Kotter, Harvard Business Review, 1995
Tool of the week
The change card
One card for one change. Fill it in before the change starts, and look at it again on each check date.
- What changes in one sentence, and the number that should move
- Why now what happens if nothing changes
- Who leads the people who carry it, and who decides
- What people need information, the confidence to cope, a say in decisions
- First win something visible within weeks
- Check dates project end, then 3, 6 and 12 months
A practice proposed by the editors, after Kotter's eight errors and the findings of Wanberg and Banas.
Sources: John P. Kotter, Harvard Business Review, 1995; Connie R. Wanberg & Joseph T. Banas, Journal of Applied Psychology, 2000
Sources and method
Every figure has a source.
The figures in this issue come from the sources below. The year shows how recent each one is.
- Michael Hammer & James Champy, HarperBusiness, “Reengineering the Corporation: A Manifesto for Business Revolution”, 1993.
- John P. Kotter, Harvard Business Review, “Leading Change: Why Transformation Efforts Fail”, 1995. https://hbr.org/1995/05/leading-change-why-transformation-efforts-fail-2
- Michael Beer & Nitin Nohria, Harvard Business Review, “Cracking the Code of Change”, 2000. https://hbr.org/2000/05/cracking-the-code-of-change
- Mark Hughes, Journal of Change Management, “Do 70 Per Cent of All Organizational Change Initiatives Really Fail?”, 2011. https://doi.org/10.1080/14697017.2011.630506
- McKinsey & Company, “Losing from day one: Why even successful transformations fall short”, 2021. https://www.mckinsey.com/capabilities/people-and-organizational-performance/our-insights/successful-transformations
- McKinsey & Company, “How to beat the transformation odds”, 2015. https://www.mckinsey.com/capabilities/people-and-organizational-performance/our-insights/how-to-beat-the-transformation-odds
- Steven H. Appelbaum et al., Journal of Management Development, “Back to the future: revisiting Kotter's 1996 change model”, 2012. https://doi.org/10.1108/02621711211253231
- Connie R. Wanberg & Joseph T. Banas, Journal of Applied Psychology, “Predictors and outcomes of openness to changes in a reorganizing workplace”, 2000. https://doi.org/10.1037/0021-9010.85.1.132
Edit orial me thod
Each figure was checked for its year, its publisher and what exactly it measures. Where the publisher's page could not be opened, the figure was checked against independent summaries and is marked “via”. The editors' interpretation is marked “Our reading”. Figures that could not be confirmed are not in the issue.