In this issue
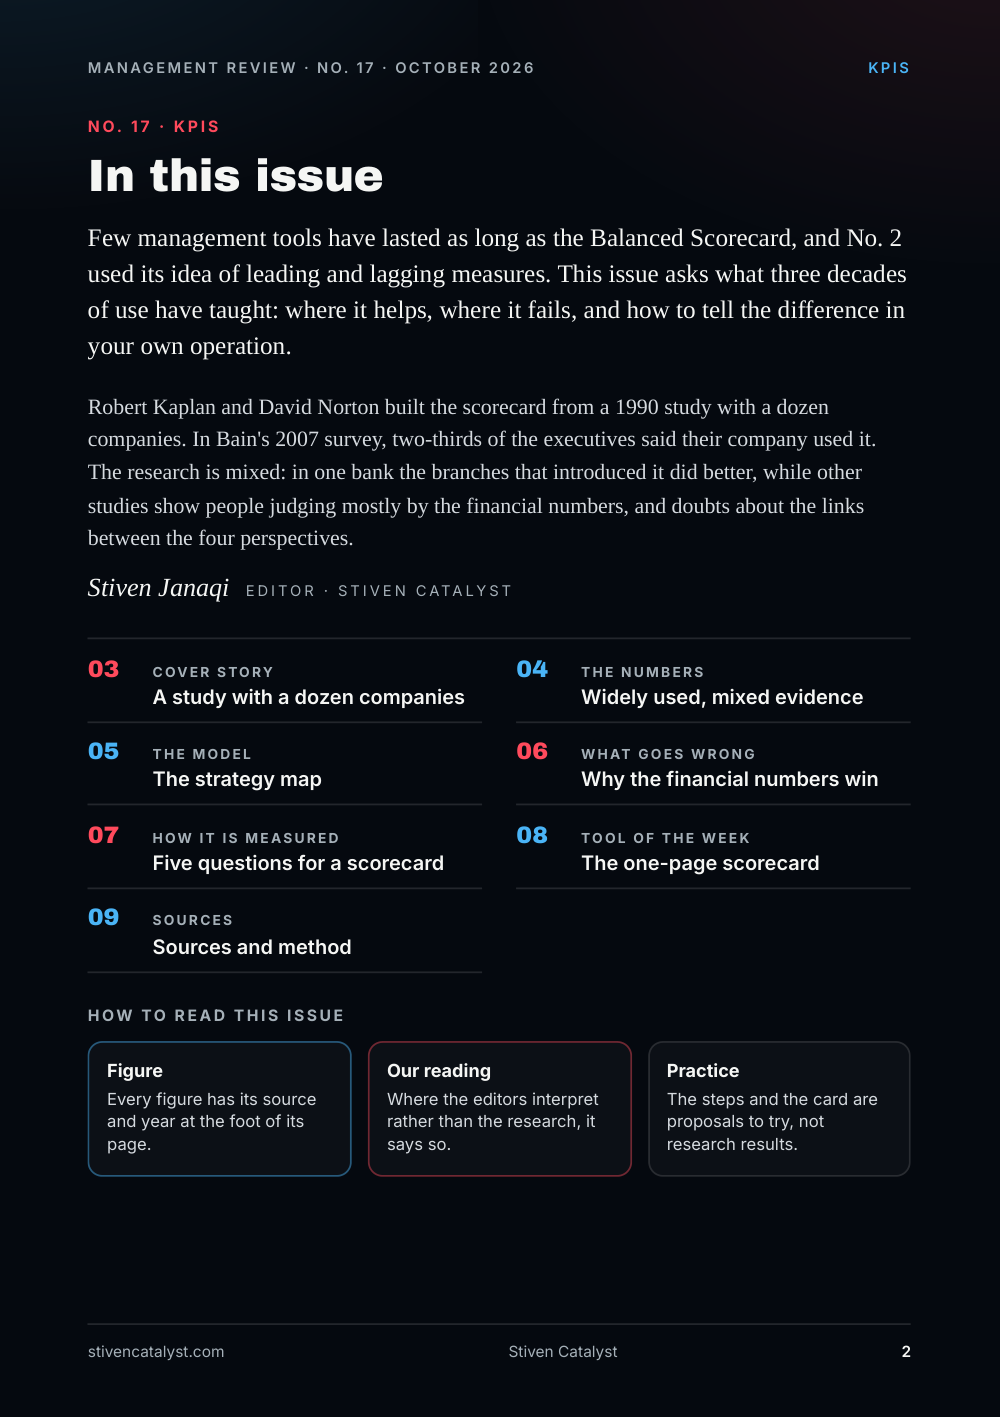
Few management tools have lasted as long as the Balanced Scorecard, and No. 2 used its idea of leading and lagging measures. This issue asks what three decades of use have taught: where it helps, where it fails, and how to tell the difference in your own operation.
Robert Kaplan and David Norton built the scorecard from a 1990 study with a dozen companies. In Bain's 2007 survey, two-thirds of the executives said their company used it. The research is mixed: in one bank the branches that introduced it did better, while other studies show people judging mostly by the financial numbers, and doubts about the links between the four perspectives.
Stiven Janaqi, Editor
Cover story
A study with a dozen companies
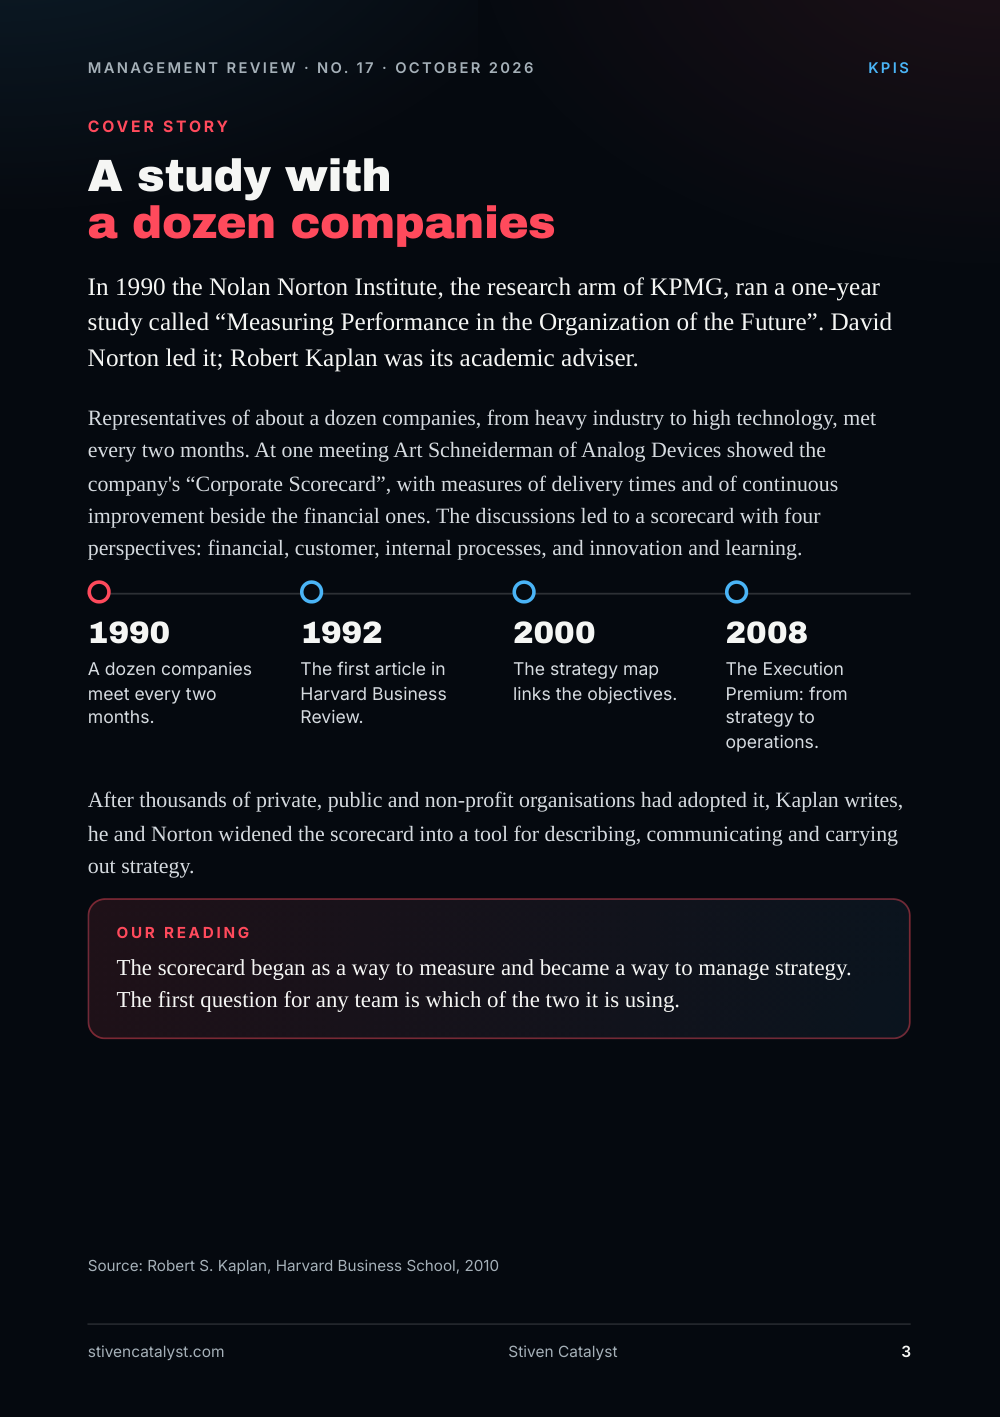
In 1990 the Nolan Norton Institute, the research arm of KPMG, ran a one-year study called “Measuring Performance in the Organization of the Future”. David Norton led it; Robert Kaplan was its academic adviser.
Representatives of about a dozen companies, from heavy industry to high technology, met every two months. At one meeting Art Schneiderman of Analog Devices showed the company's “Corporate Scorecard”, with measures of delivery times and of continuous improvement beside the financial ones. The discussions led to a scorecard with four perspectives: financial, customer, internal processes, and innovation and learning.
- 1990 A dozen companies meet every two months.
- 1992 The first article in Harvard Business Review.
- 2000 The strategy map links the objectives.
- 2008 The Execution Premium: from strategy to operations.
After thousands of private, public and non-profit organisations had adopted it, Kaplan writes, he and Norton widened the scorecard into a tool for describing, communicating and carrying out strategy.
Our reading
The scorecard began as a way to measure and became a way to manage strategy. The first question for any team is which of the two it is using.
Source: Robert S. Kaplan, Harvard Business School, 2010
The numbers
Widely used, mixed evidence
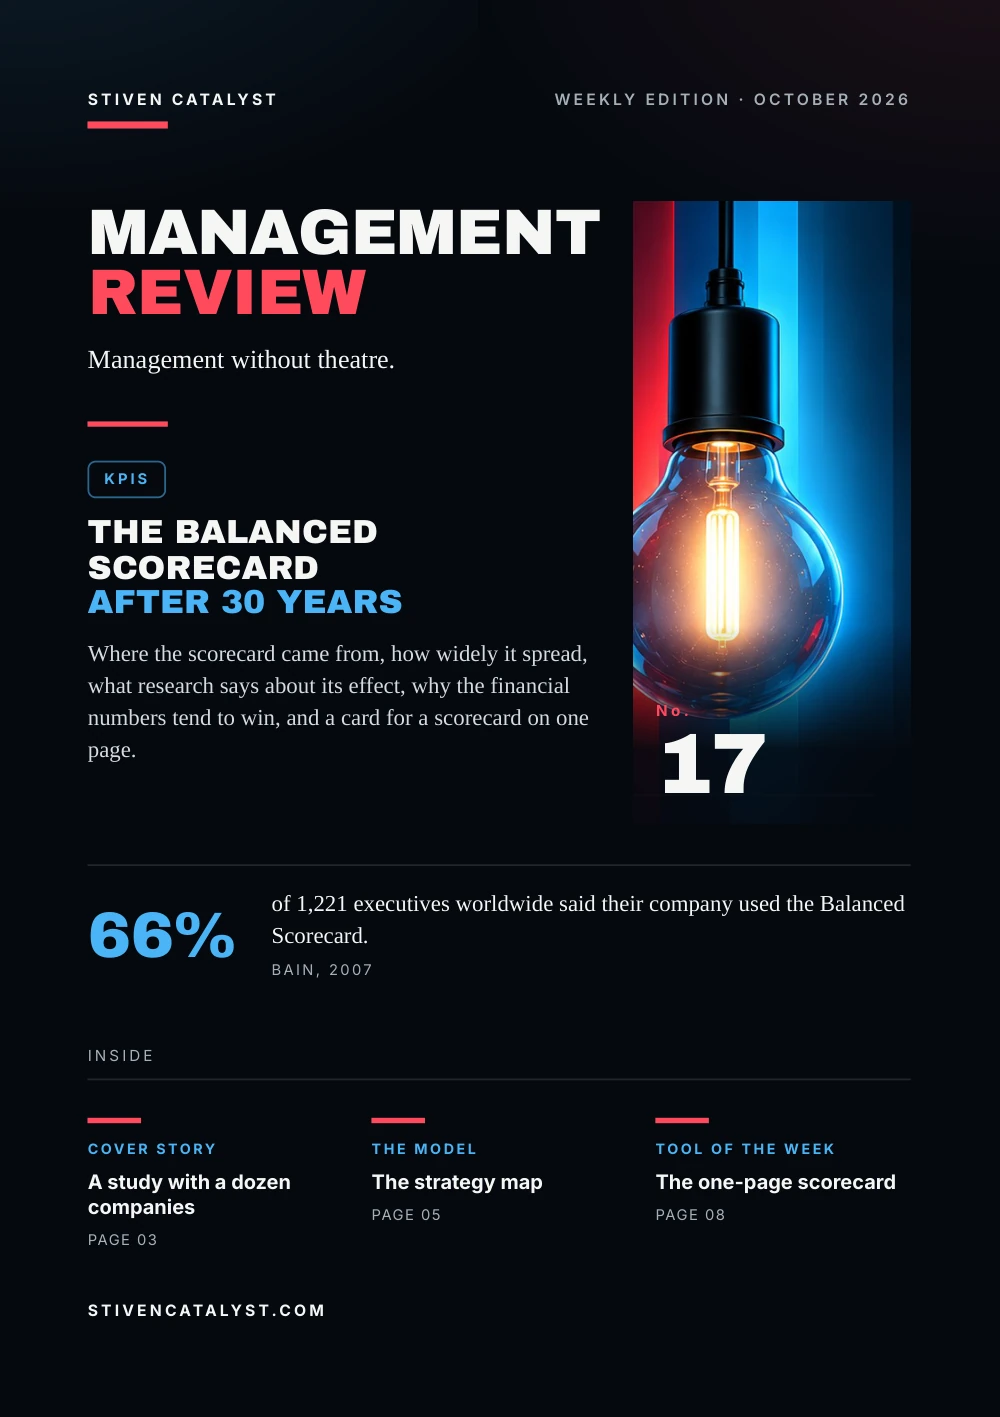
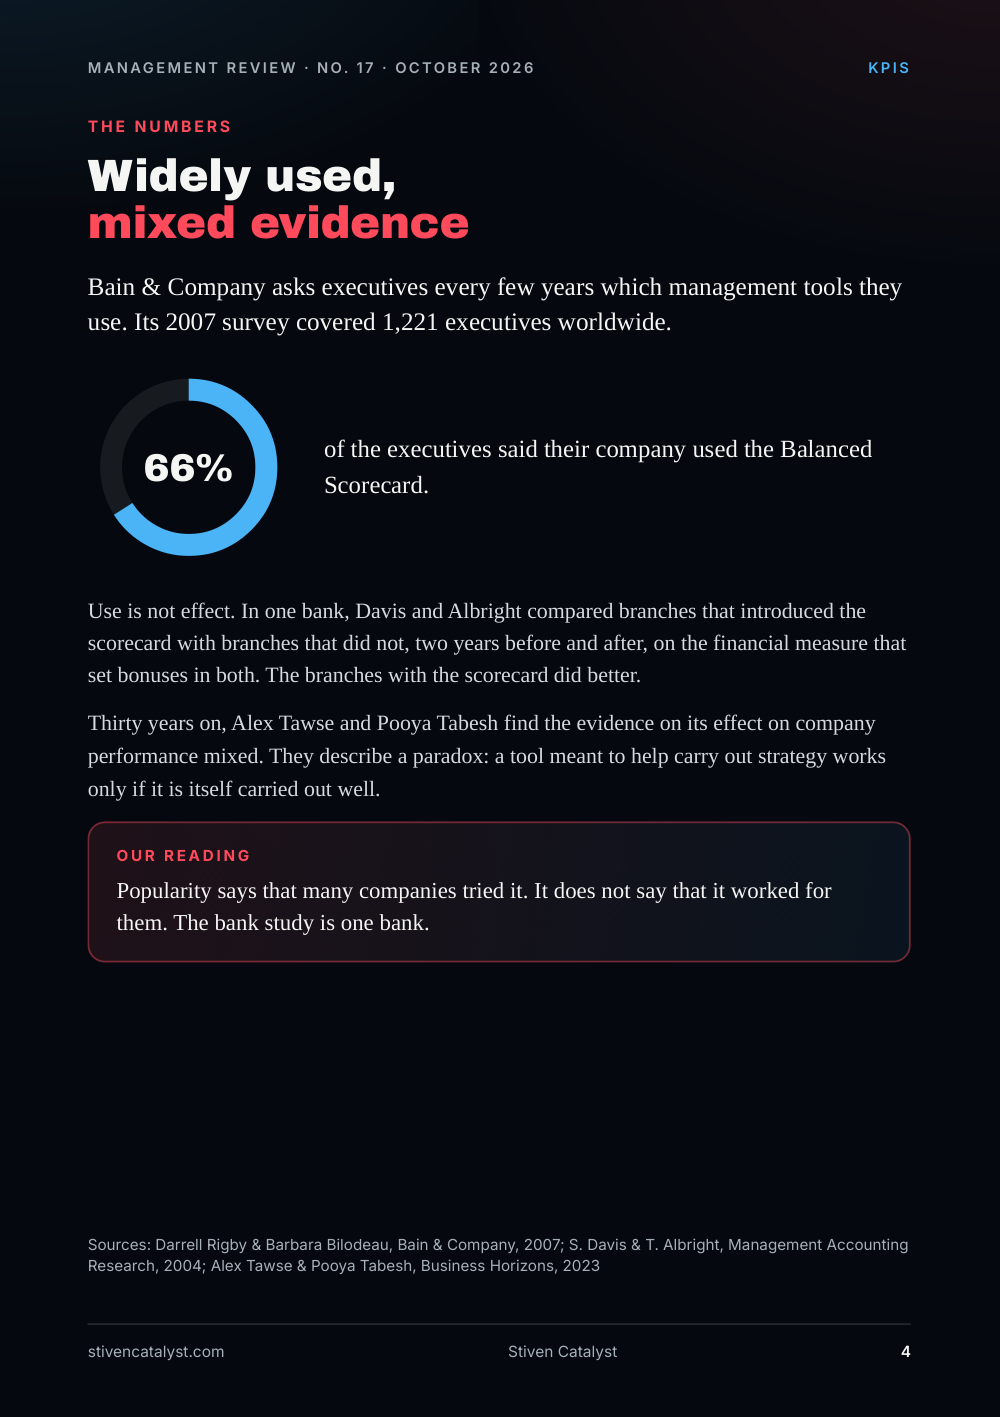
Bain & Company asks executives every few years which management tools they use. Its 2007 survey covered 1,221 executives worldwide.
66% of the executives said their company used the Balanced Scorecard.
Use is not effect. In one bank, Davis and Albright compared branches that introduced the scorecard with branches that did not, two years before and after, on the financial measure that set bonuses in both. The branches with the scorecard did better.
Thirty years on, Alex Tawse and Pooya Tabesh find the evidence on its effect on company performance mixed. They describe a paradox: a tool meant to help carry out strategy works only if it is itself carried out well.
Our reading
Popularity says that many companies tried it. It does not say that it worked for them. The bank study is one bank.
Sources: Darrell Rigby & Barbara Bilodeau, Bain & Company, 2007; S. Davis & T. Albright, Management Accounting Research, 2004; Alex Tawse & Pooya Tabesh, Business Horizons, 2023
The model
The strategy map
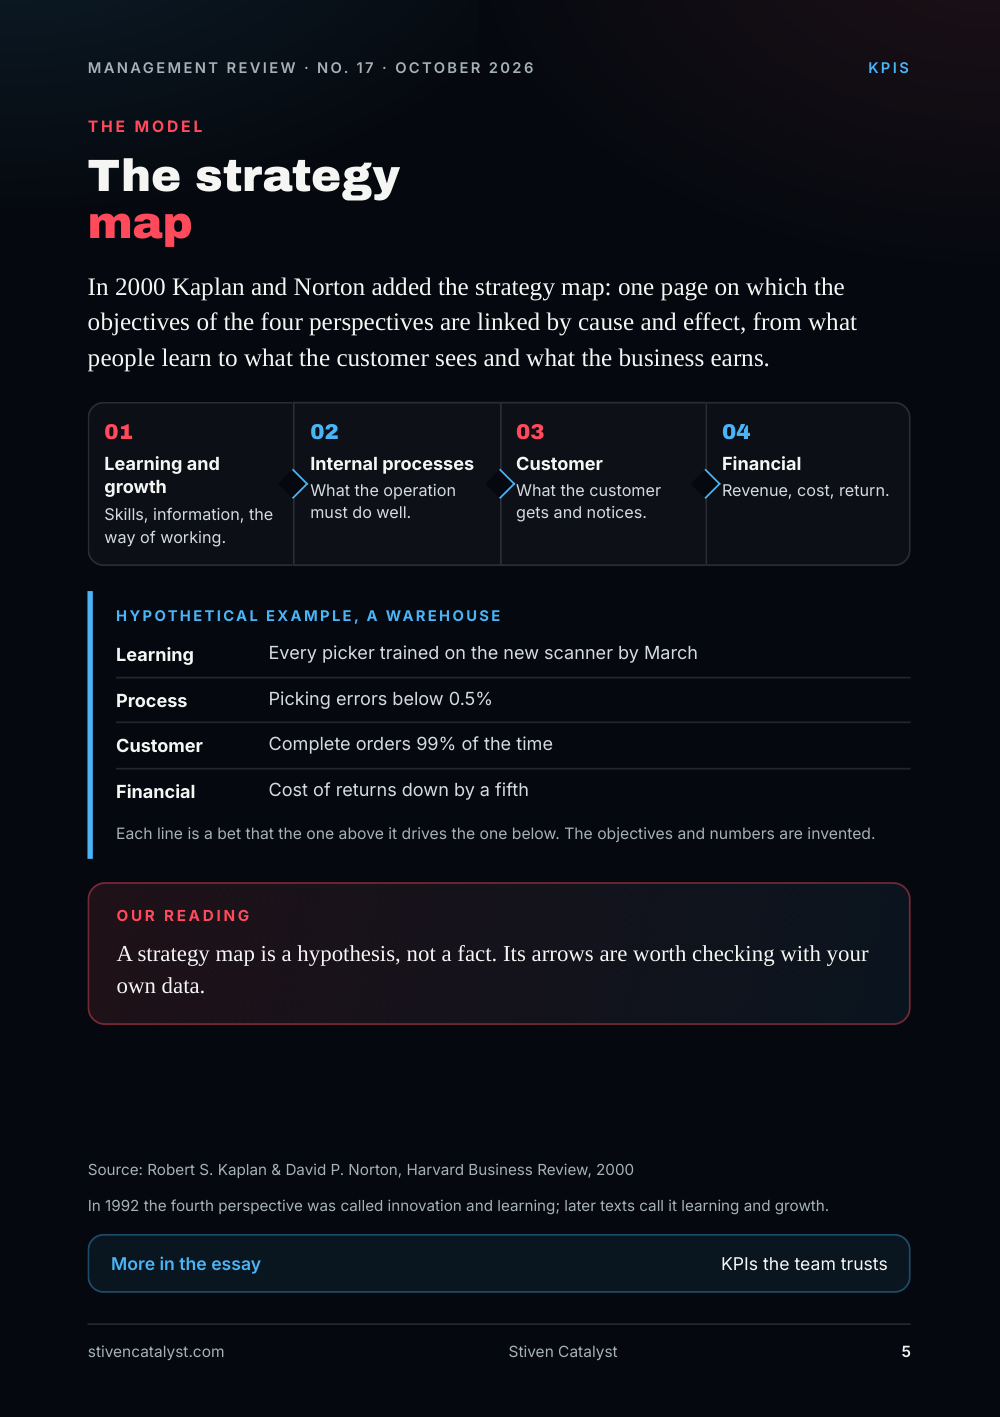
In 2000 Kaplan and Norton added the strategy map: one page on which the objectives of the four perspectives are linked by cause and effect, from what people learn to what the customer sees and what the business earns.
- Learning and growth. Skills, information, the way of working.
- Internal processes. What the operation must do well.
- Cus
t omer. What the customer gets and notices. - Financial. Revenue, cost, return.
Hypothe tical example, a warehouse
- Learning: Every picker trained on the new scanner by March
- Process: Picking errors below 0.5%
- Cus
t omer: Complete orders 99% of the time - Financial: Cost of returns down by a fifth
Each line is a bet that the one above it drives the one below. The objectives and numbers are invented.
Our reading
A strategy map is a hypothesis, not a fact. Its arrows are worth checking with your own data.
In 1992 the fourth perspective was called innovation and learning; later texts call it learning and growth.
Source: Robert S. Kaplan & David P. Norton, Harvard Business Review, 2000
More in the essay: KPIs the team trusts
What goes wrong
Why the financial numbers win
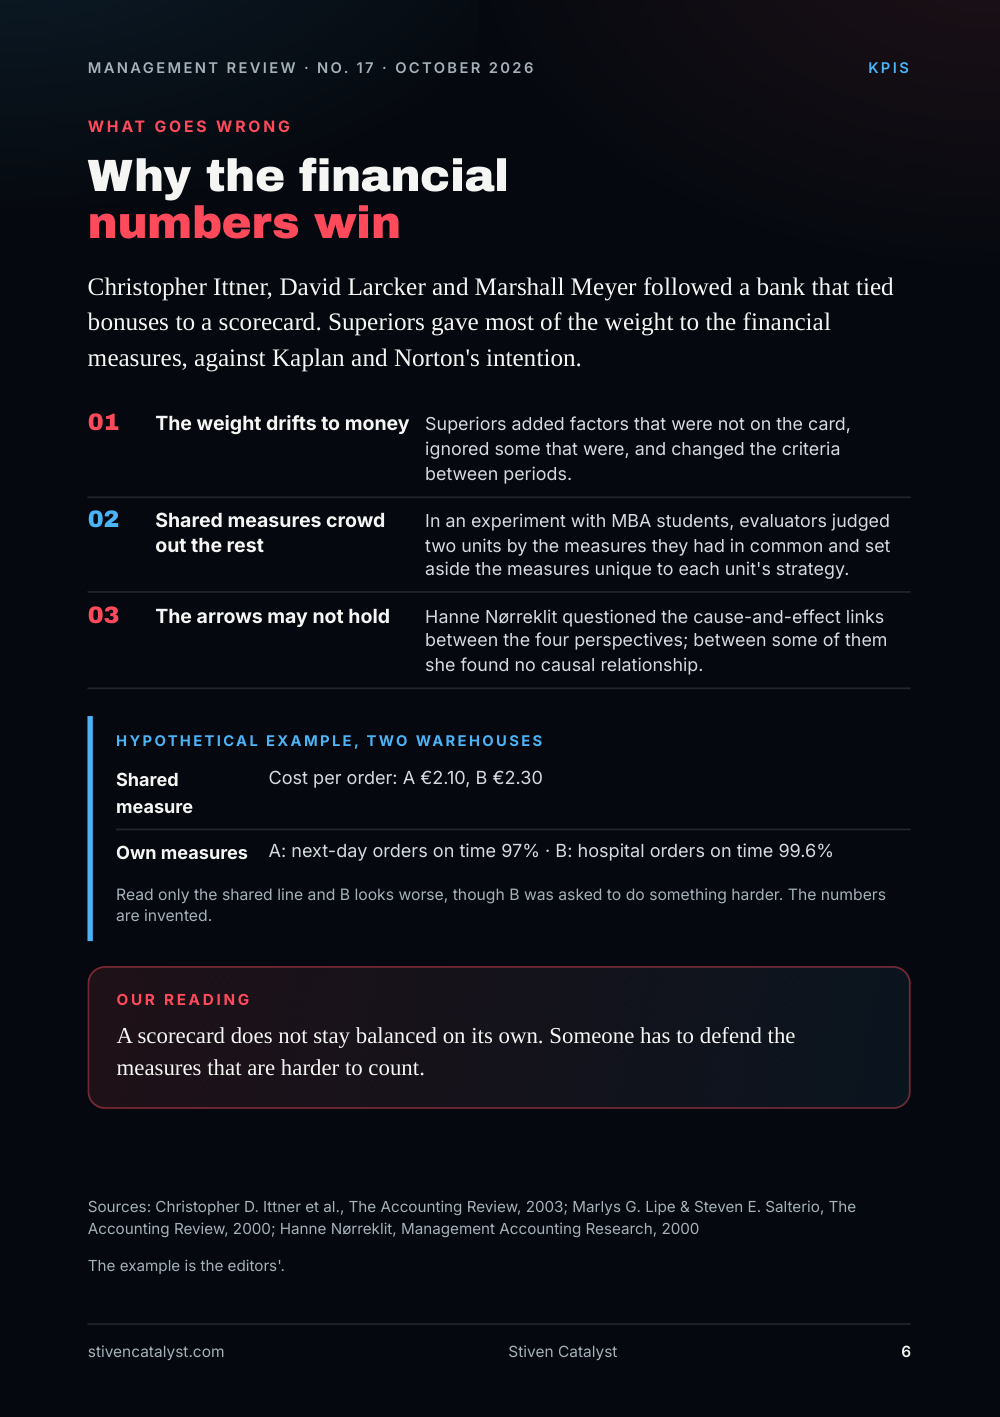
Christopher Ittner, David Larcker and Marshall Meyer followed a bank that tied bonuses to a scorecard. Superiors gave most of the weight to the financial measures, against Kaplan and Norton's intention.
- The weight dri
f tst o mone y. Superiors added factors that were not on the card, ignored some that were, and changed the criteria between periods. - Shared measures crowd out the rest. In an experiment with MBA students, evaluators judged two units by the measures they had in common and set aside the measures unique to each unit's strategy.
- The arrows may not hold. Hanne Nørreklit questioned the cause-and-effect links between the four perspectives; between some of them she found no causal relationship.
Hypothe tical example, two warehouses
- Shared measure: Cost per order: A €2.10, B €2.30
- Own measures: A: next-day orders on time 97% · B: hospital orders on time 99.6%
Read only the shared line and B looks worse, though B was asked to do something harder. The numbers are invented.
Our reading
A scorecard does not stay balanced on its own. Someone has to defend the measures that are harder to count.
The example is the editors'.
Sources: Christopher D. Ittner et al., The Accounting Review, 2003; Marlys G. Lipe & Steven E. Salterio, The Accounting Review, 2000; Hanne Nørreklit, Management Accounting Research, 2000
How it is measured
Five questions for a scorecard
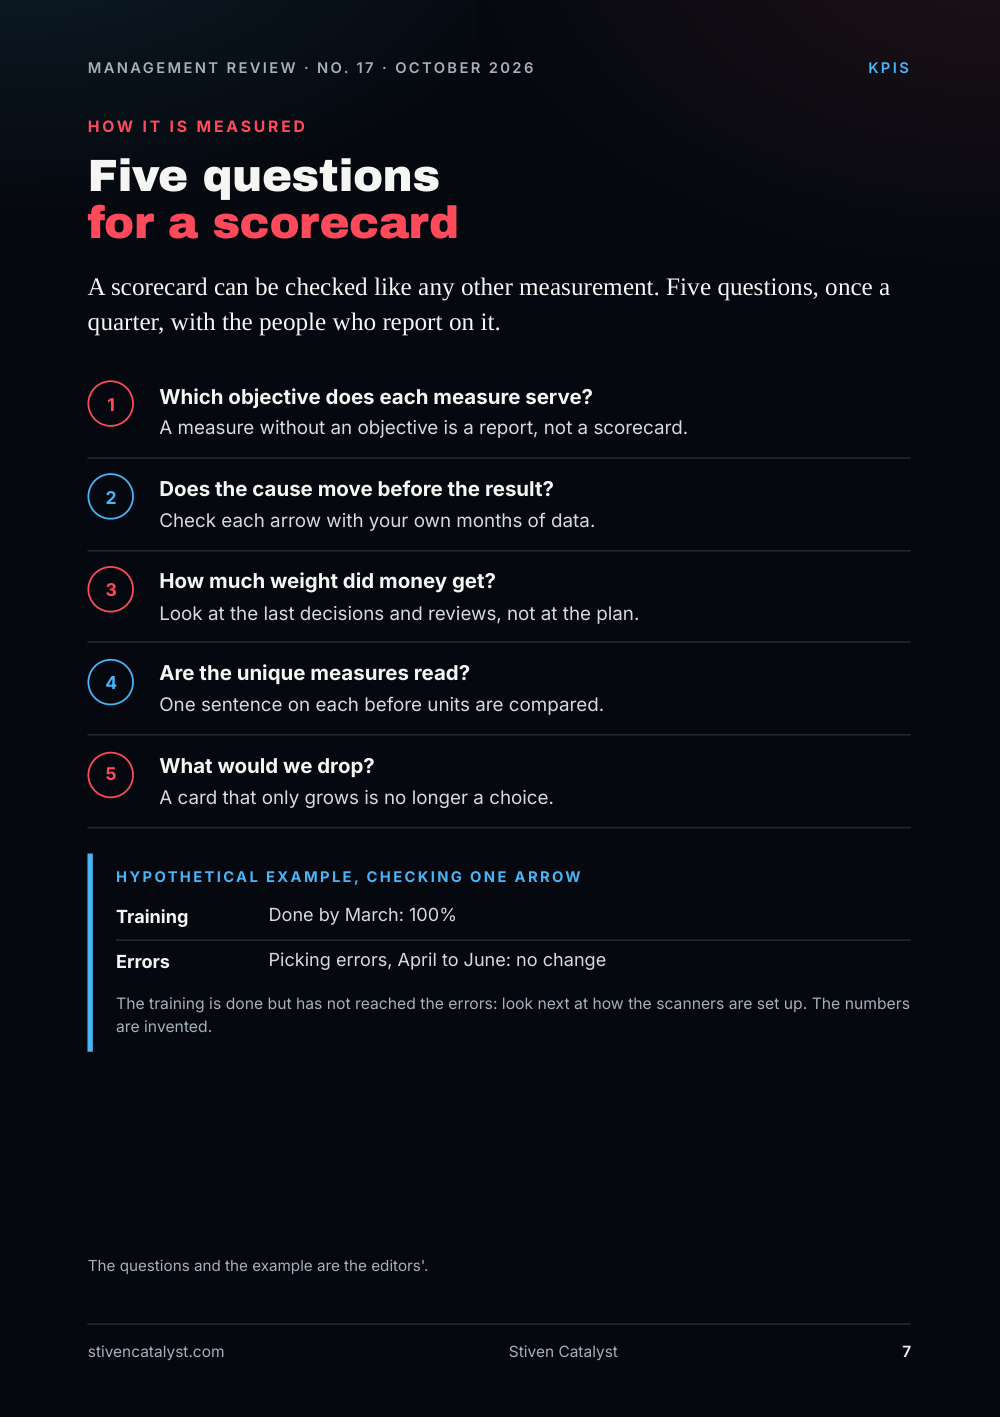
A scorecard can be checked like any other measurement. Five questions, once a quarter, with the people who report on it.
- Which objective does each measure serve?. A measure without an objective is a report, not a scorecard.
- Does the cause move before the result?. Check each arrow with your own months of data.
- How much weight did mon
e y ge t?. Look at the last decisions and reviews, not at the plan. - Are the unique measures read?. One sentence on each before units are compared.
- What would we drop?. A card that only grows is no longer a choice.
Hypothe tical example, checking one arrow
- Training: Done by March: 100%
- Errors: Picking errors, April to June: no change
The training is done but has not reached the errors: look next at how the scanners are set up. The numbers are invented.
The questions and the example are the editors'.
Tool of the week
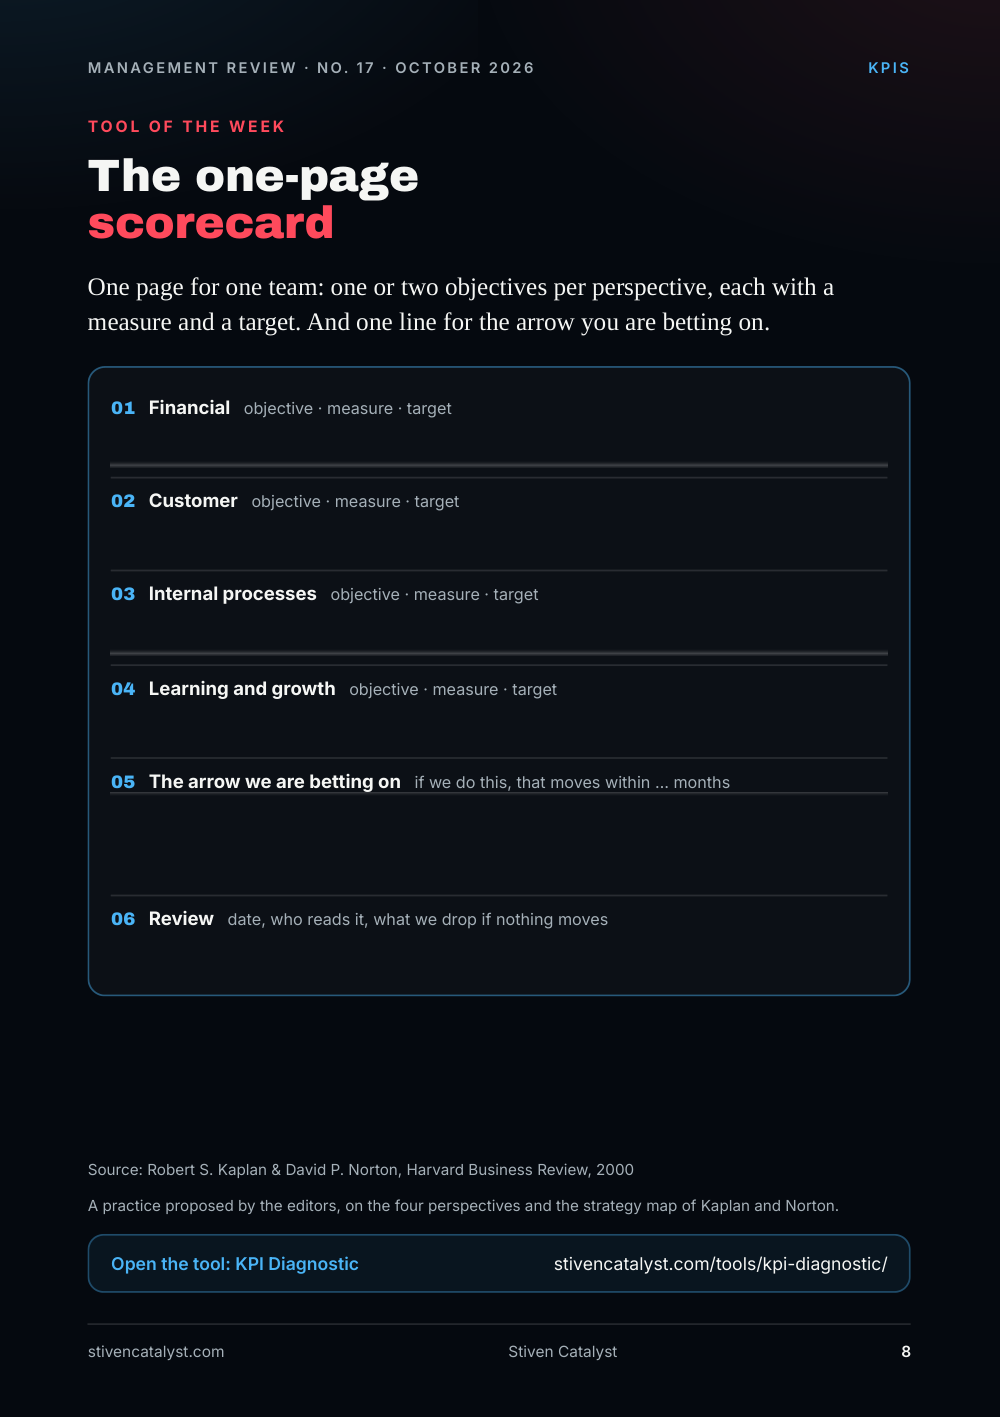
The one-page scorecard
One page for one team: one or two objectives per perspective, each with a measure and a target. And one line for the arrow you are betting on.
- Financial objective · measure · target
- Cus
t omer objective · measure · target - Internal processes objective · measure · target
- Learning and growth objective · measure · target
- The arrow we are b
e t ting on if we do this, that moves within … months - Review date, who reads it, what we drop if nothing moves
A practice proposed by the editors, on the four perspectives and the strategy map of Kaplan and Norton.
Source: Robert S. Kaplan & David P. Norton, Harvard Business Review, 2000
Open the tool: KPI Diagnostic
Sources and method
Every figure has a source.
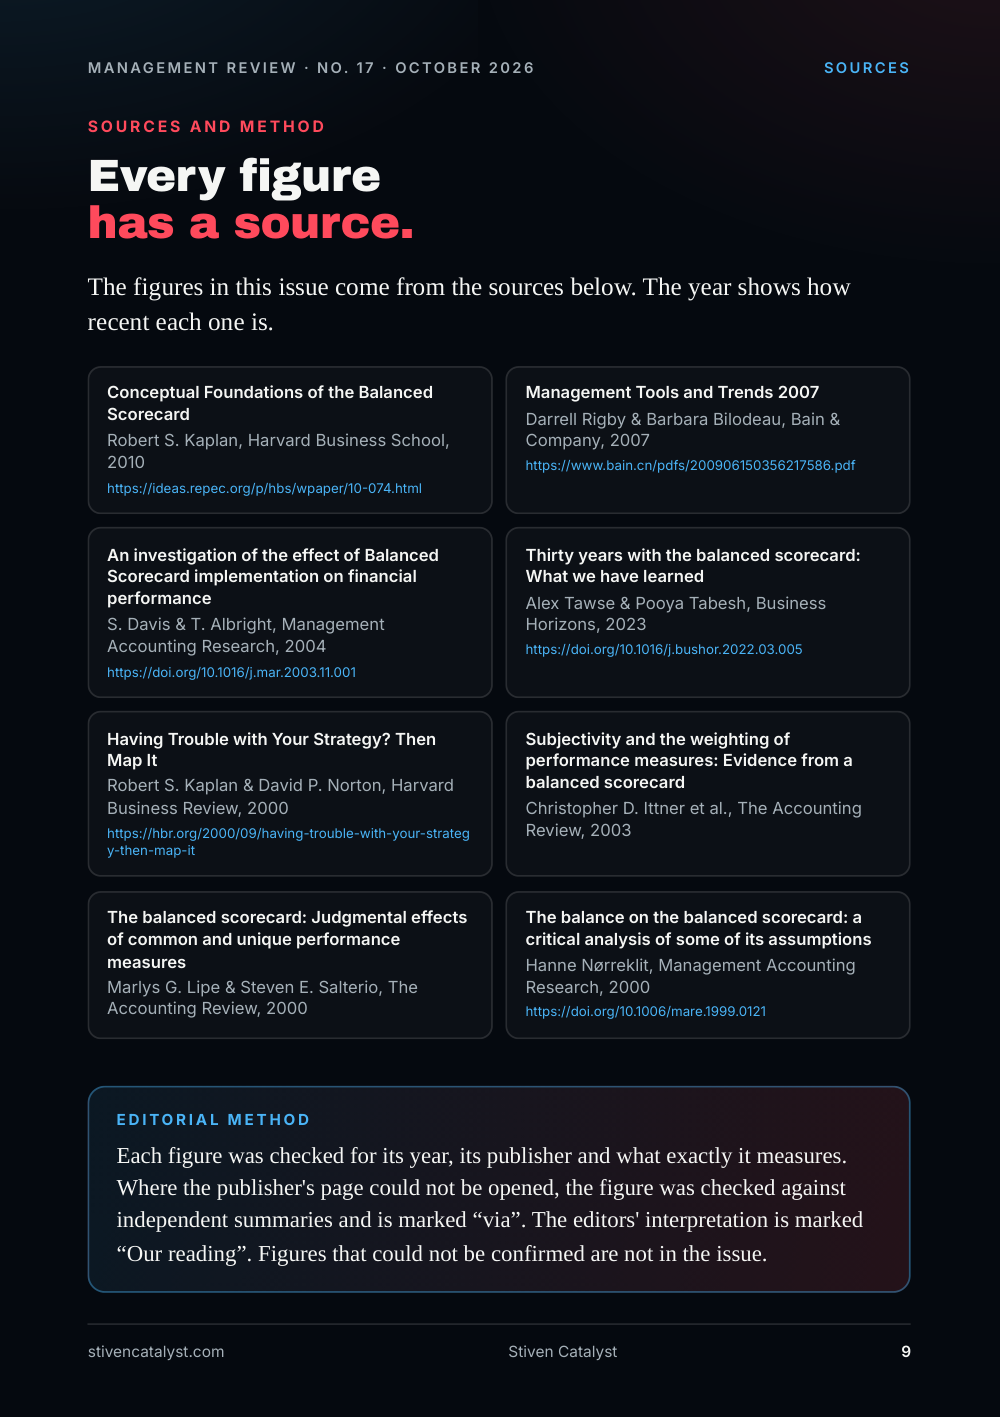
The figures in this issue come from the sources below. The year shows how recent each one is.
- Robert S. Kaplan, Harvard Business School, “Conceptual Foundations of the Balanced Scorecard”, 2010. https://ideas.repec.org/p/hbs/wpaper/10-074.html
- Darrell Rigby & Barbara Bilodeau, Bain & Company, “Management Tools and Trends 2007”, 2007. https://www.bain.cn/pdfs/200906150356217586.pdf
- S. Davis & T. Albright, Management Accounting Research, “An investigation of the effect of Balanced Scorecard implementation on financial performance”, 2004. https://doi.org/10.1016/j.mar.2003.11.001
- Alex Tawse & Pooya Tabesh, Business Horizons, “Thirty years with the balanced scorecard: What we have learned”, 2023. https://doi.org/10.1016/j.bushor.2022.03.005
- Robert S. Kaplan & David P. Norton, Harvard Business Review, “Having Trouble with Your Strategy? Then Map It”, 2000. https://hbr.org/2000/09/having-trouble-with-your-strategy-then-map-it
- Christopher D. Ittner et al., The Accounting Review, “Subjectivity and the weighting of performance measures: Evidence from a balanced scorecard”, 2003.
- Marlys G. Lipe & Steven E. Salterio, The Accounting Review, “The balanced scorecard: Judgmental effects of common and unique performance measures”, 2000.
- Hanne Nørreklit, Management Accounting Research, “The balance on the balanced scorecard: a critical analysis of some of its assumptions”, 2000. https://doi.org/10.1006/mare.1999.0121
Edit orial me thod
Each figure was checked for its year, its publisher and what exactly it measures. Where the publisher's page could not be opened, the figure was checked against independent summaries and is marked “via”. The editors' interpretation is marked “Our reading”. Figures that could not be confirmed are not in the issue.