In Seiichi Nakajima's total productive maintenance, OEE multiplies three rates: availability, performance and quality. His ideal conditions give 85%, the figure later called world class. Studies of real machines found about 55%, 60% and 65%. A study of road freight measured 54% for vehicles. And the data can mislead: in 884 Swedish machines, most performance and quality rates sat at the system's default of 100%.
Management Review · Second series · November 2026 · No. 48
OEE: how much of the capacit y is really used
Nakajima's six big losses, where the world-class 85% comes from, what measured plants reach, three rates in one shift, OEE on a loading dock, what the logs hide, and a card for one asset.
- No.
- 48
- Pages
- 10
- Sources
- 8
- Topics
- KPIs
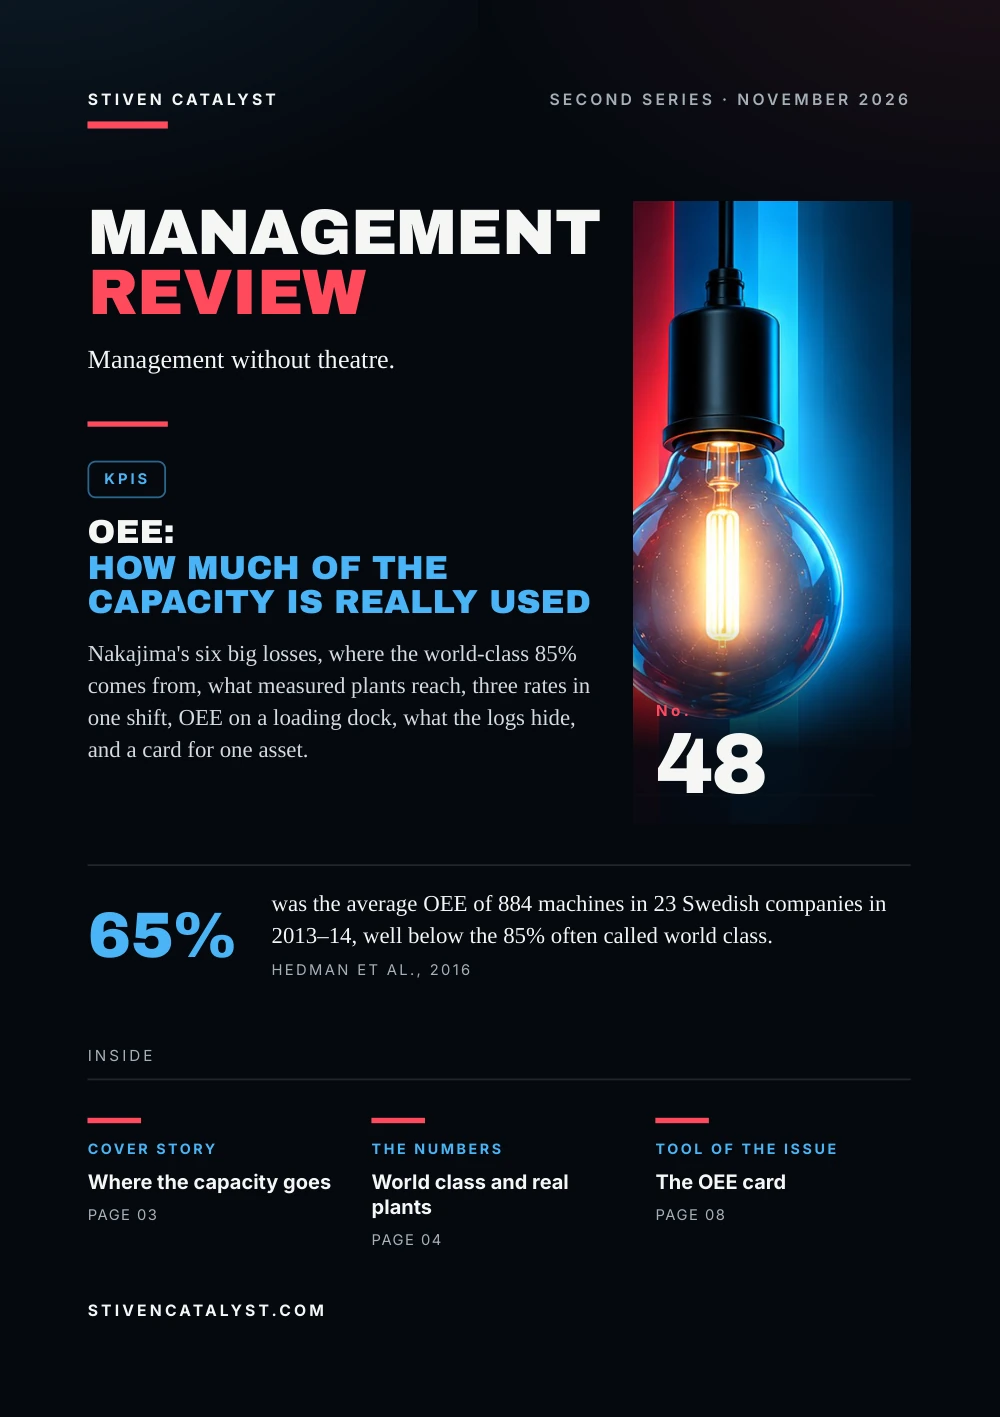
Stiven CatalystSecond series · November 2026
ManagementReview
Management without theatre.
KPIs
OEE:how much of the capacity is really used
Nakajima's six big losses, where the world-class 85% comes from, what measured plants reach, three rates in one shift, OEE on a loading dock, what the logs hide, and a card for one asset.

No.48
65%
was the average OEE of 884 machines in 23 Swedish companies in 2013–14, well below the 85% often called world class.Hedman et al., 2016
stivencatalyst.com
No. 48 · KPIs
In this issue
A plant, a dock or a fleet can be busy all day and still deliver only part of what it could. This issue looks at the measure built to show how much: overall equipment effectiveness, where its famous target comes from, and how far it carries outside the factory.
- 03Cover storyWhere the capacity goes
- 04The numbersWorld class and real plants
- 05The modelThree rates, six losses
- 06How it transfersFrom the machine to the dock
- 07How it is measuredCount before you compare
- 08Tool of the issueThe OEE card for one asset
- 09SourcesSources and method
How to read this issue
Figure
Every figure has its source and year at the foot of its page.
Our reading
Where the editors interpret rather than the research, it says so.
Practice
The steps and the card are proposals to try, not research results.
Cover story
Where thecapacit y goes
OEE grew out of total productive maintenance (TPM), which the Japan Institute of Plant Maintenance proposed in 1971. Its aim is zero losses; OEE shows how many remain.
- 1964A maintenance group in Japan creates the PM Prize for plant maintenance.
- 1971The body that became JIPM proposes TPM.
- 1988Nakajima's Introduction to TPM appears in English.
- 1994The prize becomes the TPM Award; by JIPM's count, over 3,500 sites have won it.
In about 20 cases, Örjan Ljungberg found that performance losses dominated, while many companies watched the big breakdowns rather than small losses of speed and time. In data from 98 Swedish companies (2006–2012), Ylipää and colleagues found the same order: operational efficiency first, then availability.
Our reading
A breakdown is loud and gets a meeting. A line running a little slow all week is silent, and costs more.
Sources: Japan Institute of Plant Maintenance (JIPM), 2021; Seiichi Nakajima, Productivity Press, 1988 (via Muchiri & Pintelon (2008); Bengtsson, Andersson & Ekström (2022)); Õrjan Ljungberg, International Journal of Operations & Production Management 18(5), 1998; Torbjörn Ylipää, Anders Skoogh, Jon Bokrantz & Maheshwaran Gopalakrishnan, International Journal of Productivity and Performance Management 66(1), 2017 (via Abstract at Chalmers Research and IDEAS/RePEc)
TPM and prize facts follow JIPM's own pages, in Japanese. Nakajima's book was not seen; its content is confirmed through journal articles that cite it.
The numbers
World classand real plants
Nakajima set out ideal conditions: availability above 90%, performance above 95%, quality above 99%. Multiplied, they give 85%, the level later authors call world class. Studies that measured real machines found less.
OEE: the ideal against measured averages
The 85% is a set of ideal conditions multiplied, not the average of a sample; we could not find who first called it world class. In the Swedish data the median was 70%: food and beverage plants averaged 74%, other automated discrete production 59%.
Our reading
Against 85%, almost everyone looks bad and the number stops helping. Against last month, it shows whether the losses are shrinking.
Sources: Seiichi Nakajima, Productivity Press, 1988 (via Muchiri & Pintelon (2008); Bengtsson, Andersson & Ekström (2022)); Richard Hedman, Mukund Subramaniyan & Peter Almström, Procedia CIRP 57, 2016; Marcus Bengtsson, Lars-Gunnar Andersson & Pontus Ekström, Journal of Quality in Maintenance Engineering 28(2), 2022; Õrjan Ljungberg, International Journal of Operations & Production Management 18(5), 1998
Different samples, years and definitions: the bars show orders of magnitude, not a ranking. Nakajima's ideal as cited by Bengtsson et al. (2022).
The model
Three rates,six losses
OEE multiplies three rates; together they set good output against the planned time. Each rate collects two of Nakajima's six big losses.
01
Availability
running time against planned time; losses: breakdowns, setup and adjustment
02
Performance
output at ideal speed against running time; losses: idling and minor stops, reduced speed
03
Quality
good units against all units; losses: defects and rework, lower yield at start-up
Invented example, one shift on a packing line
- Availability
- 480 planned minutes, 48 lost to stops: 90%
- Performance
- 380 units at an ideal 1 minute each, in 432 minutes: 88%
- Quality
- 370 of 380 good the first time: 97.4%
- OEE
- 0.90 × 0.88 × 0.974 = 77.1%, or 370 good minutes of 480
No rate looks bad, yet almost a quarter of the shift is lost. The numbers are invented.
A related measure, TEEP, divides by all calendar time instead of the planned time. A line that stands still every weekend can have a high OEE and a low TEEP.
Sources: Seiichi Nakajima, Productivity Press, 1988 (via Muchiri & Pintelon (2008); Bengtsson, Andersson & Ekström (2022)); Peter Muchiri & Liliane Pintelon, International Journal of Production Research 46(13), 2008 (via Submitted version on HAL)
Rates and losses follow Nakajima as Muchiri and Pintelon (2008) give them; the example is the editors'.
How it transfers
From the machinet o the dock
In 2004 David Simons, Robert Mason and Bernard Gardner carried OEE over to road freight as overall vehicle effectiveness (OVE), with five losses of its own. Their case study measured 54%; they put a target for the company at 70%.
01
Availability
the hours a dock door and its crew are ready, against the planned hours
02
Performance
pallets per hour against an agreed standard, not against the best day
03
Quality
loads right the first time: nothing reloaded, damaged or missing
In the Swedish plant data, about 90% of the stop time with a known cause was tied to support work done by operators, such as changeovers, adjustments and repairs, not to the automatic process itself.
Our reading
A dock is more people, trucks and material than machine. A door waiting for a late truck is not broken: log arrival losses on their own line, or the dock takes the blame for the yard.
Sources: David Simons, Robert Mason & Bernard Gardner, International Journal of Logistics: Research and Applications 7(2), 2004 (via Abstract at IAOR); Richard Hedman, Mukund Subramaniyan & Peter Almström, Procedia CIRP 57, 2016
Only the abstract of Simons et al. was seen, so we do not list their five losses. The dock version of the three rates is the editors' and has no published benchmark.
More in the essayHigh-volume days: the standard under pressure
How it is measured
Count beforeyou compare
An OEE is only as good as what is logged. Richard Hedman and colleagues examined the raw data behind automatic OEE measurement: 884 machines in 23 Swedish companies, over six months from October 2013.
Machines whose logged rate was exactly 100%, 2013–14
100% was the system's default. About half of the loss time had no usable cause: “unclassified” took 19% of the scheduled time. The authors ask whether such firms measure OEE or only availability.
In one automotive plant, 25 managers estimated the average OEE of early 2018: 55% on average, from 40% to 66%. The logs said 60%. Four in five thought lack of material was logged more often than tool changes and quality checks; it was not.
Sources: Richard Hedman, Mukund Subramaniyan & Peter Almström, Procedia CIRP 57, 2016; Marcus Bengtsson, Lars-Gunnar Andersson & Pontus Ekström, Journal of Quality in Maintenance Engineering 28(2), 2022
Hedman et al. write “almost half” in the abstract and “more than half” in the results for the unclassified loss time; we write “about half”. The managers' survey covers a single plant.
Tool of the issue
The OEE cardfor one asse t
One machine, door or vehicle, one week. Count against the planned time, give every stop a cause, and compare the result with last week, not with 85%.
01Asset and planned timewhich one; planned minutes, not calendar minutes
02Availabilityrunning minutes ÷ planned minutes; each stop with its cause
03Performanceunits × ideal time per unit ÷ running minutes
04Qualitygood the first time ÷ all units
05OEE and the largest lossthe three rates multiplied; which of the six losses took most
06Unclassified and one changeminutes without a cause; what we change, when we count again
Sources: Peter Muchiri & Liliane Pintelon, International Journal of Production Research 46(13), 2008 (via Submitted version on HAL); Richard Hedman, Mukund Subramaniyan & Peter Almström, Procedia CIRP 57, 2016
A practice proposed by the editors, on Nakajima's rates and losses and the pitfalls found by Hedman et al.
Open the tool: Sigma & Control Chartstivencatalyst.com/tools/sigma-control-chart/
Sources and method
Every figurehas a source.
The figures in this issue come from the sources below. The year shows how recent each one is.
- TPM to wa (What is TPM?) and Soshikizu/Enkaku (organisation and history), in JapaneseJapan Institute of Plant Maintenance (JIPM), 2021https://www.jipm.or.jp/business/tpm/
- Introduction to TPM: Total Productive MaintenanceSeiichi Nakajima, Productivity Press, 1988 · via Muchiri & Pintelon (2008); Bengtsson, Andersson & Ekström (2022)
- Measurement of overall equipment effectiveness as a basis for TPM activitiesÕrjan Ljungberg, International Journal of Operations & Production Management 18(5), 1998https://doi.org/10.1108/01443579810206334
- Identification of maintenance improvement potential using OEE assessmentTorbjörn Ylipää, Anders Skoogh, Jon Bokrantz & Maheshwaran Gopalakrishnan, International Journal of Productivity and Performance Management 66(1), 2017 · via Abstract at Chalmers Research and IDEAS/RePEchttps://doi.org/10.1108/IJPPM-01-2016-0028
- Analysis of critical factors for automatic measurement of OEERichard Hedman, Mukund Subramaniyan & Peter Almström, Procedia CIRP 57, 2016https://doi.org/10.1016/j.procir.2016.11.023
- Measuring preconceived beliefs on the results of overall equipment effectiveness – A case study in the automotive manufacturing industryMarcus Bengtsson, Lars-Gunnar Andersson & Pontus Ekström, Journal of Quality in Maintenance Engineering 28(2), 2022https://doi.org/10.1108/JQME-03-2020-0016
- Performance measurement using overall equipment effectiveness (OEE): literature review and practical application discussionPeter Muchiri & Liliane Pintelon, International Journal of Production Research 46(13), 2008 · via Submitted version on HALhttps://hal.science/hal-00512968
- Overall vehicle effectivenessDavid Simons, Robert Mason & Bernard Gardner, International Journal of Logistics: Research and Applications 7(2), 2004 · via Abstract at IAORhttps://doi.org/10.1080/13675560410001670233
Editorial method
Each figure was checked for its year, its publisher and what exactly it measures. Where the publisher's page could not be opened, the figure was checked against independent summaries and is marked “via”. The editors' interpretation is marked “Our reading”. Figures that could not be confirmed are not in the issue.
ManagementReview
Management without theatre.
Every issue, one management question, checked against the best research.
All issues
stivencatalyst.com/magazine/management-review.html
Management Review · No. 48 · November 2026 · Stiven Catalyst
Click or swipe a page to turn it. The arrow keys work too.
Management Review · No. 48
The figures of the issue
The charts of the printed pages, with their sources.
Sources: Seiichi Nakajima, Productivity Press, 1988 (via Muchiri & Pintelon (2008); Bengtsson, Andersson & Ekström (2022)); Richard Hedman, Mukund Subramaniyan & Peter Almström, Procedia CIRP 57, 2016; Marcus Bengtsson, Lars-Gunnar Andersson & Pontus Ekström, Journal of Quality in Maintenance Engineering 28(2), 2022; Õrjan Ljungberg, International Journal of Operations & Production Management 18(5), 1998
Source: Richard Hedman, Mukund Subramaniyan & Peter Almström, Procedia CIRP 57, 2016
The whole text Read the issue as text For reading on a small screen, searching or a screen reader. The same words, without the page design.
In this issue
A plant, a dock or a fleet can be busy all day and still deliver only part of what it could. This issue looks at the measure built to show how much: overall equipment effectiveness, where its famous target comes from, and how far it carries outside the factory.
In Seiichi Nakajima's total productive maintenance, OEE multiplies three rates: availability, performance and quality. His ideal conditions give 85%, the figure later called world class. Studies of real machines found about 55%, 60% and 65%. A study of road freight measured 54% for vehicles. And the data can mislead: in 884 Swedish machines, most performance and quality rates sat at the system's default of 100%.
Stiven Janaqi, Editor
Cover story
Where the capacit y goes
OEE grew out of total productive maintenance (TPM), which the Japan Institute of Plant Maintenance proposed in 1971. Its aim is zero losses; OEE shows how many remain.
- 1964 A maintenance group in Japan creates the PM Prize for plant maintenance.
- 1971 The body that became JIPM proposes TPM.
- 1988 Nakajima's Introduction to TPM appears in English.
- 1994 The prize becomes the TPM Award; by JIPM's count, over 3,500 sites have won it.
In about 20 cases, Örjan Ljungberg found that performance losses dominated, while many companies watched the big breakdowns rather than small losses of speed and time. In data from 98 Swedish companies (2006–2012), Ylipää and colleagues found the same order: operational efficiency first, then availability.
Our reading
A breakdown is loud and gets a meeting. A line running a little slow all week is silent, and costs more.
TPM and prize facts follow JIPM's own pages, in Japanese. Nakajima's book was not seen; its content is confirmed through journal articles that cite it.
Sources: Japan Institute of Plant Maintenance (JIPM), 2021; Seiichi Nakajima, Productivity Press, 1988 (via Muchiri & Pintelon (2008); Bengtsson, Andersson & Ekström (2022)); Õrjan Ljungberg, International Journal of Operations & Production Management 18(5), 1998; Torbjörn Ylipää, Anders Skoogh, Jon Bokrantz & Maheshwaran Gopalakrishnan, International Journal of Productivity and Performance Management 66(1), 2017 (via Abstract at Chalmers Research and IDEAS/RePEc)
The numbers
World class and real plants
Nakajima set out ideal conditions: availability above 90%, performance above 95%, quality above 99%. Multiplied, they give 85%, the level later authors call world class. Studies that measured real machines found less.
OEE: the ideal against measured averages: Ideal conditions, Nakajima (1988) 85%, 884 machines, Sweden, 2013–14 65%, 50 machines, an automotive plant, 2018 60%, About 20 cases, Ljungberg (1998) ~55%.
The 85% is a set of ideal conditions multiplied, not the average of a sample; we could not find who first called it world class. In the Swedish data the median was 70%: food and beverage plants averaged 74%, other automated discrete production 59%.
Our reading
Against 85%, almost everyone looks bad and the number stops helping. Against last month, it shows whether the losses are shrinking.
Different samples, years and definitions: the bars show orders of magnitude, not a ranking. Nakajima's ideal as cited by Bengtsson et al. (2022).
Sources: Seiichi Nakajima, Productivity Press, 1988 (via Muchiri & Pintelon (2008); Bengtsson, Andersson & Ekström (2022)); Richard Hedman, Mukund Subramaniyan & Peter Almström, Procedia CIRP 57, 2016; Marcus Bengtsson, Lars-Gunnar Andersson & Pontus Ekström, Journal of Quality in Maintenance Engineering 28(2), 2022; Õrjan Ljungberg, International Journal of Operations & Production Management 18(5), 1998
The model
Three rates, six losses
OEE multiplies three rates; together they set good output against the planned time. Each rate collects two of Nakajima's six big losses.
- Availabili
t y. running time against planned time; losses: breakdowns, setup and adjustment - Performance. output at ideal speed against running time; losses: idling and minor stops, reduced speed
- Quali
t y. good units against all units; losses: defects and rework, lower yield at start-up
Invented example, one shif t on a packing line
- Availabili
t y: 480 planned minutes, 48 lost to stops: 90% - Performance: 380 units at an ideal 1 minute each, in 432 minutes: 88%
- Quali
t y: 370 of 380 good the first time: 97.4% - OEE: 0.90 × 0.88 × 0.974 = 77.1%, or 370 good minutes of 480
No rate looks bad, yet almost a quarter of the shift is lost. The numbers are invented.
A related measure, TEEP, divides by all calendar time instead of the planned time. A line that stands still every weekend can have a high OEE and a low TEEP.
Rates and losses follow Nakajima as Muchiri and Pintelon (2008) give them; the example is the editors'.
Sources: Seiichi Nakajima, Productivity Press, 1988 (via Muchiri & Pintelon (2008); Bengtsson, Andersson & Ekström (2022)); Peter Muchiri & Liliane Pintelon, International Journal of Production Research 46(13), 2008 (via Submitted version on HAL)
How it transfers
From the machine t o the dock
In 2004 David Simons, Robert Mason and Bernard Gardner carried OEE over to road freight as overall vehicle effectiveness (OVE), with five losses of its own. Their case study measured 54%; they put a target for the company at 70%.
- Availabili
t y. the hours a dock door and its crew are ready, against the planned hours - Performance. pallets per hour against an agreed standard, not against the best day
- Quali
t y. loads right the first time: nothing reloaded, damaged or missing
In the Swedish plant data, about 90% of the stop time with a known cause was tied to support work done by operators, such as changeovers, adjustments and repairs, not to the automatic process itself.
Our reading
A dock is more people, trucks and material than machine. A door waiting for a late truck is not broken: log arrival losses on their own line, or the dock takes the blame for the yard.
Only the abstract of Simons et al. was seen, so we do not list their five losses. The dock version of the three rates is the editors' and has no published benchmark.
Sources: David Simons, Robert Mason & Bernard Gardner, International Journal of Logistics: Research and Applications 7(2), 2004 (via Abstract at IAOR); Richard Hedman, Mukund Subramaniyan & Peter Almström, Procedia CIRP 57, 2016
More in the essay: High-volume days: the standard under pressure
How it is measured
Count before you compare
An OEE is only as good as what is logged. Richard Hedman and colleagues examined the raw data behind automatic OEE measurement: 884 machines in 23 Swedish companies, over six months from October 2013.
Machines whose logged rate was exactly 100%, 2013–14: Performance at 100% (702 of 884) 79%, Quality at 100% (796 of 884) 90%.
100% was the system's default. About half of the loss time had no usable cause: “unclassified” took 19% of the scheduled time. The authors ask whether such firms measure OEE or only availability.
In one automotive plant, 25 managers estimated the average OEE of early 2018: 55% on average, from 40% to 66%. The logs said 60%. Four in five thought lack of material was logged more often than tool changes and quality checks; it was not.
Hedman et al. write “almost half” in the abstract and “more than half” in the results for the unclassified loss time; we write “about half”. The managers' survey covers a single plant.
Sources: Richard Hedman, Mukund Subramaniyan & Peter Almström, Procedia CIRP 57, 2016; Marcus Bengtsson, Lars-Gunnar Andersson & Pontus Ekström, Journal of Quality in Maintenance Engineering 28(2), 2022
Tool of the issue
The OEE card for one asse t
One machine, door or vehicle, one week. Count against the planned time, give every stop a cause, and compare the result with last week, not with 85%.
- Ass
e t and planned time which one; planned minutes, not calendar minutes - Availabili
t y running minutes ÷ planned minutes; each stop with its cause - Performance units × ideal time per unit ÷ running minutes
- Quali
t y good the first time ÷ all units - OEE and the largest loss the three rates multiplied; which of the six losses took most
- Unclassified and one change minutes without a cause; what we change, when we count again
A practice proposed by the editors, on Nakajima's rates and losses and the pitfalls found by Hedman et al.
Sources: Peter Muchiri & Liliane Pintelon, International Journal of Production Research 46(13), 2008 (via Submitted version on HAL); Richard Hedman, Mukund Subramaniyan & Peter Almström, Procedia CIRP 57, 2016
Open the tool: Sigma & Control Chart
Sources and method
Every figure has a source.
The figures in this issue come from the sources below. The year shows how recent each one is.
- Japan Institute of Plant Maintenance (JIPM), “TPM to wa (What is TPM?) and Soshikizu/Enkaku (organisation and history), in Japanese”, 2021. https://www.jipm.or.jp/business/tpm/
- Seiichi Nakajima, Productivity Press, “Introduction to TPM: Total Productive Maintenance”, 1988 (via Muchiri & Pintelon (2008); Bengtsson, Andersson & Ekström (2022)).
- Õrjan Ljungberg, International Journal of Operations & Production Management 18(5), “Measurement of overall equipment effectiveness as a basis for TPM activities”, 1998. https://doi.org/10.1108/01443579810206334
- Torbjörn Ylipää, Anders Skoogh, Jon Bokrantz & Maheshwaran Gopalakrishnan, International Journal of Productivity and Performance Management 66(1), “Identification of maintenance improvement potential using OEE assessment”, 2017 (via Abstract at Chalmers Research and IDEAS/RePEc). https://doi.org/10.1108/IJPPM-01-2016-0028
- Richard Hedman, Mukund Subramaniyan & Peter Almström, Procedia CIRP 57, “Analysis of critical factors for automatic measurement of OEE”, 2016. https://doi.org/10.1016/j.procir.2016.11.023
- Marcus Bengtsson, Lars-Gunnar Andersson & Pontus Ekström, Journal of Quality in Maintenance Engineering 28(2), “Measuring preconceived beliefs on the results of overall equipment effectiveness – A case study in the automotive manufacturing industry”, 2022. https://doi.org/10.1108/JQME-03-2020-0016
- Peter Muchiri & Liliane Pintelon, International Journal of Production Research 46(13), “Performance measurement using overall equipment effectiveness (OEE): literature review and practical application discussion”, 2008 (via Submitted version on HAL). https://hal.science/hal-00512968
- David Simons, Robert Mason & Bernard Gardner, International Journal of Logistics: Research and Applications 7(2), “Overall vehicle effectiveness”, 2004 (via Abstract at IAOR). https://doi.org/10.1080/13675560410001670233
Edit orial me thod
Each figure was checked for its year, its publisher and what exactly it measures. Where the publisher's page could not be opened, the figure was checked against independent summaries and is marked “via”. The editors' interpretation is marked “Our reading”. Figures that could not be confirmed are not in the issue.
Management Review · Monthly edition