In the SCOR model an order is perfect only if it arrives in full, on time to the date first promised, undamaged and with correct documents. In APQC's benchmarking the median company scores 90, and 99% on each of the four parts gives only 96%. Walmart raised its bar for full truckloads from 75% to 87% between 2017 and 2019. McKinsey found no standard definition of OTIF in the consumer sector, and a case study found that missing shared definitions held customers and suppliers back.
Management Review · Monthly edition · October 2026 · No. 27
OTIF and the perfect order
Why the median company ships one order in ten with a failure, why 99% on every part gives 96%, a retailer's rising bar, which date makes a delivery on time, and a card for the perfect order.
- No.
- 27
- Pages
- 10
- Sources
- 8
- Topics
- KPIs
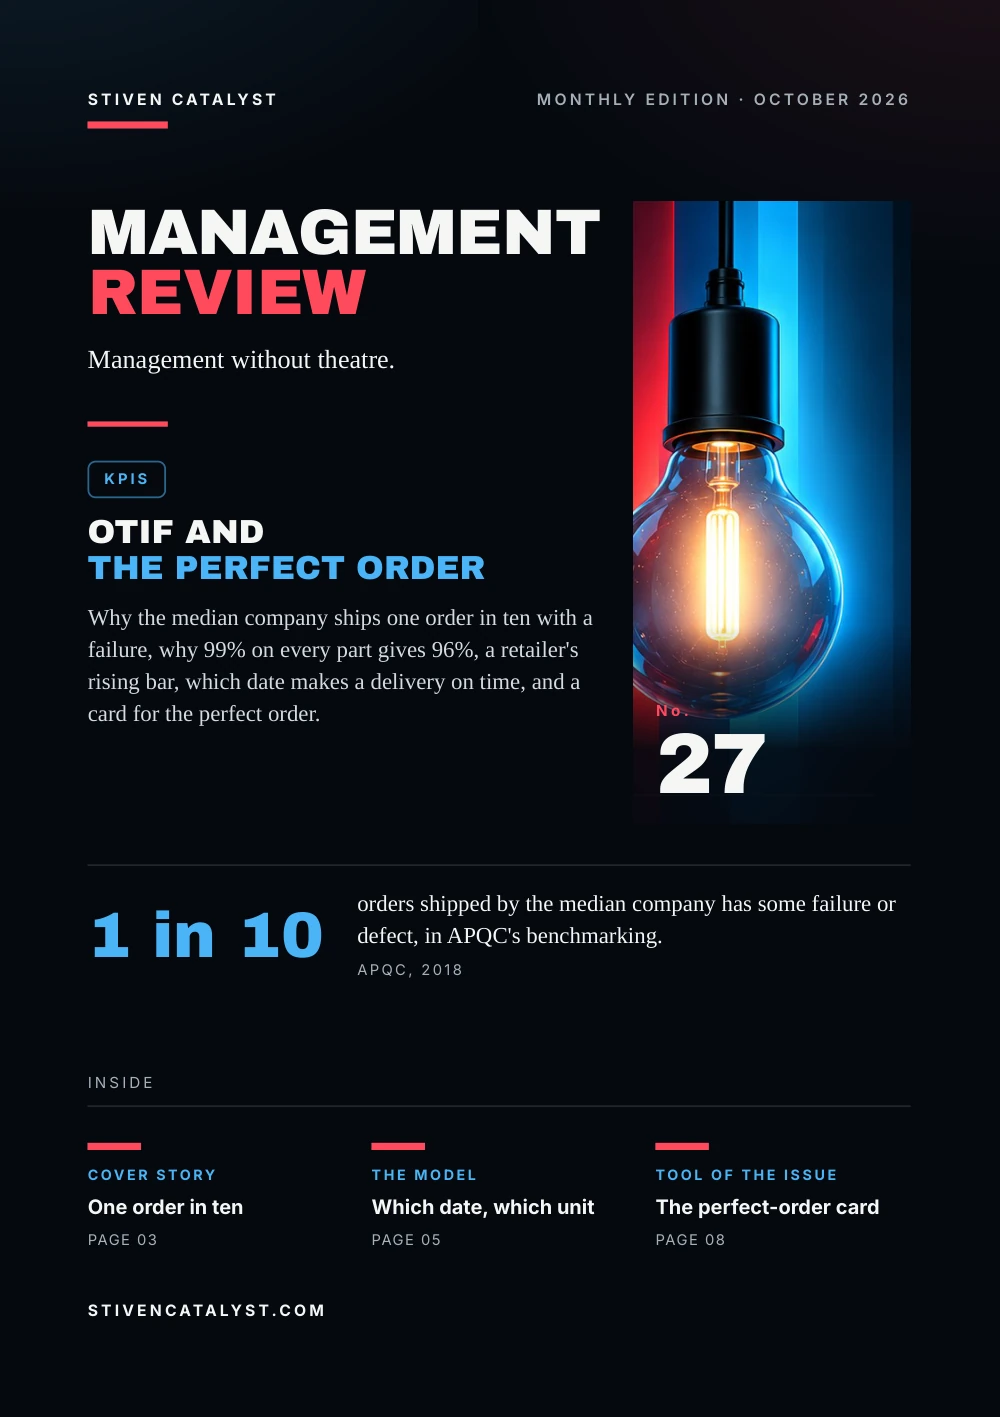
Stiven CatalystMonthly edition · October 2026
ManagementReview
Management without theatre.
KPIs
OTIF andthe perfect order
Why the median company ships one order in ten with a failure, why 99% on every part gives 96%, a retailer's rising bar, which date makes a delivery on time, and a card for the perfect order.

No.27
1 in 10
orders shipped by the median company has some failure or defect, in APQC's benchmarking.APQC, 2018
stivencatalyst.com
No. 27 · KPIs
In this issue
Logistics reports on time and in full as if everyone meant the same thing. This issue asks what makes an order perfect, who decides when a delivery is on time, and why good rates can still leave one order in ten short.
- 03Cover storyOne order in ten
- 04The numbersA bar that kept rising
- 05The modelWhich date, which unit
- 06What the research saysWhen the definition is not shared
- 07How it is measuredCounting perfect orders
- 08Tool of the issueThe perfect-order card
- 09SourcesSources and method
How to read this issue
Figure
Every figure has its source and year at the foot of its page.
Our reading
Where the editors interpret rather than the research, it says so.
Practice
The steps and the card are proposals to try, not research results.
Cover story
One orderin ten
APQC compares the perfect order across companies. At the median company the index is 90: one order in ten that it ships has some failure or defect. The top quartile reaches 95 or more.
APQC's worked example: four rates and the share of perfect orders they give (%)
The four rates are multiplied, so the perfect order can never be higher than the weakest of them. APQC notes that a company with 99% on each of the four parts reaches only 96% overall.
Our reading
Four rates that each look good can still leave one order in ten short. The customer receives the order, not the rates.
Sources: APQC, IndustryWeek, 2018; APQC, Open Standards Benchmarking, 2026
The example's rates are illustrative, not a company's data: 0.98 × 0.97 × 0.99 × 0.82 = 0.772. The median and the top quartile were published in 2018; the sample is not given.
The numbers
A bar thatkep t rising
From August 2017 Walmart fined US suppliers whose deliveries did not arrive on time and in full: 3% of the cost of the goods affected. Arriving early counted as a failure too.
Walmart's on-time, in-full threshold for full truckloads
A target of 95% within one day had been announced for February 2018. In January 2018 Walmart set it aside: from April the bar was 85% for full truckloads and 50% for smaller loads, up from 33%, within a two-day window. In March 2019 it rose to 87%, and Walmart said it would measure on time and in full separately, so that suppliers would focus on completeness.
Our reading
A threshold says what the customer will fine, not how well the supplier delivers. And it moves when the customer decides.
Sources: Talk Business & Politics, 2018; Supply Chain Dive, 2019
Announced rules, not measured results, as reported by the trade press; Walmart's own pages were not consulted. Some reports call the two groups large and small suppliers.
The model
Which date,which unit
OTIF counts the deliveries that reach their destination in the quantity and at the time written on the order. In 2019 McKinsey found no standard definition of either half in the consumer sector.
On time: by which date?
- the date the retailer requests
- the date the manufacturer promises
- a set slot or an agreed window
In full: counted how?
- by order
- by line
- by case
Survey of 24 retailers and manufacturers, North America
McKinsey proposed counting the cases delivered by the requested date as a share of those ordered, one day early accepted; the survey found no agreement on the window.
Our reading
Two companies can both report 95% and measure different things. Before comparing OTIF, ask which date and which unit.
Source: McKinsey & Company, 2019
Preferences of 24 large companies, not measured performance; the date of the survey is not given. The definition is McKinsey's proposal, not an adopted standard.
More in the essayWhat last mile taught me about running real operations
What the research says
When the definitionis not shared
Helena Forslund and Patrik Jonsson followed six customer–supplier pairs in manufacturing. Missing shared definitions of the metrics, and gaps in the ERP systems, were the main obstacles to managing delivery performance together; the practical problems showed above all in measuring on-time delivery.
In 2022 a McKinsey survey of 35 senior executives at 28 consumer-goods companies in North America found the definitions still moving. More than half said retailers had tightened their OTIF rules, with narrower windows and higher fines.
85%said at least one key retailer had moved, in the past 12 months, from the requested delivery date to a planned or promised one
17%said they recover more than 75% of their real cost to serve
Our reading
When the customer changes the definition, the same work gets a different score. Agree on the definition before arguing about the number.
Sources: Helena Forslund & Patrik Jonsson, International Journal of Physical Distribution & Logistics Management, 2007; Shruti Lal & Colin Regnier, McKinsey & Company, 2022
A case study of six pairs, not a statistical sample; the survey figures are self-reports of 28 companies.
How it is measured
Countingperfect orders
In the SCOR model, perfect order fulfillment (RL.1.1) is perfect orders divided by all orders. An order is perfect only when every line in it is perfect: one error in one line takes the whole order out.
- 01
In full
the product and quantity ordered
- 02
On time
to the date first promised to the customer
- 03
Documents
complete and accurate
- 04
Condition
no damage on delivery
Hypothetical example, one month
- Orders
- 200: 6 late, 4 incomplete, 2 damaged, 3 with wrong documents
- Counted
- the 15 failures fall on 12 orders: 188 of 200 = 94.0%
- Multiplied
- 97% × 98% × 99% × 98.5% = 92.7%
SCOR counts orders, APQC multiplies rates: from the same orders they give different figures, so say which one you report. The orders are invented.
Sources: ASCM, 2026; APQC, Open Standards Benchmarking, 2026
SCOR times the delivery against the date first promised to the customer, not the date requested; the cost of the order is measured elsewhere in the model.
Open the tool: Delay Analyzerstivencatalyst.com/tools/delay-analyzer/
Tool of the issue
The perfect-ordercard
Check a sample of orders each week against the four conditions, with the definitions agreed with the customer written at the top. Count the reasons, not only the rate.
01Definitionson time to which date and window; in full by order, line or case
02Ordernumber, customer, number of lines
03In fullevery line in the quantity ordered: yes or no
04On timeagainst the agreed date and window: yes or no
05Condition and documentsany damage; anything wrong or missing in the papers
06Perfect or notif not, the first condition that failed and its cause
Source: ASCM, 2026
A practice proposed by the editors, after the SCOR model (RL.1.1).
Open the tool: Last-Mile CX Control Towerstivencatalyst.com/tools/cx-control-tower/
Sources and method
Every figurehas a source.
The figures in this issue come from the sources below. The year shows how recent each one is.
- SCOR Digital Standard, Reliability: RL.1.1 (perfect order fulfillment)ASCM, 2026https://scor.ascm.org/performance/reliability/RL.1.1
- Perfect order performanceAPQC, Open Standards Benchmarking, 2026https://www.apqc.org/resources/benchmarking/open-standards-benchmarking/measures/perfect-order-performance
- Achieving the Impossible Dream: Perfect Order PerformanceAPQC, IndustryWeek, 2018https://www.industryweek.com/supply-chain/article/22026774/achieving-the-impossible-dream-perfect-order-performance
- Wal-Mart updates suppliers on new OTIF requirementsTalk Business & Politics, 2018https://talkbusiness.net/2018/01/wal-mart-updates-suppliers-on-new-otif-requirements/
- Walmart tightens on-time, in-full rate for suppliers to 87%Supply Chain Dive, 2019https://www.supplychaindive.com/news/walmart-on-time-in-full-87-suppliers/550083/
- Defining ‘on-time, in-full’ in the consumer sectorMcKinsey & Company, 2019https://www.mckinsey.com/capabilities/operations/our-insights/defining-on-time-in-full-in-the-consumer-sector
- Great service—but who's paying?Shruti Lal & Colin Regnier, McKinsey & Company, 2022https://www.mckinsey.com/capabilities/operations/our-insights/great-service-but-whos-paying
- Dyadic integration of the performance management process: A delivery service case studyHelena Forslund & Patrik Jonsson, International Journal of Physical Distribution & Logistics Management, 2007https://doi.org/10.1108/09600030710776473
Editorial method
Each figure was checked for its year, its publisher and what exactly it measures. Where the publisher's page could not be opened, the figure was checked against independent summaries and is marked “via”. The editors' interpretation is marked “Our reading”. Figures that could not be confirmed are not in the issue.
ManagementReview
Management without theatre.
Every issue, one management question, checked against the best research.
All issues
stivencatalyst.com/magazine/management-review.html
Management Review · No. 27 · October 2026 · Stiven Catalyst
Click or swipe a page to turn it. The arrow keys work too.
Management Review · No. 27
The figures of the issue
The charts of the printed pages, with their sources.
Source: APQC, Open Standards Benchmarking, 2026
Sources: Talk Business & Politics, 2018; Supply Chain Dive, 2019
Source: McKinsey & Company, 2019
The whole text Read the issue as text For reading on a small screen, searching or a screen reader. The same words, without the page design.
In this issue
Logistics reports on time and in full as if everyone meant the same thing. This issue asks what makes an order perfect, who decides when a delivery is on time, and why good rates can still leave one order in ten short.
In the SCOR model an order is perfect only if it arrives in full, on time to the date first promised, undamaged and with correct documents. In APQC's benchmarking the median company scores 90, and 99% on each of the four parts gives only 96%. Walmart raised its bar for full truckloads from 75% to 87% between 2017 and 2019. McKinsey found no standard definition of OTIF in the consumer sector, and a case study found that missing shared definitions held customers and suppliers back.
Stiven Janaqi, Editor
Cover story
One order in ten
APQC compares the perfect order across companies. At the median company the index is 90: one order in ten that it ships has some failure or defect. The top quartile reaches 95 or more.
APQC's worked example: four rates and the share of perfect orders they give (%): On time 98, In full 97, Undamaged 99, Documents 82, Perfect 77.2.
The four rates are multiplied, so the perfect order can never be higher than the weakest of them. APQC notes that a company with 99% on each of the four parts reaches only 96% overall.
Our reading
Four rates that each look good can still leave one order in ten short. The customer receives the order, not the rates.
The example's rates are illustrative, not a company's data: 0.98 × 0.97 × 0.99 × 0.82 = 0.772. The median and the top quartile were published in 2018; the sample is not given.
Sources: APQC, IndustryWeek, 2018; APQC, Open Standards Benchmarking, 2026
The numbers
A bar that kep t rising
From August 2017 Walmart fined US suppliers whose deliveries did not arrive on time and in full: 3% of the cost of the goods affected. Arriving early counted as a failure too.
Walmart's on-time, in-full threshold for full truckloads: Aug 2017 75%, Apr 2018 85%, Mar 2019 87%.
A target of 95% within one day had been announced for February 2018. In January 2018 Walmart set it aside: from April the bar was 85% for full truckloads and 50% for smaller loads, up from 33%, within a two-day window. In March 2019 it rose to 87%, and Walmart said it would measure on time and in full separately, so that suppliers would focus on completeness.
Our reading
A threshold says what the customer will fine, not how well the supplier delivers. And it moves when the customer decides.
Announced rules, not measured results, as reported by the trade press; Walmart's own pages were not consulted. Some reports call the two groups large and small suppliers.
Sources: Talk Business & Politics, 2018; Supply Chain Dive, 2019
The model
Which date, which unit
OTIF counts the deliveries that reach their destination in the quantity and at the time written on the order. In 2019 McKinsey found no standard definition of either half in the consumer sector.
On time: by which date?
- the date the retailer requests
- the date the manufacturer promises
- a set slot or an agreed window
In full: counted how?
- by order
- by line
- by case
Survey of 24 retailers and manufacturers, North America: An industry standard for OTIF would create value 92%, Prefer to count in full by case 79%, Prefer the requested delivery date 67%.
McKinsey proposed counting the cases delivered by the requested date as a share of those ordered, one day early accepted; the survey found no agreement on the window.
Our reading
Two companies can both report 95% and measure different things. Before comparing OTIF, ask which date and which unit.
Preferences of 24 large companies, not measured performance; the date of the survey is not given. The definition is McKinsey's proposal, not an adopted standard.
Source: McKinsey & Company, 2019
More in the essay: What last mile taught me about running real operations
What the research says
When the definition is not shared
Helena Forslund and Patrik Jonsson followed six customer–supplier pairs in manufacturing. Missing shared definitions of the metrics, and gaps in the ERP systems, were the main obstacles to managing delivery performance together; the practical problems showed above all in measuring on-time delivery.
In 2022 a McKinsey survey of 35 senior executives at 28 consumer-goods companies in North America found the definitions still moving. More than half said retailers had tightened their OTIF rules, with narrower windows and higher fines.
- 85% said at least one key retailer had moved, in the past 12 months, from the requested delivery date to a planned or promised one
- 17% said they recover more than 75% of their real cost to serve
Our reading
When the customer changes the definition, the same work gets a different score. Agree on the definition before arguing about the number.
A case study of six pairs, not a statistical sample; the survey figures are self-reports of 28 companies.
Sources: Helena Forslund & Patrik Jonsson, International Journal of Physical Distribution & Logistics Management, 2007; Shruti Lal & Colin Regnier, McKinsey & Company, 2022
How it is measured
Counting perfect orders
In the SCOR model, perfect order fulfillment (RL.1.1) is perfect orders divided by all orders. An order is perfect only when every line in it is perfect: one error in one line takes the whole order out.
- In full. the product and quantity ordered
- On time. to the date first promised to the customer
- Documents. complete and accurate
- Condition. no damage on delivery
Hypothe tical example, one month
- Orders: 200: 6 late, 4 incomplete, 2 damaged, 3 with wrong documents
- Counted: the 15 failures fall on 12 orders: 188 of 200 = 94.0%
- Multiplied: 97% × 98% × 99% × 98.5% = 92.7%
SCOR counts orders, APQC multiplies rates: from the same orders they give different figures, so say which one you report. The orders are invented.
SCOR times the delivery against the date first promised to the customer, not the date requested; the cost of the order is measured elsewhere in the model.
Sources: ASCM, 2026; APQC, Open Standards Benchmarking, 2026
Open the tool: Delay Analyzer
Tool of the issue
The perfect-order card
Check a sample of orders each week against the four conditions, with the definitions agreed with the customer written at the top. Count the reasons, not only the rate.
- Definitions on time to which date and window; in full by order, line or case
- Order number, customer, number of lines
- In full every line in the quantity ordered: yes or no
- On time against the agreed date and window: yes or no
- Condition and documents any damage; anything wrong or missing in the papers
- Perfect or not if not, the first condition that failed and its cause
A practice proposed by the editors, after the SCOR model (RL.1.1).
Source: ASCM, 2026
Open the tool: Last-Mile CX Control Tower
Sources and method
Every figure has a source.
The figures in this issue come from the sources below. The year shows how recent each one is.
- ASCM, “SCOR Digital Standard, Reliability: RL.1.1 (perfect order fulfillment)”, 2026. https://scor.ascm.org/performance/reliability/RL.1.1
- APQC, Open Standards Benchmarking, “Perfect order performance”, 2026. https://www.apqc.org/resources/benchmarking/open-standards-benchmarking/measures/perfect-order-performance
- APQC, IndustryWeek, “Achieving the Impossible Dream: Perfect Order Performance”, 2018. https://www.industryweek.com/supply-chain/article/22026774/achieving-the-impossible-dream-perfect-order-performance
- Talk Business & Politics, “Wal-Mart updates suppliers on new OTIF requirements”, 2018. https://talkbusiness.net/2018/01/wal-mart-updates-suppliers-on-new-otif-requirements/
- Supply Chain Dive, “Walmart tightens on-time, in-full rate for suppliers to 87%”, 2019. https://www.supplychaindive.com/news/walmart-on-time-in-full-87-suppliers/550083/
- McKinsey & Company, “Defining ‘on-time, in-full’ in the consumer sector”, 2019. https://www.mckinsey.com/capabilities/operations/our-insights/defining-on-time-in-full-in-the-consumer-sector
- Shruti Lal & Colin Regnier, McKinsey & Company, “Great service—but who's paying?”, 2022. https://www.mckinsey.com/capabilities/operations/our-insights/great-service-but-whos-paying
- Helena Forslund & Patrik Jonsson, International Journal of Physical Distribution & Logistics Management, “Dyadic integration of the performance management process: A delivery service case study”, 2007. https://doi.org/10.1108/09600030710776473
Edit orial me thod
Each figure was checked for its year, its publisher and what exactly it measures. Where the publisher's page could not be opened, the figure was checked against independent summaries and is marked “via”. The editors' interpretation is marked “Our reading”. Figures that could not be confirmed are not in the issue.
Management Review · Monthly edition