FMEA began in the US military in 1949. Its Risk Priority Number multiplies three scores from 1 to 10, yet its 1,000 combinations give only 120 different values, and a severe failure can rank below a mild one. When two hospital teams analysed the same process, only 17 of their 50 failures each were the same. The 2019 AIAG & VDA handbook replaced the number with an Action Priority, and Tony Cox showed that risk matrices can rank smaller risks above larger ones.
Management Review · Monthly edition · October 2026 · No. 28
Operational risk: FMEA and the risk matrix
Why the RPN takes only 120 values, two teams and one process, the Action Priority of 2019, what is wrong with risk matrices, and a card for failure modes.
- No.
- 28
- Pages
- 10
- Sources
- 8
- Topics
- Strategy
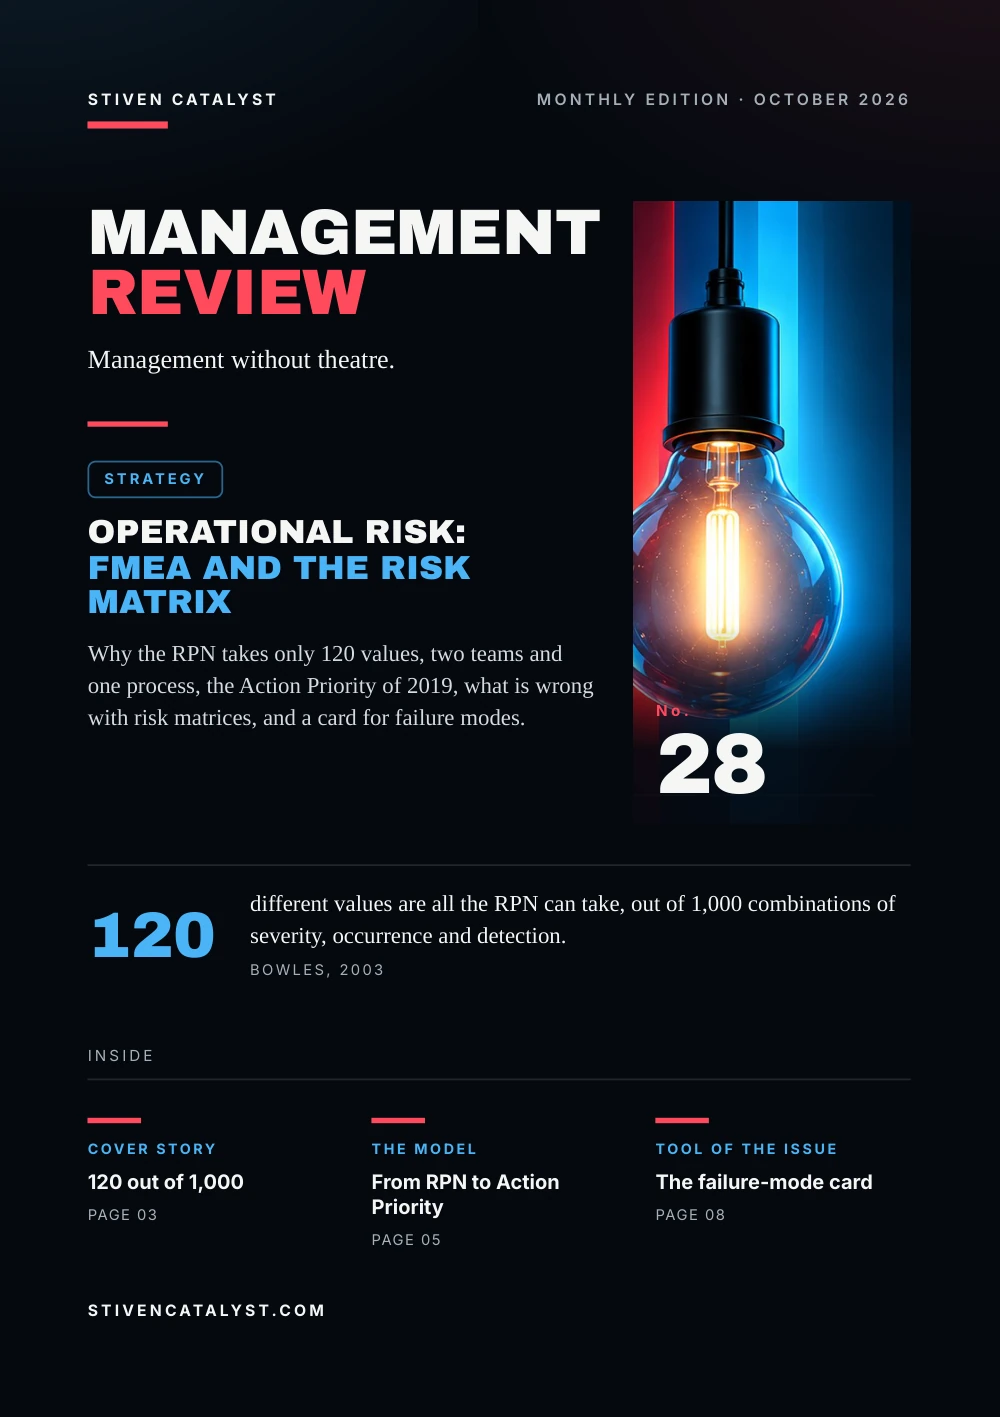
Stiven CatalystMonthly edition · October 2026
ManagementReview
Management without theatre.
Strategy
Operational risk:FMEA and the risk matrix
Why the RPN takes only 120 values, two teams and one process, the Action Priority of 2019, what is wrong with risk matrices, and a card for failure modes.

No.28
120
different values are all the RPN can take, out of 1,000 combinations of severity, occurrence and detection.Bowles, 2003
stivencatalyst.com
No. 28 · Strategy
In this issue
Every operation keeps a list of what could go wrong. This issue asks how that list gets scored, why the most common scores mislead, and what to use instead to decide which risk to act on first.
- 03Cover story120 out of 1,000
- 04The numbersTwo teams, one process
- 05The modelFrom RPN to Action Priority
- 06What the research saysWhat is wrong with risk matrices
- 07How it is measuredScoring risk without fooling yourself
- 08Tool of the issueThe failure-mode card
- 09SourcesSources and method
How to read this issue
Figure
Every figure has its source and year at the foot of its page.
Our reading
Where the editors interpret rather than the research, it says so.
Practice
The steps and the card are proposals to try, not research results.
Cover story
120 outof 1,000
Failure Mode and Effects Analysis began in the US military, with procedure MIL-P-1629 of 1949. Its best-known number is the Risk Priority Number: severity × occurrence × detection, each scored from 1 to 10.
How the 1,000 combinations of the three scores spread over the RPN (editors' calculation)
The RPN looks like a scale from 1 to 1,000, but John Bowles showed that only 120 different values can occur: none lies between 901 and 999, and 120 itself comes from 24 different combinations. A severe failure can rank low: severity 10 with occurrence 1 and detection 1 gives 10, while 4 × 4 × 4 gives 64.
Our reading
Multiplying three ordinal scores produces a number that looks precise and is not. The three scores say more when read one by one.
Sources: U.S. Armed Forces, 1949; John B. Bowles, Annual Reliability and Maintainability Symposium (IEEE), 2003
The chart is the editors' calculation over all 1,000 combinations; the 120 values and the 24 ways to reach 120 follow Bowles.
The numbers
Two teams,one process
In two hospitals of the same NHS trust, two teams ran an FMEA of the same process at the same time: the use of the antibiotics vancomycin and gentamicin.
Failures found by each team, and by both
Their scores for severity and detectability, and their RPNs, differed markedly, so the failures were ranked differently. In a study of hazards in public leisure activities, David Ball and John Watt found that different assessors placed the same hazard very differently on a risk matrix, and the spread stayed large even after long reflection.
Our reading
An FMEA says as much about the team as about the process. A second team, or a second look, finds what one team misses.
Sources: Nada Atef Shebl, Bryony Dean Franklin & Nick Barber, Journal of Patient Safety, 2009; David Ball & John Watt, Risk Analysis, 2013
17 of 50 is 34% for each team; the study's 17% is counted over all 100 failures. One process in one trust.
The model
From RPN t oAction Priorit y
In June 2019 AIAG and VDA, the US and German automotive bodies, published a joint FMEA handbook. It sets out seven steps and replaces the RPN with an Action Priority, read from a table that gives severity the most weight, then occurrence, then detection.
Analysis
- 1 Planning and preparation
- 2 Structure analysis
- 3 Function analysis
- 4 Failure analysis
Risk and action
- 5 Risk analysis
- 6 Optimisation
- 7 Documenting the results (new)
High
Highest priority: improve prevention or detection, or document why the current controls are enough.
Medium
Find actions or, if the company decides so, document why the controls are enough.
Low
Actions may be found.
Our reading
The question changes from “how big is the number?” to “what must we do?”. That is the question a team can act on.
Source: AIAG & VDA QMC, 2019
The grouping of the steps is the editors'. Some customers still accept the RPN alongside the Action Priority.
More in the essayWhy the shift handover is one of the most underrated processes
What the research says
What is wrong withrisk matrices
In 2008 Tony Cox analysed risk matrices mathematically in the journal Risk Analysis. He found four kinds of problem.
Poor resolution
Typical matrices compare correctly only a small share of pairs of risks, in his example less than 10%, and give the same rating to very different risks.
Errors
They can rate smaller risks above larger ones; when frequency and severity are negatively related, they can be worse than useless.
Resources
Resources for reducing risk cannot be allocated well on the basis of their categories.
Judgment
Inputs and outputs need subjective interpretation; different users can rate the same risks in opposite ways.
In 2013 Philip Thomas, Reidar Bratvold and Eric Bickel found no published scientific study showing that risk matrices improve risk decisions. In one drilling example, reversing the scoring scale reversed the order of priorities.
Our reading
A matrix is a picture of judgments, not a measurement. It can open a conversation; it should not close one.
Sources: Louis Anthony (Tony) Cox Jr., Risk Analysis, 2008; Philip Thomas, Reidar B. Bratvold & J. Eric Bickel, SPE Annual Technical Conference and Exhibition, 2013
Cox's results are mathematical, not measurements in organisations; the 10% is his example.
How it is measured
Scoring riskwithout fooling yourself
ISO 31000 defines risk as the effect of uncertainty on objectives, positive or negative, and treats managing it as a process: identify, analyse, evaluate, treat, and keep monitoring and communicating.
List failures with the people who do the work
Two groups, or two sessions, find more than one.
Keep the three scores apart
Write down severity, occurrence and detection, not only their product.
Look at severity first
A failure with severity 9 or 10 gets an action or a written reason, whatever its RPN.
Score again after the action
If nothing was done, the risk has not changed.
Hypothetical example, two failures in a warehouse
- Label
- Wrong label on a pallet: 4 × 6 × 3 = RPN 72
- Cold chain
- A medicine order left unrefrigerated: 10 × 2 × 3 = RPN 60
The RPN puts the label first; severity puts the cold chain first. The failures and scores are invented.
Source: ISO, 2018
The steps and the example are the editors'; the scores are severity × occurrence × detection.
Tool of the issue
The failure-modecard
One card per process step. Fill it in with the people who do the work, and keep the three scores side by side.
01Process stepwhere in the process, and who does it
02What can go wrongthe failure mode, in the words of the people who see it
03Effecton the customer, the next step or safety
04Severity · occurrence · detectionthree scores from 1 to 10, written separately
05Priorityhigh, medium or low, and the reason
06Action and checkwhat we do, who, by when, and the scores afterwards
Source: AIAG & VDA QMC, 2019
A practice proposed by the editors, after the AIAG & VDA handbook (2019).
Sources and method
Every figurehas a source.
The figures in this issue come from the sources below. The year shows how recent each one is.
- MIL-P-1629: Procedures for Performing a Failure Mode, Effects and Criticality AnalysisU.S. Armed Forces, 1949
- An Assessment of RPN Prioritization in a Failure Modes Effects and Criticality AnalysisJohn B. Bowles, Annual Reliability and Maintainability Symposium (IEEE), 2003
- Is failure mode and effect analysis reliable?Nada Atef Shebl, Bryony Dean Franklin & Nick Barber, Journal of Patient Safety, 2009https://doi.org/10.1097/PTS.0b013e3181a6f040
- Further Thoughts on the Utility of Risk MatricesDavid Ball & John Watt, Risk Analysis, 2013https://doi.org/10.1111/risa.12057
- AIAG & VDA FMEA Handbook: Design FMEA, Process FMEA, Supplemental FMEA for Monitoring & System ResponseAIAG & VDA QMC, 2019https://webshop.vda.de/QMC/en/aiag-vda-fmea-handbook_eng
- What's Wrong with Risk Matrices?Louis Anthony (Tony) Cox Jr., Risk Analysis, 2008https://doi.org/10.1111/j.1539-6924.2008.01030.x
- The Risk of Using Risk MatricesPhilip Thomas, Reidar B. Bratvold & J. Eric Bickel, SPE Annual Technical Conference and Exhibition, 2013https://doi.org/10.2118/166269-MS
- ISO 31000:2018 Risk management — GuidelinesISO, 2018https://www.iso.org/standard/65694.html
Editorial method
Each figure was checked for its year, its publisher and what exactly it measures. Where the publisher's page could not be opened, the figure was checked against independent summaries and is marked “via”. The editors' interpretation is marked “Our reading”. Figures that could not be confirmed are not in the issue.
ManagementReview
Management without theatre.
Every issue, one management question, checked against the best research.
All issues
stivencatalyst.com/magazine/management-review.html
Management Review · No. 28 · October 2026 · Stiven Catalyst
Click or swipe a page to turn it. The arrow keys work too.
Management Review · No. 28
The figures of the issue
The charts of the printed pages, with their sources.
Source: John B. Bowles, Annual Reliability and Maintainability Symposium (IEEE), 2003
Source: Nada Atef Shebl, Bryony Dean Franklin & Nick Barber, Journal of Patient Safety, 2009
The whole text Read the issue as text For reading on a small screen, searching or a screen reader. The same words, without the page design.
In this issue
Every operation keeps a list of what could go wrong. This issue asks how that list gets scored, why the most common scores mislead, and what to use instead to decide which risk to act on first.
FMEA began in the US military in 1949. Its Risk Priority Number multiplies three scores from 1 to 10, yet its 1,000 combinations give only 120 different values, and a severe failure can rank below a mild one. When two hospital teams analysed the same process, only 17 of their 50 failures each were the same. The 2019 AIAG & VDA handbook replaced the number with an Action Priority, and Tony Cox showed that risk matrices can rank smaller risks above larger ones.
Stiven Janaqi, Editor
Cover story
120 out of 1,000
Failure Mode and Effects Analysis began in the US military, with procedure MIL-P-1629 of 1949. Its best-known number is the Risk Priority Number: severity × occurrence × detection, each scored from 1 to 10.
How the 1,000 combinations of the three scores spread over the RPN (editors' calculation): 1–200 710, 201–400 188, 401–600 70, 601–800 25, 801–1,000 7.
The RPN looks like a scale from 1 to 1,000, but John Bowles showed that only 120 different values can occur: none lies between 901 and 999, and 120 itself comes from 24 different combinations. A severe failure can rank low: severity 10 with occurrence 1 and detection 1 gives 10, while 4 × 4 × 4 gives 64.
Our reading
Multiplying three ordinal scores produces a number that looks precise and is not. The three scores say more when read one by one.
The chart is the editors' calculation over all 1,000 combinations; the 120 values and the 24 ways to reach 120 follow Bowles.
Sources: U.S. Armed Forces, 1949; John B. Bowles, Annual Reliability and Maintainability Symposium (IEEE), 2003
The numbers
Two teams, one process
In two hospitals of the same NHS trust, two teams ran an FMEA of the same process at the same time: the use of the antibiotics vancomycin and gentamicin.
Failures found by each team, and by both: Team 1 50, Team 2 50, Found by both 17.
Their scores for severity and detectability, and their RPNs, differed markedly, so the failures were ranked differently. In a study of hazards in public leisure activities, David Ball and John Watt found that different assessors placed the same hazard very differently on a risk matrix, and the spread stayed large even after long reflection.
Our reading
An FMEA says as much about the team as about the process. A second team, or a second look, finds what one team misses.
17 of 50 is 34% for each team; the study's 17% is counted over all 100 failures. One process in one trust.
Sources: Nada Atef Shebl, Bryony Dean Franklin & Nick Barber, Journal of Patient Safety, 2009; David Ball & John Watt, Risk Analysis, 2013
The model
From RPN t o Action Priorit y
In June 2019 AIAG and VDA, the US and German automotive bodies, published a joint FMEA handbook. It sets out seven steps and replaces the RPN with an Action Priority, read from a table that gives severity the most weight, then occurrence, then detection.
Analysis
- 1 Planning and preparation
- 2 Structure analysis
- 3 Function analysis
- 4 Failure analysis
Risk and action
- 5 Risk analysis
- 6 Optimisation
- 7 Documenting the results (new)
- High. Highest priority: improve prevention or detection, or document why the current controls are enough.
- Medium. Find actions or, if the company decides so, document why the controls are enough.
- Low. Actions may be found.
Our reading
The question changes from “how big is the number?” to “what must we do?”. That is the question a team can act on.
The grouping of the steps is the editors'. Some customers still accept the RPN alongside the Action Priority.
Source: AIAG & VDA QMC, 2019
More in the essay: Why the shift handover is one of the most underrated processes
What the research says
What is wrong with risk matrices
In 2008 Tony Cox analysed risk matrices mathematically in the journal Risk Analysis. He found four kinds of problem.
- Poor resolution. Typical matrices compare correctly only a small share of pairs of risks, in his example less than 10%, and give the same rating to very different risks.
- Errors. They can rate smaller risks above larger ones; when frequency and severity are negatively related, they can be worse than useless.
- Resources. Resources for reducing risk cannot be allocated well on the basis of their categories.
- Judgment. Inputs and outputs need subjective interpretation; different users can rate the same risks in opposite ways.
In 2013 Philip Thomas, Reidar Bratvold and Eric Bickel found no published scientific study showing that risk matrices improve risk decisions. In one drilling example, reversing the scoring scale reversed the order of priorities.
Our reading
A matrix is a picture of judgments, not a measurement. It can open a conversation; it should not close one.
Cox's results are mathematical, not measurements in organisations; the 10% is his example.
Sources: Louis Anthony (Tony) Cox Jr., Risk Analysis, 2008; Philip Thomas, Reidar B. Bratvold & J. Eric Bickel, SPE Annual Technical Conference and Exhibition, 2013
How it is measured
Scoring risk without fooling yourself
ISO 31000 defines risk as the effect of uncertainty on objectives, positive or negative, and treats managing it as a process: identify, analyse, evaluate, treat, and keep monitoring and communicating.
- List failures with the people who do the work. Two groups, or two sessions, find more than one.
- Keep the three scores apa
r t. Write down severity, occurrence and detection, not only their product. - Look at severi
t y first. A failure with severity 9 or 10 gets an action or a written reason, whatever its RPN. - Score again a
f ter the action. If nothing was done, the risk has not changed.
Hypothe tical example, two failures in a warehouse
- Label: Wrong label on a pallet: 4 × 6 × 3 = RPN 72
- Cold chain: A medicine order left unrefrigerated: 10 × 2 × 3 = RPN 60
The RPN puts the label first; severity puts the cold chain first. The failures and scores are invented.
The steps and the example are the editors'; the scores are severity × occurrence × detection.
Source: ISO, 2018
Tool of the issue
The failure-mode card
One card per process step. Fill it in with the people who do the work, and keep the three scores side by side.
- Process step where in the process, and who does it
- What can go wrong the failure mode, in the words of the people who see it
- Effect on the customer, the next step or safety
- Severi
t y · occurrence · de tection three scores from 1 to 10, written separately - Priori
t y high, medium or low, and the reason - Action and check what we do, who, by when, and the scores afterwards
A practice proposed by the editors, after the AIAG & VDA handbook (2019).
Source: AIAG & VDA QMC, 2019
Sources and method
Every figure has a source.
The figures in this issue come from the sources below. The year shows how recent each one is.
- U.S. Armed Forces, “MIL-P-1629: Procedures for Performing a Failure Mode, Effects and Criticality Analysis”, 1949.
- John B. Bowles, Annual Reliability and Maintainability Symposium (IEEE), “An Assessment of RPN Prioritization in a Failure Modes Effects and Criticality Analysis”, 2003.
- Nada Atef Shebl, Bryony Dean Franklin & Nick Barber, Journal of Patient Safety, “Is failure mode and effect analysis reliable?”, 2009. https://doi.org/10.1097/PTS.0b013e3181a6f040
- David Ball & John Watt, Risk Analysis, “Further Thoughts on the Utility of Risk Matrices”, 2013. https://doi.org/10.1111/risa.12057
- AIAG & VDA QMC, “AIAG & VDA FMEA Handbook: Design FMEA, Process FMEA, Supplemental FMEA for Monitoring & System Response”, 2019. https://webshop.vda.de/QMC/en/aiag-vda-fmea-handbook_eng
- Louis Anthony (Tony) Cox Jr., Risk Analysis, “What's Wrong with Risk Matrices?”, 2008. https://doi.org/10.1111/j.1539-6924.2008.01030.x
- Philip Thomas, Reidar B. Bratvold & J. Eric Bickel, SPE Annual Technical Conference and Exhibition, “The Risk of Using Risk Matrices”, 2013. https://doi.org/10.2118/166269-MS
- ISO, “ISO 31000:2018 Risk management — Guidelines”, 2018. https://www.iso.org/standard/65694.html
Edit orial me thod
Each figure was checked for its year, its publisher and what exactly it measures. Where the publisher's page could not be opened, the figure was checked against independent summaries and is marked “via”. The editors' interpretation is marked “Our reading”. Figures that could not be confirmed are not in the issue.
Management Review · Monthly edition