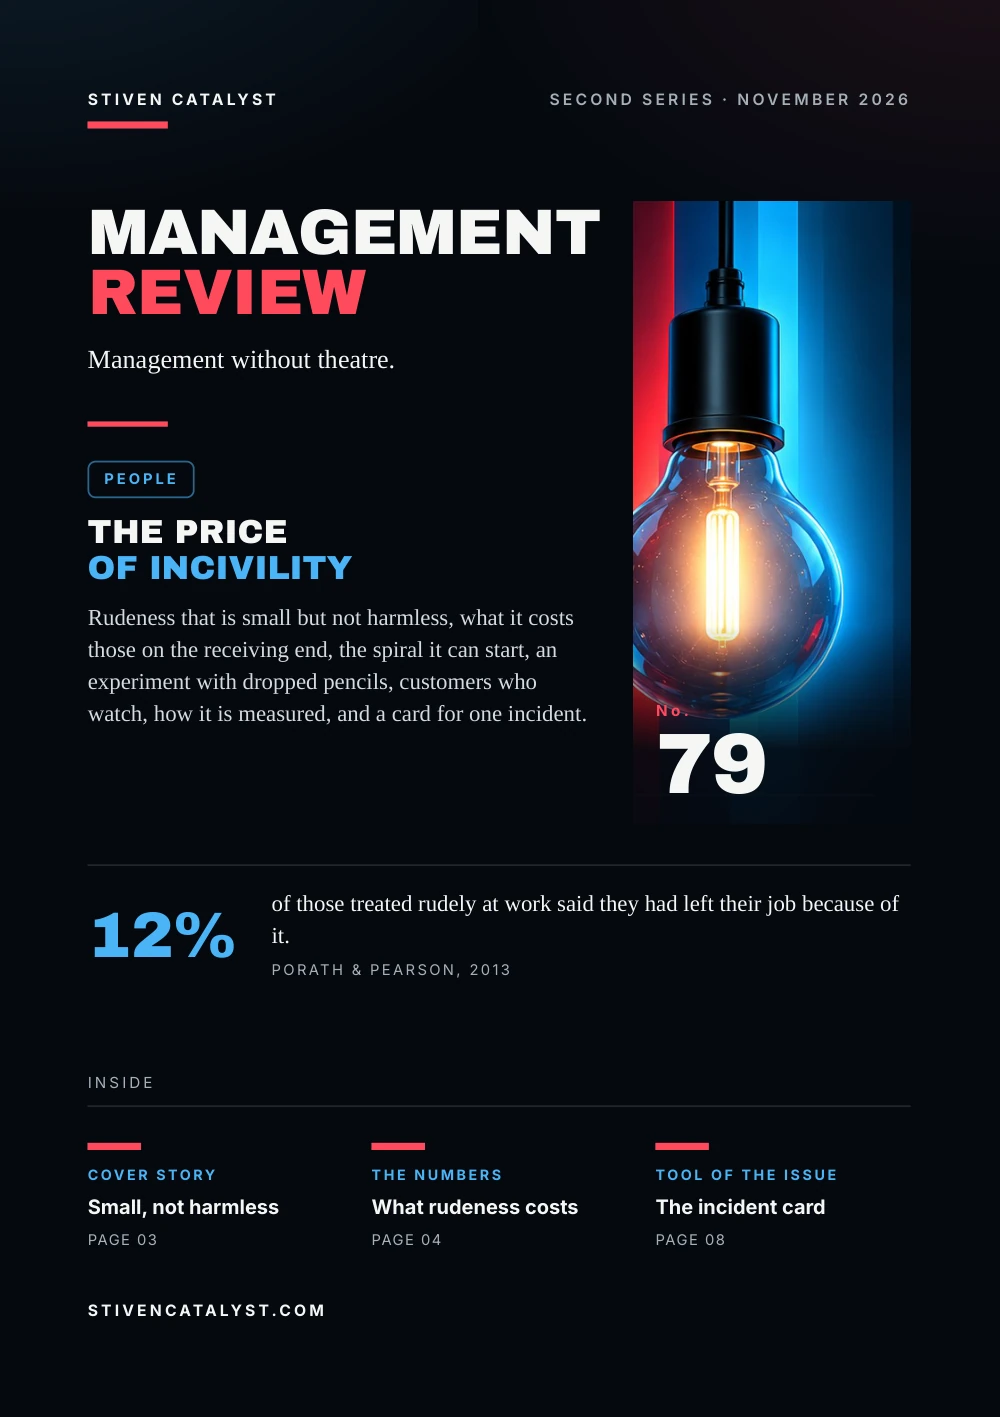
In 1939 Walter Shewhart drew specification, production and inspection as a circle, not a line. Deming's lectures in Japan in 1950 became the Deming wheel, and then PDCA; Deming later insisted on PDSA, with study in place of check. In a review of 73 healthcare reports, fewer than one in five documented a sequence of linked cycles. In 120 later projects almost all reported improvement, yet only 4% of those that could be judged applied the method fully. Five marks show whether a cycle closes, and a card helps run one.
Management Review · Second series · November 2026 · No. 80
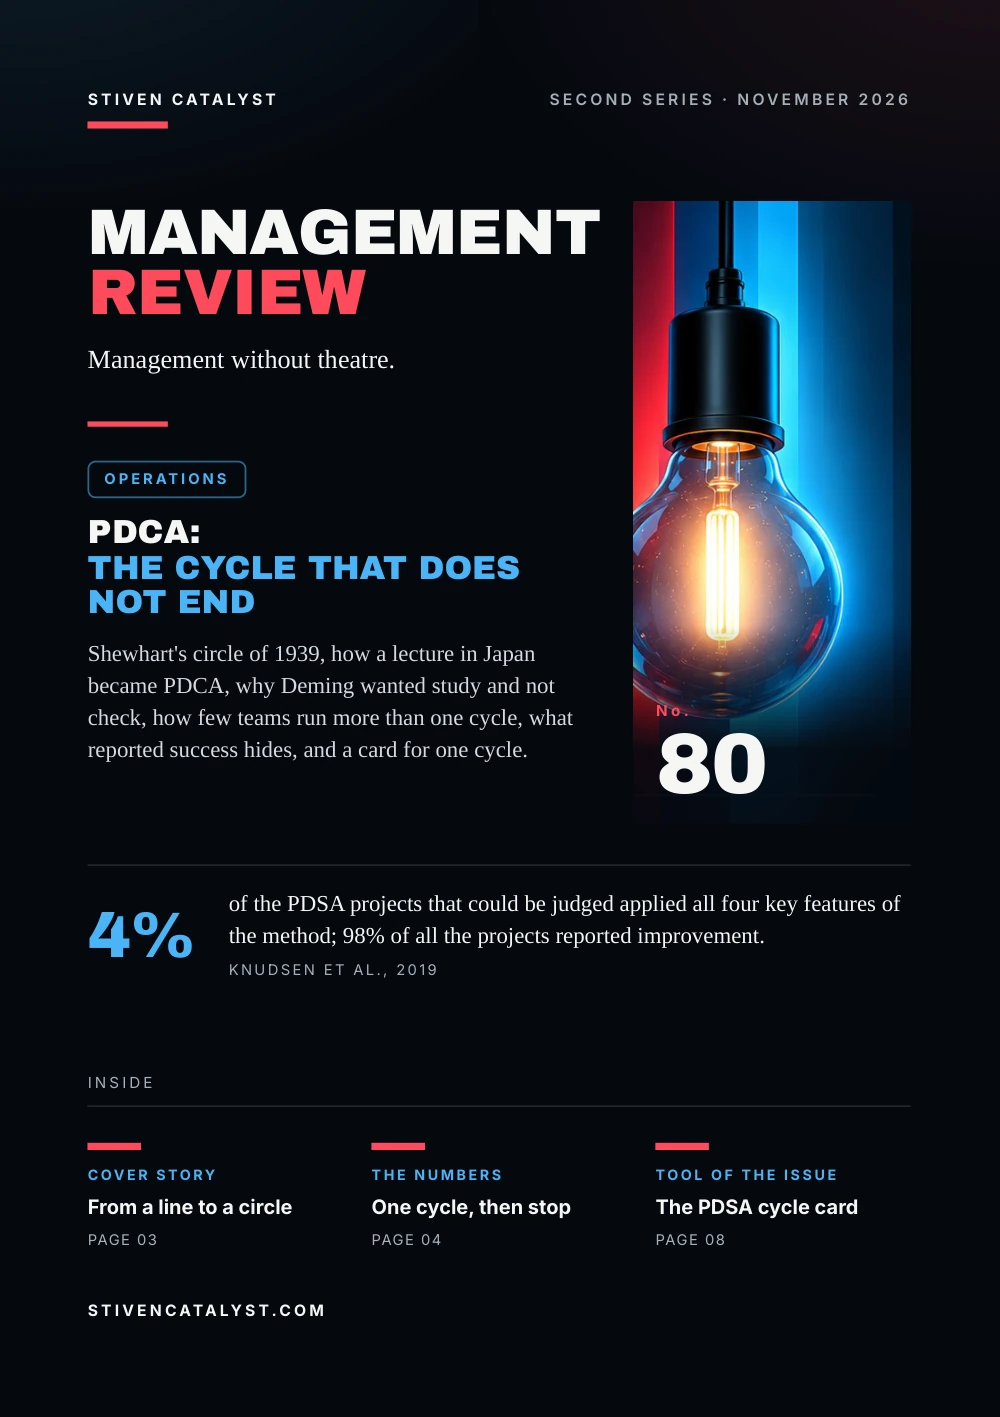
PDCA: the cycle that does not end
Shewhart's circle of 1939, how a lecture in Japan became PDCA, why Deming wanted study and not check, how few teams run more than one cycle, what reported success hides, and a card for one cycle.
- No.
- 80
- Pages
- 10
- Sources
- 6
- Topics
- Operations
Stiven CatalystSecond series · November 2026
ManagementReview
Management without theatre.
Operations
PDCA:the cycle that does not end
Shewhart's circle of 1939, how a lecture in Japan became PDCA, why Deming wanted study and not check, how few teams run more than one cycle, what reported success hides, and a card for one cycle.

No.80
4%
of the PDSA projects that could be judged applied all four key features of the method; 98% of all the projects reported improvement.Knudsen et al., 2019
stivencatalyst.com
No. 80 · Operations
In this issue
PDCA is on almost every improvement poster, drawn as a circle. In practice it is often run as a line: plan, do, and stop. This issue follows the cycle from Shewhart to Deming and asks what it takes to go round more than once. It closes the second series.
- 03Cover storyFrom a line to a circle
- 04The numbersOne cycle, then stop
- 05The modelCheck or study
- 06What the research saysSuccess reported, method missing
- 07How it is measuredDid the cycle close?
- 08Tool of the issueThe PDSA cycle card
- 09SourcesSources and method
How to read this issue
Figure
Every figure has its source and year at the foot of its page.
Our reading
Where the editors interpret rather than the research, it says so.
Practice
The steps and the card are proposals to try, not research results.
Cover story
From a linet o a circle
In 1938 Walter Shewhart of Bell Telephone Laboratories lectured to the US Department of Agriculture's Graduate School; in 1939 the lectures became a book, with W. Edwards Deming as editorial assistant. Quality control, he wrote, has three steps: specification, production, inspection.
Run as a straight line, the steps end at inspection, with a verdict on the product. Shewhart drew them as a circle: what inspection finds goes back into the next specification.
- 1939Shewhart: specification, production, inspection, as a circle.
- 1950Deming in Japan: design, make, sell, test in service, redesign: the “Deming wheel”.
- 1951Japanese executives recast the wheel as Plan, Do, Check, Act.
- 1993Deming: Plan, Do, Study, Act, “the Shewhart cycle for learning and improvement”.
Our reading
A line ends with a verdict on the product. A circle ends with a question for the next round.
Sources: Walter A. Shewhart, Graduate School of the US Department of Agriculture, 1939 (via Summaries of Moen & Norman (2010)); Ronald Moen & Clifford Norman, Quality Progress, 2010; W. Edwards Deming, MIT Center for Advanced Engineering Study, 1993 (via The W. Edwards Deming Institute, "PDSA Cycle")
The history follows Moen & Norman (2010); Shewhart's book was not seen. The 1950 steps are Deming's, shortened, from an eight-day seminar of the JUSE. Who recast them in 1951 is Masaaki Imai's account.
The numbers
One cycle,then st op
Taylor, Reed and colleagues searched the healthcare literature for reports of improvement work that said it used PDSA. Of 409 articles, 73 met their criteria; 47 described their cycles in enough detail to be checked against the method.
The 47 reports that described their cycles (2014)
Of all 73 reports, fewer than one in five fully documented a sequence of linked cycles. Only two met all five principles of the method; four of the 47 stated a prediction before the test.
Our reading
Most teams called it a cycle and ran it once. One round is a trial, not a cycle.
Source: Michael J. Taylor et al., BMJ Quality & Safety 23(4), 2014
Published reports may describe the work less fully than it was done. The bars count reports, not teams. Read in the full text of the review.
The model
Checkor study
Deming never fully embraced PDCA. In The New Economics (1993) his cycle is Plan, Do, Study, Act. The Japanese PDCA went another way: Kaoru Ishikawa (1985) made it six steps, with more in plan and do.
PDCA, Ishikawa (1985)
- Set goals and targets
- Decide the methods
- Educate and train
- Do the work
- Check the effects
- Take action
PDSA, Deming (1993)
- Plan a change or a test
- Do it, preferably small
- Study: what did we learn?
- Act: adopt, abandon, or go again
Check, says the Deming Institute, asks whether a change worked; study compares the results with a prediction and may revise the theory. In 1990 Deming wrote to Ronald Moen:
“Be sure to call it PDSA, not the corruption PDCA.”
Our reading
Check asks: did we do it? Study asks: were we right, and what do we believe now?
Sources: Kaoru Ishikawa, translated by David J. Lu, Prentice-Hall, 1985 (via University of Cambridge, Institute for Manufacturing); W. Edwards Deming, MIT Center for Advanced Engineering Study, 1993 (via The W. Edwards Deming Institute, "PDSA Cycle"); Ronald Moen & Clifford Norman, Quality Progress, 2010
Ishikawa via the University of Cambridge; Deming's 1993 steps and his letter as Moen & Norman (2010) give them, check and study via the Deming Institute. The Model for Improvement is in No. 69.
What the research says
Success repor ted,me thod missing
Knudsen and colleagues at Aalborg University reviewed 120 improvement projects that used PDSA and were published in peer-reviewed journals in 2015 and 2016.
PDSA projects published in 2015–2016 (2019)
The four features were iterative cycles, data collected over time, testing on a small scale first, and a stated rationale for the change. Only 72 projects described their cycles well enough to be judged; three of them had all four. The authors see a challenge to the legitimacy of PDSA-based improvement.
Our reading
When almost every project succeeds on paper, the success says little. How the cycles were run says more.
Source: Søren Valgreen Knudsen, Henrik Vitus Bering Laursen, Søren Paaske Johnsen et al., BMC Health Services Research 19, 2019
Results as the projects reported them; journals favour success. 98% and 27% are of all 120 projects, 4% of the 72 that could be judged. Read in the full text of the review.
How it is measured
Did the cycleclose?
The two reviews judged the reports by a few marks. A team can apply the same marks to its own cycles, before anyone counts the result.
Prediction written first
What we expect, and why, noted before the test starts.
Small first, then larger
One shift or one area before the whole site; scale grows with confidence.
Data over time
The measure at regular points, not one before and one after.
The next cycle linked
Each cycle starts from what the last one taught.
Act recorded
Adopted as the standard, adapted or dropped, and who checks that it holds.
Our reading
A cycle closes when Act changes the standard and someone keeps checking it. Otherwise the gain lasts as long as the attention.
Sources: Michael J. Taylor et al., BMJ Quality & Safety 23(4), 2014; Søren Valgreen Knudsen, Henrik Vitus Bering Laursen, Søren Paaske Johnsen et al., BMC Health Services Research 19, 2019
The first four marks follow Taylor et al. (2014) and Knudsen et al. (2019); the last mark and the selection are the editors'. Standard work and kaizen are in No. 35.
More in the essayWhen improvement fades
Tool of the issue
The PDSAcycle card
One card per cycle, filled in with the people who will run the test. Study needs data over time: a control chart shows whether a change in the numbers is a signal or noise.
01The changeone change, and the problem it should solve
02Predictionwhich measure moves, by about how much, and why
03The testwhere, who, how long; smaller than the whole area
04What happenedthe measure at regular points, and anything unplanned
05Studyresults against the prediction: what did we learn?
06Actadopt as standard, adapt or abandon; who checks it holds; date of the next cycle
Sources: W. Edwards Deming, MIT Center for Advanced Engineering Study, 1993 (via The W. Edwards Deming Institute, "PDSA Cycle"); Michael J. Taylor et al., BMJ Quality & Safety 23(4), 2014; Søren Valgreen Knudsen, Henrik Vitus Bering Laursen, Søren Paaske Johnsen et al., BMC Health Services Research 19, 2019
A practice proposed by the editors, after Deming's PDSA steps and the marks used by Taylor et al. (2014) and Knudsen et al. (2019).
Open the tool: Sigma & Control Chartstivencatalyst.com/tools/sigma-control-chart/
Sources and method
Every figurehas a source.
The figures in this issue come from the sources below. The year shows how recent each one is.
- Statistical Method from the Viewpoint of Quality ControlWalter A. Shewhart, Graduate School of the US Department of Agriculture, 1939 · via Summaries of Moen & Norman (2010)https://ageconsearch.umn.edu/record/327285
- Circling Back: Clearing up myths about the Deming cycle and seeing how it keeps evolvingRonald Moen & Clifford Norman, Quality Progress, 2010https://qi.elft.nhs.uk/resource/circling-back-article
- What Is Total Quality Control? The Japanese WayKaoru Ishikawa, translated by David J. Lu, Prentice-Hall, 1985 · via University of Cambridge, Institute for Manufacturinghttps://www.ifm.eng.cam.ac.uk/research/dstools/pdca/
- The New Economics for Industry, Government, EducationW. Edwards Deming, MIT Center for Advanced Engineering Study, 1993 · via The W. Edwards Deming Institute, "PDSA Cycle"https://deming.org/explore/pdsa/
- Systematic review of the application of the plan–do–study–act method to improve quality in healthcareMichael J. Taylor et al., BMJ Quality & Safety 23(4), 2014https://doi.org/10.1136/bmjqs-2013-001862
- Can quality improvement improve the quality of care? A systematic review of reported effects and methodological rigor in plan-do-study-act projectsSøren Valgreen Knudsen, Henrik Vitus Bering Laursen, Søren Paaske Johnsen et al., BMC Health Services Research 19, 2019https://doi.org/10.1186/s12913-019-4482-6
Editorial method
Each figure was checked for its year, its publisher and what exactly it measures. Where the publisher's page could not be opened, the figure was checked against independent summaries and is marked “via”. The editors' interpretation is marked “Our reading”. Figures that could not be confirmed are not in the issue.
ManagementReview
Management without theatre.
Every issue, one management question, checked against the best research.
All issues
stivencatalyst.com/magazine/management-review.html
Management Review · No. 80 · November 2026 · Stiven Catalyst
Click or swipe a page to turn it. The arrow keys work too.
Management Review · No. 80
The figures of the issue
The charts of the printed pages, with their sources.
Source: Michael J. Taylor et al., BMJ Quality & Safety 23(4), 2014
Source: Søren Valgreen Knudsen, Henrik Vitus Bering Laursen, Søren Paaske Johnsen et al., BMC Health Services Research 19, 2019
The whole text Read the issue as text For reading on a small screen, searching or a screen reader. The same words, without the page design.
In this issue
PDCA is on almost every improvement poster, drawn as a circle. In practice it is often run as a line: plan, do, and stop. This issue follows the cycle from Shewhart to Deming and asks what it takes to go round more than once. It closes the second series.
In 1939 Walter Shewhart drew specification, production and inspection as a circle, not a line. Deming's lectures in Japan in 1950 became the Deming wheel, and then PDCA; Deming later insisted on PDSA, with study in place of check. In a review of 73 healthcare reports, fewer than one in five documented a sequence of linked cycles. In 120 later projects almost all reported improvement, yet only 4% of those that could be judged applied the method fully. Five marks show whether a cycle closes, and a card helps run one.
Stiven Janaqi, Editor
Cover story
From a line t o a circle
In 1938 Walter Shewhart of Bell Telephone Laboratories lectured to the US Department of Agriculture's Graduate School; in 1939 the lectures became a book, with W. Edwards Deming as editorial assistant. Quality control, he wrote, has three steps: specification, production, inspection.
Run as a straight line, the steps end at inspection, with a verdict on the product. Shewhart drew them as a circle: what inspection finds goes back into the next specification.
- 1939 Shewhart: specification, production, inspection, as a circle.
- 1950 Deming in Japan: design, make, sell, test in service, redesign: the “Deming wheel”.
- 1951 Japanese executives recast the wheel as Plan, Do, Check, Act.
- 1993 Deming: Plan, Do, Study, Act, “the Shewhart cycle for learning and improvement”.
Our reading
A line ends with a verdict on the product. A circle ends with a question for the next round.
The history follows Moen & Norman (2010); Shewhart's book was not seen. The 1950 steps are Deming's, shortened, from an eight-day seminar of the JUSE. Who recast them in 1951 is Masaaki Imai's account.
Sources: Walter A. Shewhart, Graduate School of the US Department of Agriculture, 1939 (via Summaries of Moen & Norman (2010)); Ronald Moen & Clifford Norman, Quality Progress, 2010; W. Edwards Deming, MIT Center for Advanced Engineering Study, 1993 (via The W. Edwards Deming Institute, "PDSA Cycle")
The numbers
One cycle, then st op
Taylor, Reed and colleagues searched the healthcare literature for reports of improvement work that said it used PDSA. Of 409 articles, 73 met their criteria; 47 described their cycles in enough detail to be checked against the method.
The 47 reports that described their cycles (2014): A single cycle 29, Several cycles, not linked 4, A sequence of linked cycles 14, Data at least monthly to guide them 7.
Of all 73 reports, fewer than one in five fully documented a sequence of linked cycles. Only two met all five principles of the method; four of the 47 stated a prediction before the test.
Our reading
Most teams called it a cycle and ran it once. One round is a trial, not a cycle.
Published reports may describe the work less fully than it was done. The bars count reports, not teams. Read in the full text of the review.
Source: Michael J. Taylor et al., BMJ Quality & Safety 23(4), 2014
The model
Check or study
Deming never fully embraced PDCA. In The New Economics (1993) his cycle is Plan, Do, Study, Act. The Japanese PDCA went another way: Kaoru Ishikawa (1985) made it six steps, with more in plan and do.
PDCA, Ishikawa (1985)
- Set goals and targets
- Decide the methods
- Educate and train
- Do the work
- Check the effects
- Take action
PDSA, Deming (1993)
- Plan a change or a test
- Do it, preferably small
- Study: what did we learn?
- Act: adopt, abandon, or go again
Check, says the Deming Institute, asks whether a change worked; study compares the results with a prediction and may revise the theory. In 1990 Deming wrote to Ronald Moen:
Be sure to call it PDSA, not the corruption PDCA.
Our reading
Check asks: did we do it? Study asks: were we right, and what do we believe now?
Ishikawa via the University of Cambridge; Deming's 1993 steps and his letter as Moen & Norman (2010) give them, check and study via the Deming Institute. The Model for Improvement is in No. 69.
Sources: Kaoru Ishikawa, translated by David J. Lu, Prentice-Hall, 1985 (via University of Cambridge, Institute for Manufacturing); W. Edwards Deming, MIT Center for Advanced Engineering Study, 1993 (via The W. Edwards Deming Institute, "PDSA Cycle"); Ronald Moen & Clifford Norman, Quality Progress, 2010
What the research says
Success repor ted, me thod missing
Knudsen and colleagues at Aalborg University reviewed 120 improvement projects that used PDSA and were published in peer-reviewed journals in 2015 and 2016.
PDSA projects published in 2015–2016 (2019): Reported improvement 98%, Reached a set number 27%, All four features 4%.
The four features were iterative cycles, data collected over time, testing on a small scale first, and a stated rationale for the change. Only 72 projects described their cycles well enough to be judged; three of them had all four. The authors see a challenge to the legitimacy of PDSA-based improvement.
Our reading
When almost every project succeeds on paper, the success says little. How the cycles were run says more.
Results as the projects reported them; journals favour success. 98% and 27% are of all 120 projects, 4% of the 72 that could be judged. Read in the full text of the review.
Source: Søren Valgreen Knudsen, Henrik Vitus Bering Laursen, Søren Paaske Johnsen et al., BMC Health Services Research 19, 2019
How it is measured
Did the cycle close?
The two reviews judged the reports by a few marks. A team can apply the same marks to its own cycles, before anyone counts the result.
- Prediction wri
t ten first. What we expect, and why, noted before the test starts. - Small first, then larger. One shift or one area before the whole site; scale grows with confidence.
- Data over time. The measure at regular points, not one before and one after.
- The next cycle linked. Each cycle starts from what the last one taught.
- Act recorded. Adopted as the standard, adapted or dropped, and who checks that it holds.
Our reading
A cycle closes when Act changes the standard and someone keeps checking it. Otherwise the gain lasts as long as the attention.
The first four marks follow Taylor et al. (2014) and Knudsen et al. (2019); the last mark and the selection are the editors'. Standard work and kaizen are in No. 35.
Sources: Michael J. Taylor et al., BMJ Quality & Safety 23(4), 2014; Søren Valgreen Knudsen, Henrik Vitus Bering Laursen, Søren Paaske Johnsen et al., BMC Health Services Research 19, 2019
More in the essay: When improvement fades
Tool of the issue
The PDSA cycle card
One card per cycle, filled in with the people who will run the test. Study needs data over time: a control chart shows whether a change in the numbers is a signal or noise.
- The change one change, and the problem it should solve
- Prediction which measure moves, by about how much, and why
- The test where, who, how long; smaller than the whole area
- What happened the measure at regular points, and anything unplanned
- Study results against the prediction: what did we learn?
- Act adopt as standard, adapt or abandon; who checks it holds; date of the next cycle
A practice proposed by the editors, after Deming's PDSA steps and the marks used by Taylor et al. (2014) and Knudsen et al. (2019).
Sources: W. Edwards Deming, MIT Center for Advanced Engineering Study, 1993 (via The W. Edwards Deming Institute, "PDSA Cycle"); Michael J. Taylor et al., BMJ Quality & Safety 23(4), 2014; Søren Valgreen Knudsen, Henrik Vitus Bering Laursen, Søren Paaske Johnsen et al., BMC Health Services Research 19, 2019
Open the tool: Sigma & Control Chart
Sources and method
Every figure has a source.
The figures in this issue come from the sources below. The year shows how recent each one is.
- Walter A. Shewhart, Graduate School of the US Department of Agriculture, “Statistical Method from the Viewpoint of Quality Control”, 1939 (via Summaries of Moen & Norman (2010)). https://ageconsearch.umn.edu/record/327285
- Ronald Moen & Clifford Norman, Quality Progress, “Circling Back: Clearing up myths about the Deming cycle and seeing how it keeps evolving”, 2010. https://qi.elft.nhs.uk/resource/circling-back-article
- Kaoru Ishikawa, translated by David J. Lu, Prentice-Hall, “What Is Total Quality Control? The Japanese Way”, 1985 (via University of Cambridge, Institute for Manufacturing). https://www.ifm.eng.cam.ac.uk/research/dstools/pdca/
- W. Edwards Deming, MIT Center for Advanced Engineering Study, “The New Economics for Industry, Government, Education”, 1993 (via The W. Edwards Deming Institute, "PDSA Cycle"). https://deming.org/explore/pdsa/
- Michael J. Taylor et al., BMJ Quality & Safety 23(4), “Systematic review of the application of the plan–do–study–act method to improve quality in healthcare”, 2014. https://doi.org/10.1136/bmjqs-2013-001862
- Søren Valgreen Knudsen, Henrik Vitus Bering Laursen, Søren Paaske Johnsen et al., BMC Health Services Research 19, “Can quality improvement improve the quality of care? A systematic review of reported effects and methodological rigor in plan-do-study-act projects”, 2019. https://doi.org/10.1186/s12913-019-4482-6
Edit orial me thod
Each figure was checked for its year, its publisher and what exactly it measures. Where the publisher's page could not be opened, the figure was checked against independent summaries and is marked “via”. The editors' interpretation is marked “Our reading”. Figures that could not be confirmed are not in the issue.
Management Review · Monthly edition