In this issue
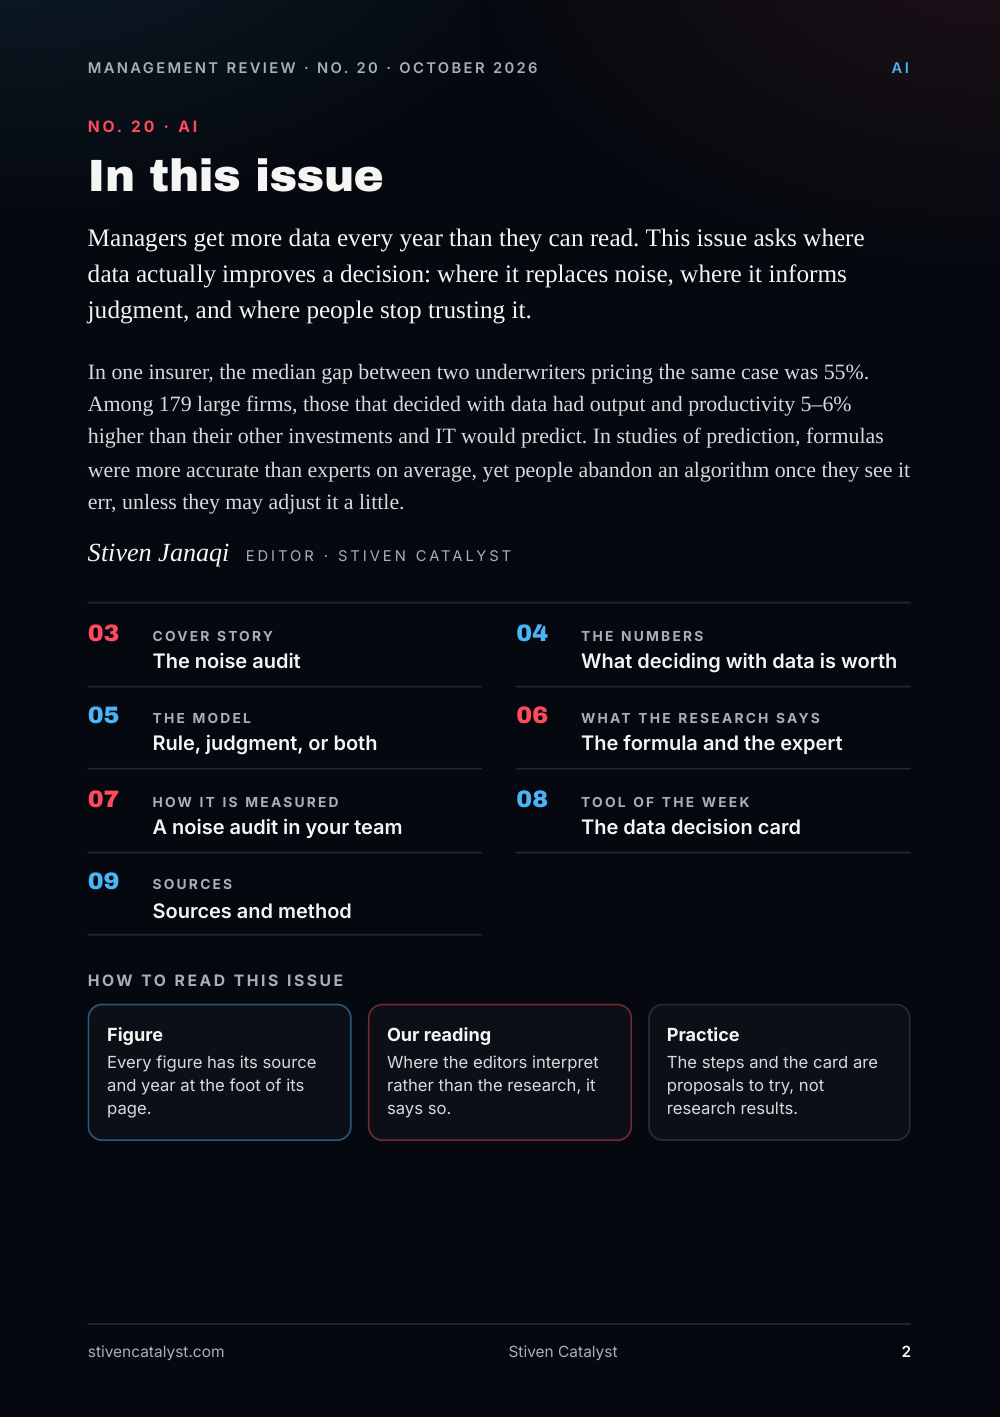
Managers get more data every year than they can read. This issue asks where data actually improves a decision: where it replaces noise, where it informs judgment, and where people stop trusting it.
In one insurer, the median gap between two underwriters pricing the same case was 55%. Among 179 large firms, those that decided with data had output and productivity 5–6% higher than their other investments and IT would predict. In studies of prediction, formulas were more accurate than experts on average, yet people abandon an algorithm once they see it err, unless they may adjust it a little.
Stiven Janaqi, Editor
Cover story
The noise audit
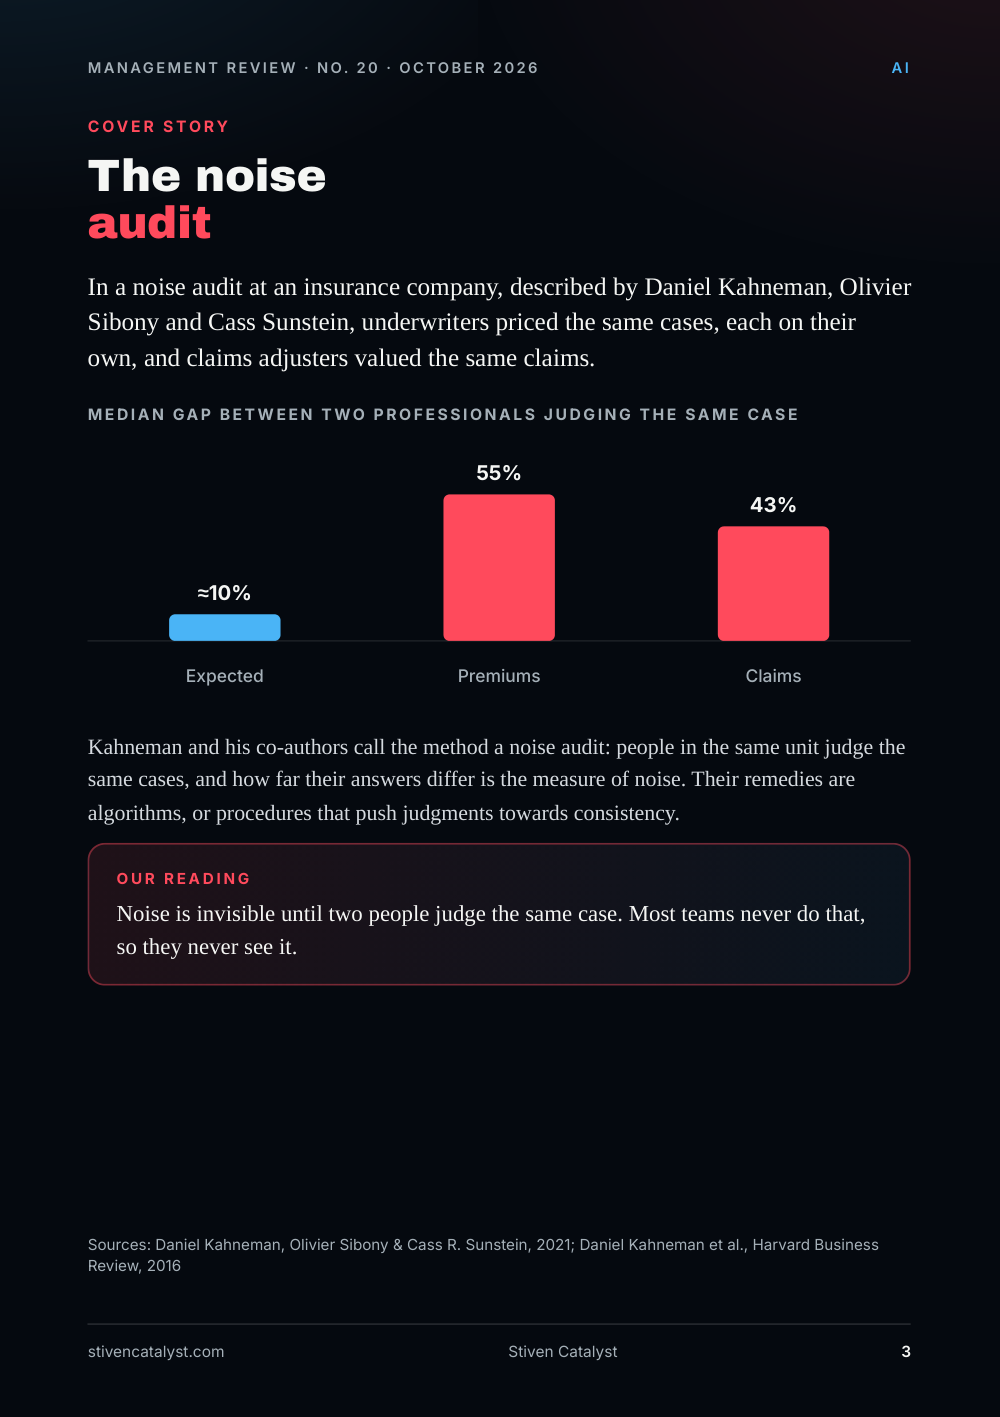
In a noise audit at an insurance company, described by Daniel Kahneman, Olivier Sibony and Cass Sunstein, underwriters priced the same cases, each on their own, and claims adjusters valued the same claims.
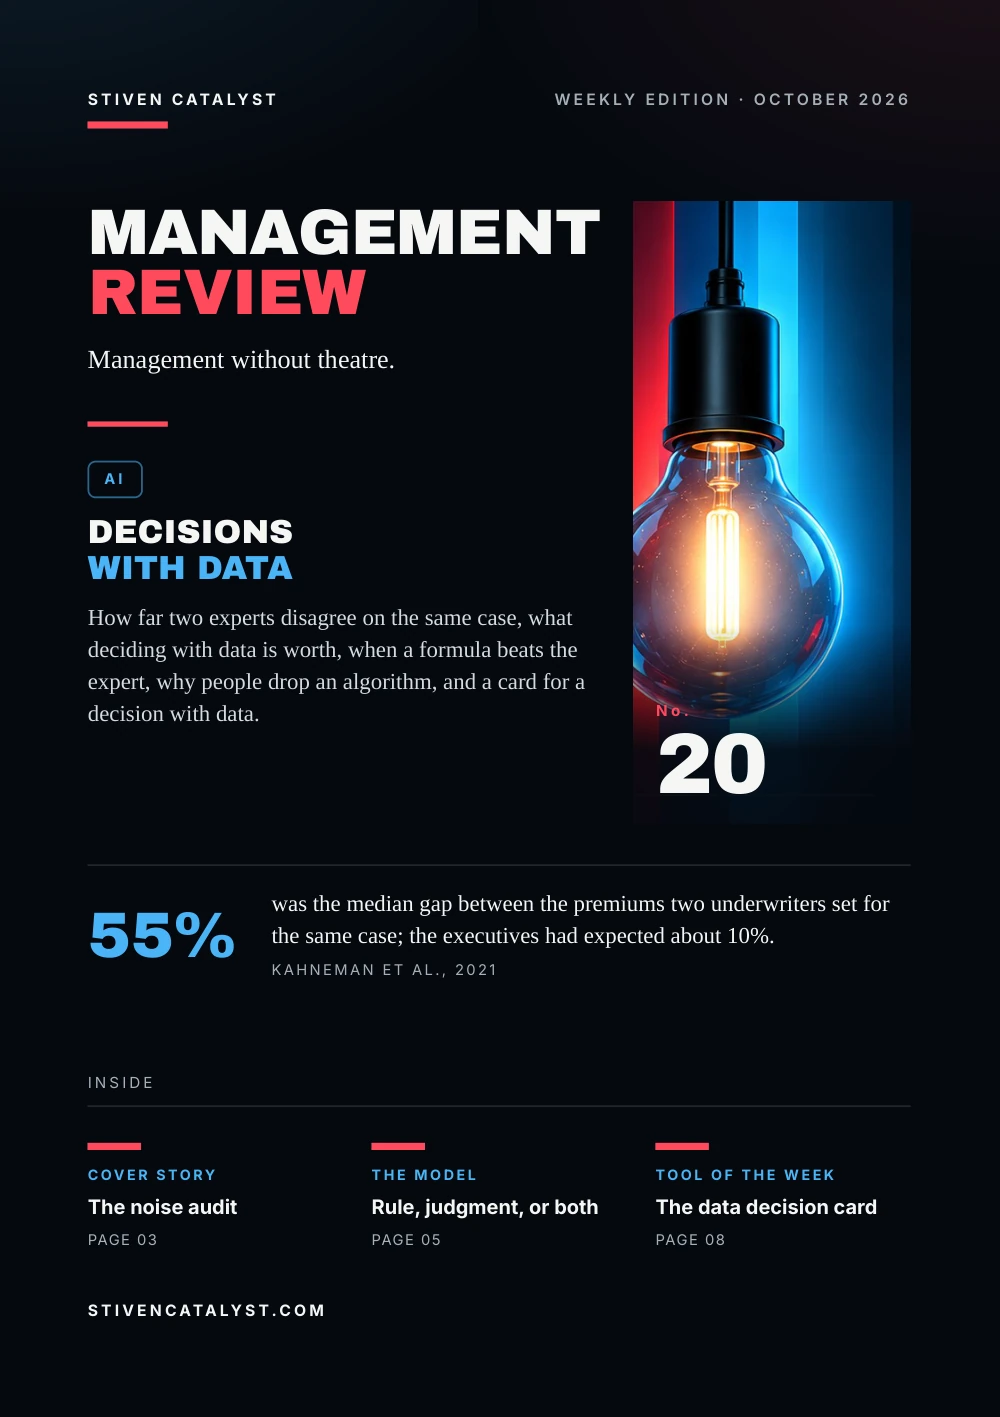
Median gap between two professionals judging the same case: Expected ≈10%, Premiums 55%, Claims 43%.
Kahneman and his co-authors call the method a noise audit: people in the same unit judge the same cases, and how far their answers differ is the measure of noise. Their remedies are algorithms, or procedures that push judgments towards consistency.
Our reading
Noise is invisible until two people judge the same case. Most teams never do that, so they never see it.
Sources: Daniel Kahneman, Olivier Sibony & Cass R. Sunstein, 2021; Daniel Kahneman et al., Harvard Business Review, 2016
The numbers
What deciding with data is wor th
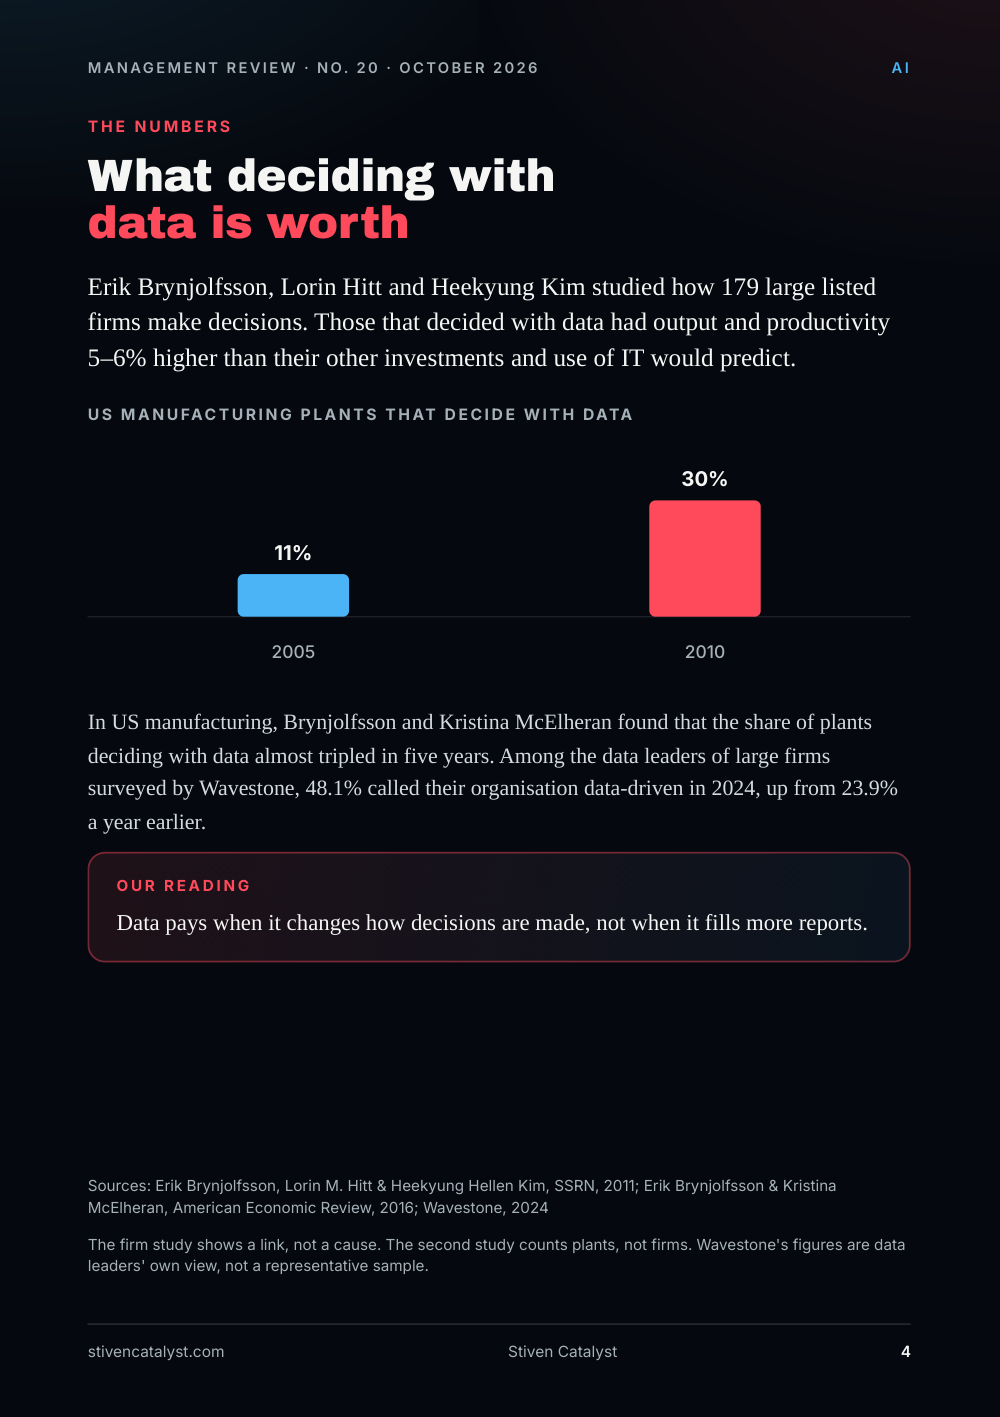
Erik Brynjolfsson, Lorin Hitt and Heekyung Kim studied how 179 large listed firms make decisions. Those that decided with data had output and productivity 5–6% higher than their other investments and use of IT would predict.
US manufacturing plants that decide with data: 2005 11%, 2010 30%.
In US manufacturing, Brynjolfsson and Kristina McElheran found that the share of plants deciding with data almost tripled in five years. Among the data leaders of large firms surveyed by Wavestone, 48.1% called their organisation data-driven in 2024, up from 23.9% a year earlier.
Our reading
Data pays when it changes how decisions are made, not when it fills more reports.
The firm study shows a link, not a cause. The second study counts plants, not firms. Wavestone's figures are data leaders' own view, not a representative sample.
Sources: Erik Brynjolfsson, Lorin M. Hitt & Heekyung Hellen Kim, SSRN, 2011; Erik Brynjolfsson & Kristina McElheran, American Economic Review, 2016; Wavestone, 2024
The model
Rule, judgment, or both
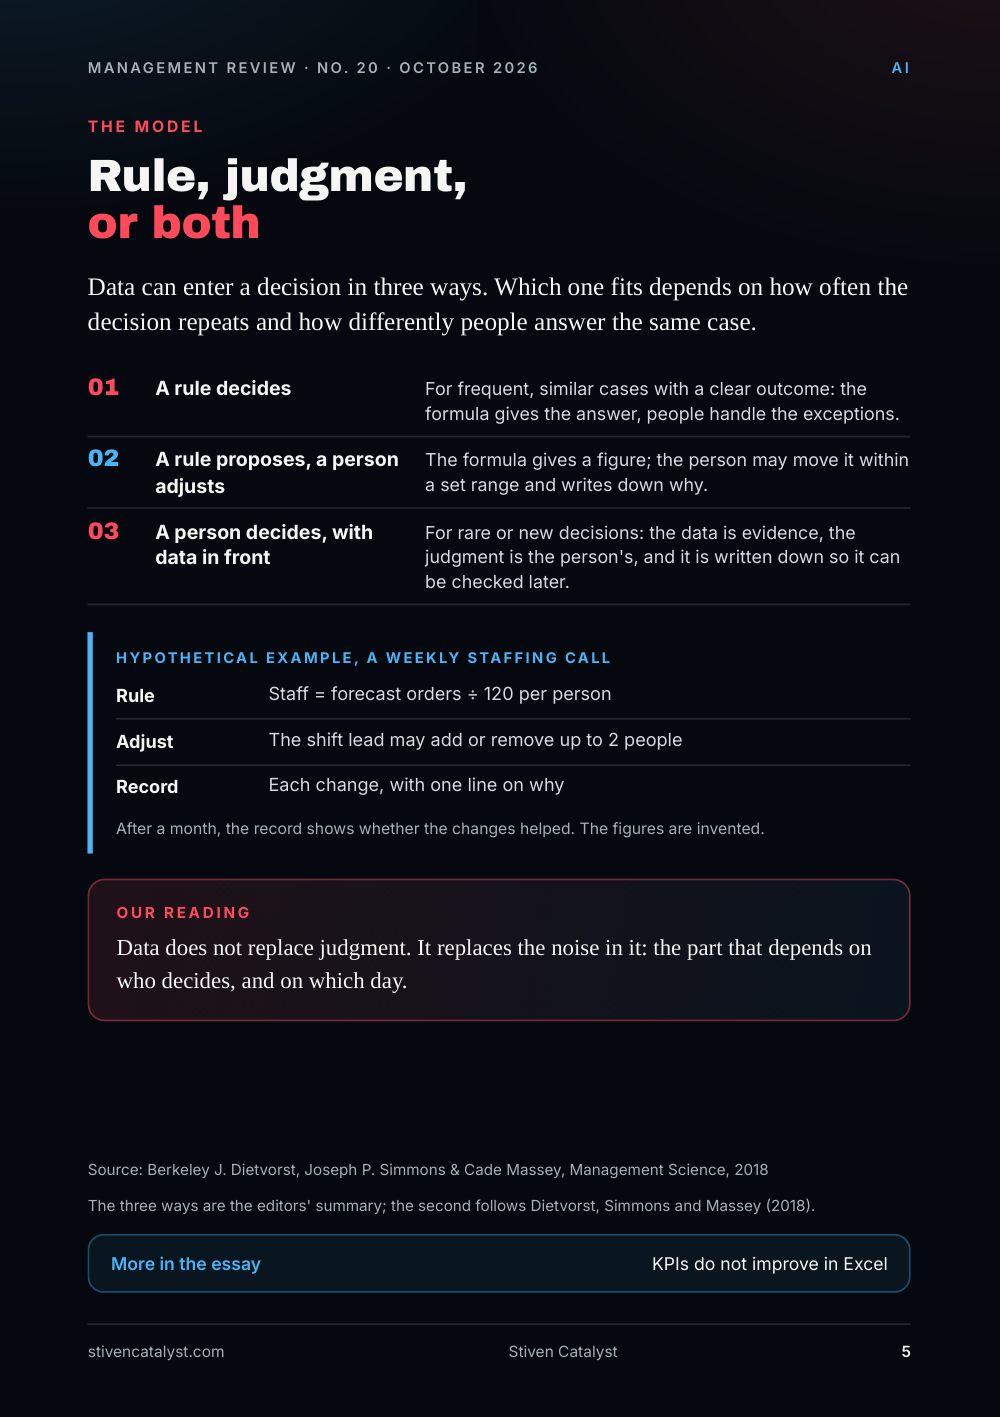
Data can enter a decision in three ways. Which one fits depends on how often the decision repeats and how differently people answer the same case.
- A rule decides. For frequent, similar cases with a clear outcome: the formula gives the answer, people handle the exceptions.
- A rule proposes, a person adjusts. The formula gives a figure; the person may move it within a set range and writes down why.
- A person decides, with data in front. For rare or new decisions: the data is evidence, the judgment is the person's, and it is written down so it can be checked later.
Hypothe tical example, a weekly staffing call
- Rule: Staff = forecast orders ÷ 120 per person
- Adjust: The shift lead may add or remove up to 2 people
- Record: Each change, with one line on why
After a month, the record shows whether the changes helped. The figures are invented.
Our reading
Data does not replace judgment. It replaces the noise in it: the part that depends on who decides, and on which day.
The three ways are the editors' summary; the second follows Dietvorst, Simmons and Massey (2018).
Source: Berkeley J. Dietvorst, Joseph P. Simmons & Cade Massey, Management Science, 2018
More in the essay: KPIs do not improve in Excel
What the research says
The formula and the exper t
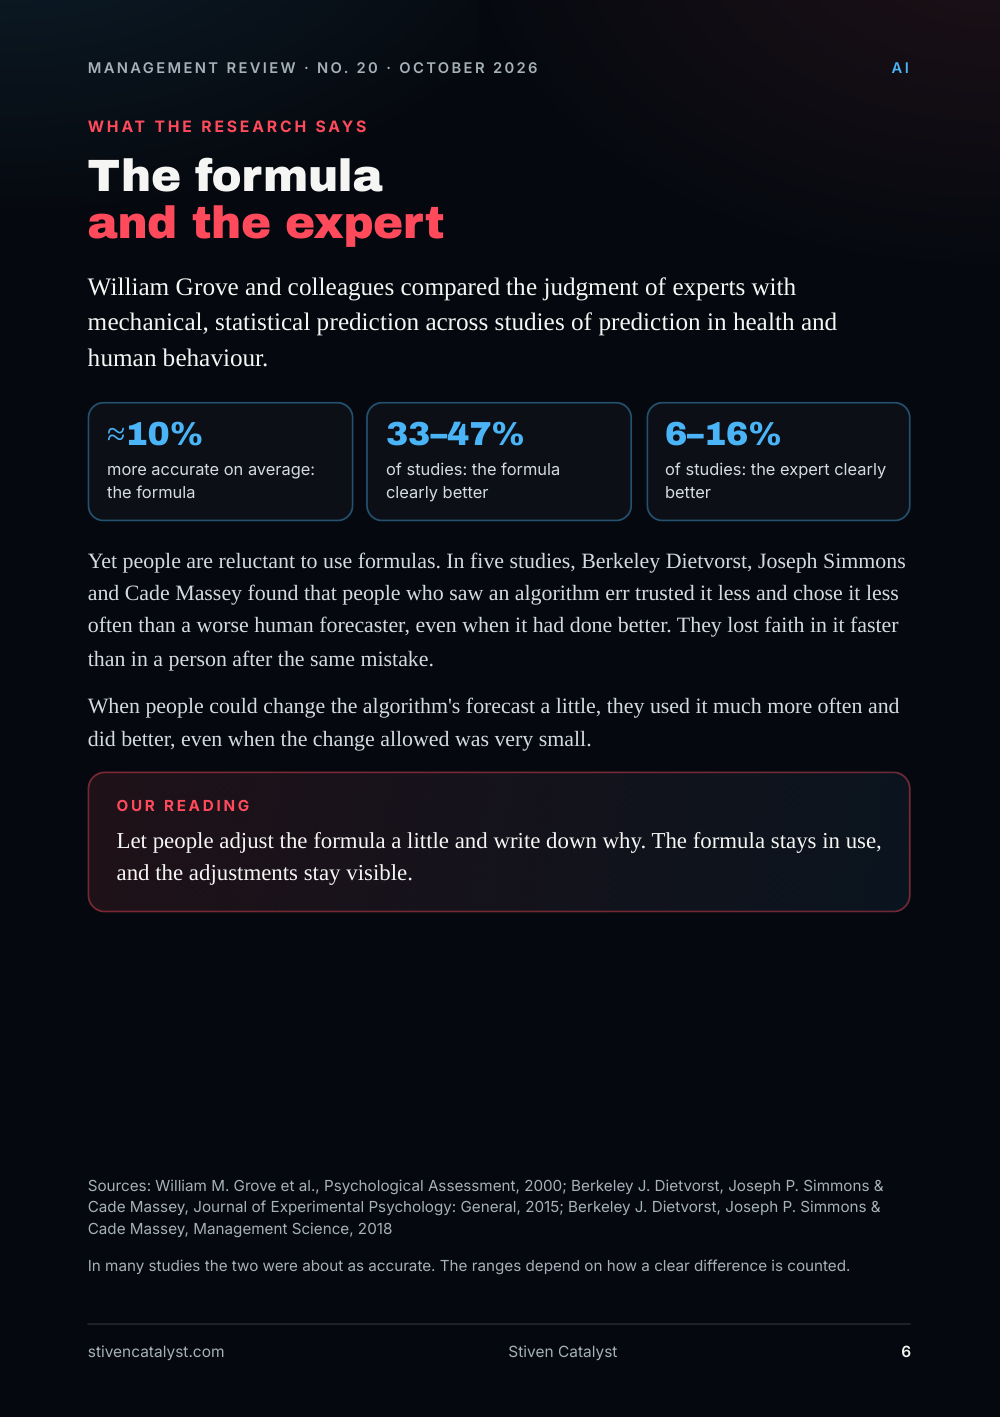
William Grove and colleagues compared the judgment of experts with mechanical, statistical prediction across studies of prediction in health and human behaviour.
- ≈10% more accurate on average: the formula
- 33–47% of studies: the formula clearly better
- 6–16% of studies: the expert clearly better
Yet people are reluctant to use formulas. In five studies, Berkeley Dietvorst, Joseph Simmons and Cade Massey found that people who saw an algorithm err trusted it less and chose it less often than a worse human forecaster, even when it had done better. They lost faith in it faster than in a person after the same mistake.
When people could change the algorithm's forecast a little, they used it much more often and did better, even when the change allowed was very small.
Our reading
Let people adjust the formula a little and write down why. The formula stays in use, and the adjustments stay visible.
In many studies the two were about as accurate. The ranges depend on how a clear difference is counted.
Sources: William M. Grove et al., Psychological Assessment, 2000; Berkeley J. Dietvorst, Joseph P. Simmons & Cade Massey, Journal of Experimental Psychology: General, 2015; Berkeley J. Dietvorst, Joseph P. Simmons & Cade Massey, Management Science, 2018
How it is measured
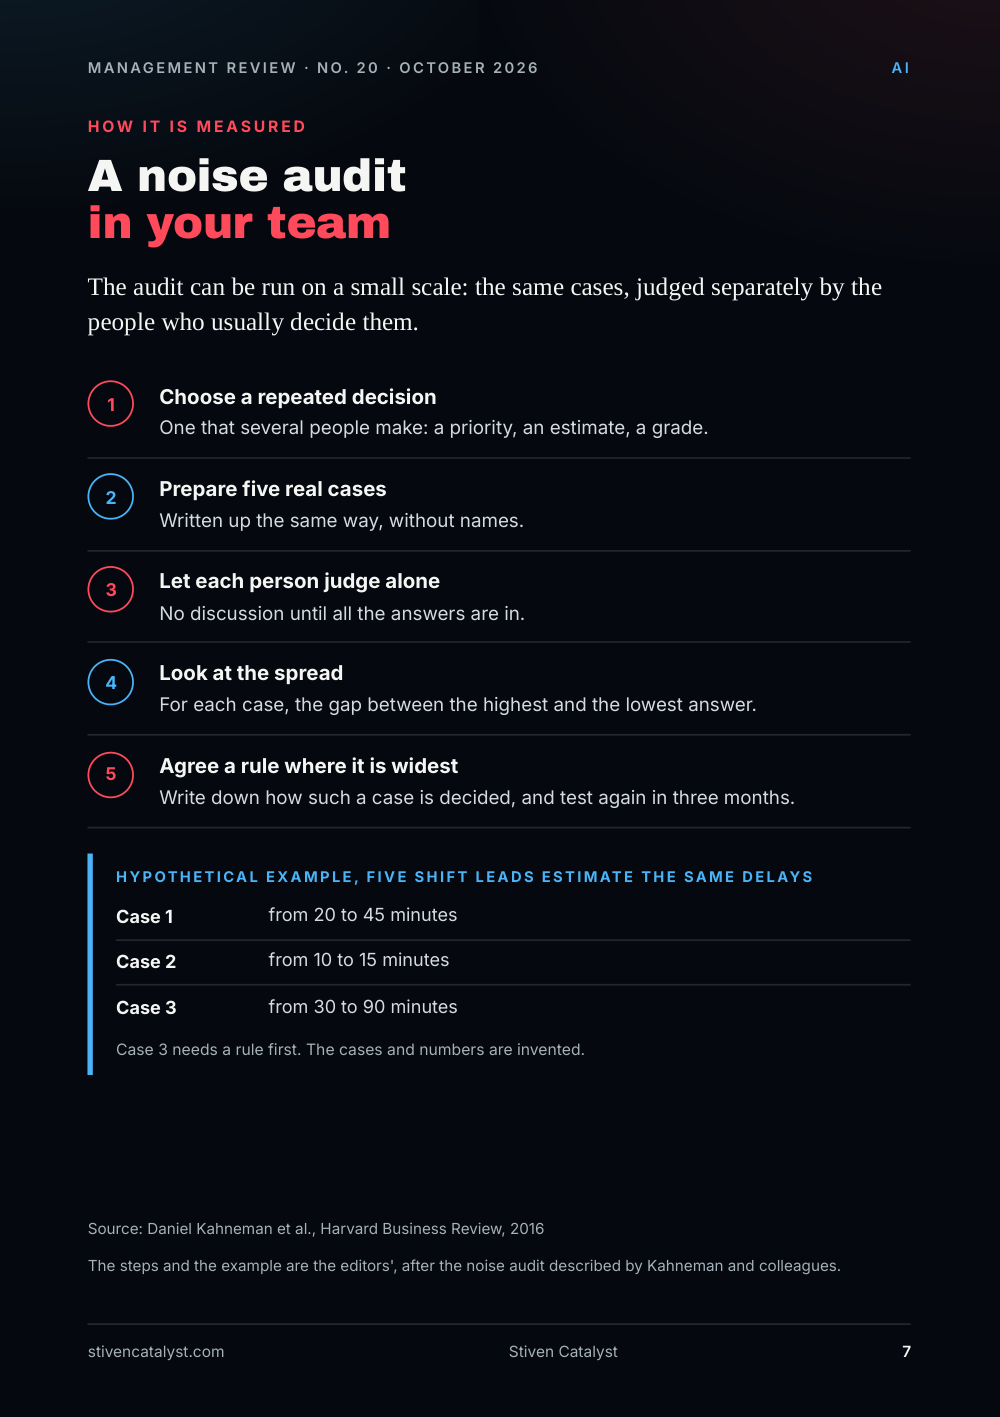
A noise audit in your team
The audit can be run on a small scale: the same cases, judged separately by the people who usually decide them.
- Choose a repeated decision. One that several people make: a priority, an estimate, a grade.
- Prepare five real cases. Written up the same way, without names.
- L
e t each person judge alone. No discussion until all the answers are in. - Look at the spread. For each case, the gap between the highest and the lowest answer.
- Agree a rule where it is widest. Write down how such a case is decided, and test again in three months.
Hypothe tical example, five shif t leads estimate the same delays
- Case 1: from 20 to 45 minutes
- Case 2: from 10 to 15 minutes
- Case 3: from 30 to 90 minutes
Case 3 needs a rule first. The cases and numbers are invented.
The steps and the example are the editors', after the noise audit described by Kahneman and colleagues.
Source: Daniel Kahneman et al., Harvard Business Review, 2016
Tool of the week
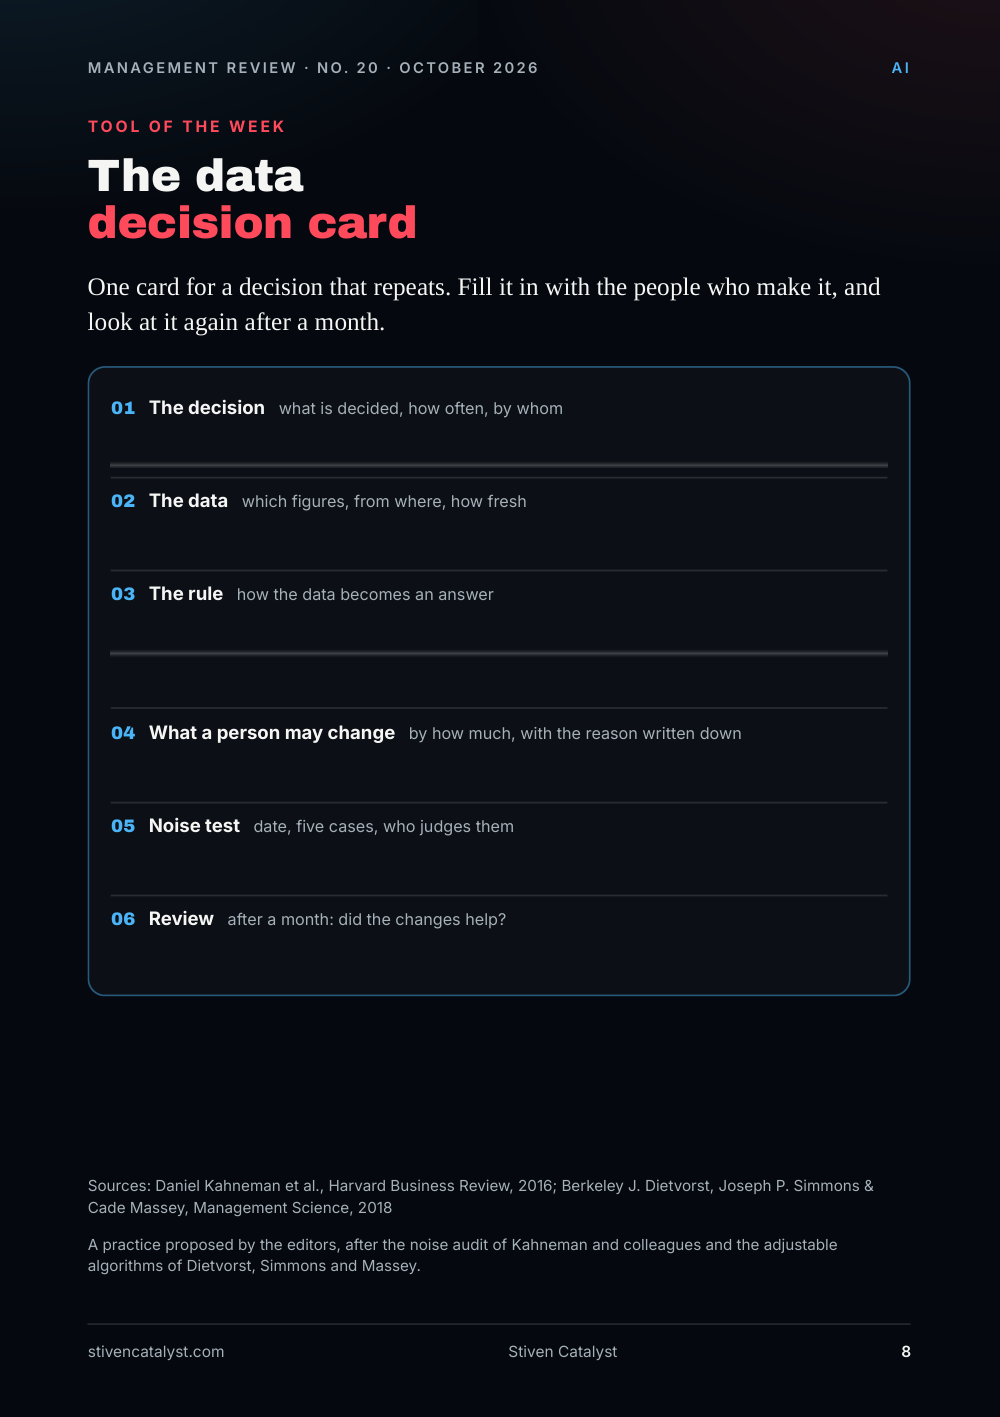
The data decision card
One card for a decision that repeats. Fill it in with the people who make it, and look at it again after a month.
- The decision what is decided, how often, by whom
- The data which figures, from where, how fresh
- The rule how the data becomes an answer
- What a person may change by how much, with the reason written down
- Noise test date, five cases, who judges them
- Review after a month: did the changes help?
A practice proposed by the editors, after the noise audit of Kahneman and colleagues and the adjustable algorithms of Dietvorst, Simmons and Massey.
Sources: Daniel Kahneman et al., Harvard Business Review, 2016; Berkeley J. Dietvorst, Joseph P. Simmons & Cade Massey, Management Science, 2018
Sources and method
Every figure has a source.
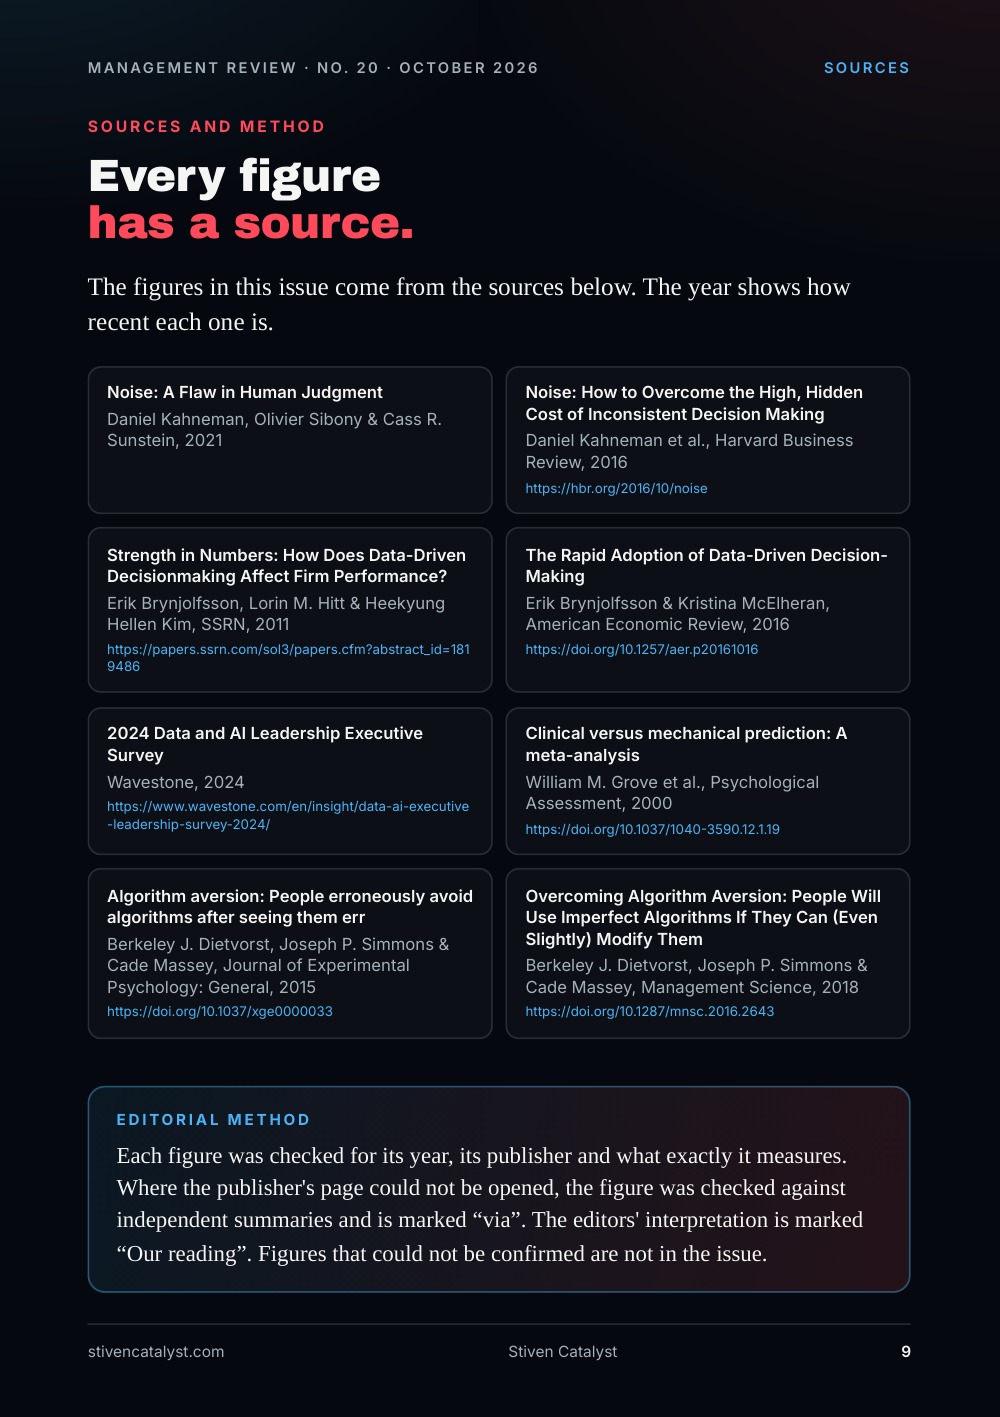
The figures in this issue come from the sources below. The year shows how recent each one is.
- Daniel Kahneman, Olivier Sibony & Cass R. Sunstein, “Noise: A Flaw in Human Judgment”, 2021.
- Daniel Kahneman et al., Harvard Business Review, “Noise: How to Overcome the High, Hidden Cost of Inconsistent Decision Making”, 2016. https://hbr.org/2016/10/noise
- Erik Brynjolfsson, Lorin M. Hitt & Heekyung Hellen Kim, SSRN, “Strength in Numbers: How Does Data-Driven Decisionmaking Affect Firm Performance?”, 2011. https://papers.ssrn.com/sol3/papers.cfm?abstract_id=1819486
- Erik Brynjolfsson & Kristina McElheran, American Economic Review, “The Rapid Adoption of Data-Driven Decision-Making”, 2016. https://doi.org/10.1257/aer.p20161016
- Wavestone, “2024 Data and AI Leadership Executive Survey”, 2024. https://www.wavestone.com/en/insight/data-ai-executive-leadership-survey-2024/
- William M. Grove et al., Psychological Assessment, “Clinical versus mechanical prediction: A meta-analysis”, 2000. https://doi.org/10.1037/1040-3590.12.1.19
- Berkeley J. Dietvorst, Joseph P. Simmons & Cade Massey, Journal of Experimental Psychology: General, “Algorithm aversion: People erroneously avoid algorithms after seeing them err”, 2015. https://doi.org/10.1037/xge0000033
- Berkeley J. Dietvorst, Joseph P. Simmons & Cade Massey, Management Science, “Overcoming Algorithm Aversion: People Will Use Imperfect Algorithms If They Can (Even Slightly) Modify Them”, 2018. https://doi.org/10.1287/mnsc.2016.2643
Edit orial me thod
Each figure was checked for its year, its publisher and what exactly it measures. Where the publisher's page could not be opened, the figure was checked against independent summaries and is marked “via”. The editors' interpretation is marked “Our reading”. Figures that could not be confirmed are not in the issue.