In this issue
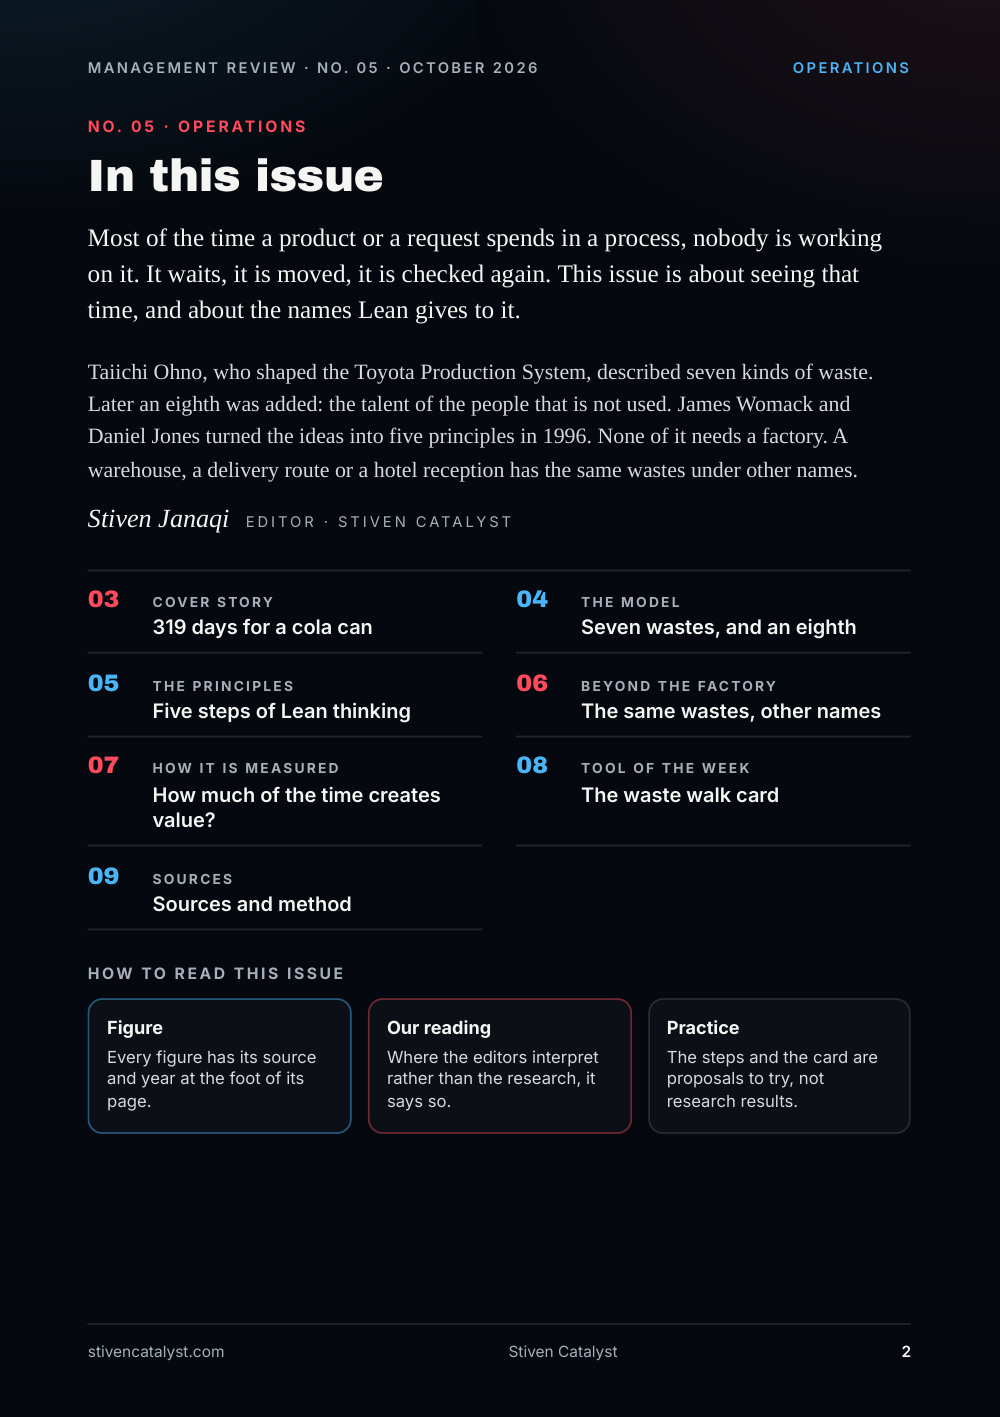
Most of the time a product or a request spends in a process, nobody is working on it. It waits, it is moved, it is checked again. This issue is about seeing that time, and about the names Lean gives to it.
Taiichi Ohno, who shaped the Toyota Production System, described seven kinds of waste. Later an eighth was added: the talent of the people that is not used. James Womack and Daniel Jones turned the ideas into five principles in 1996. None of it needs a factory. A warehouse, a delivery route or a hotel reception has the same wastes under other names.
Stiven Janaqi, Editor
Cover story
319 days for a cola can
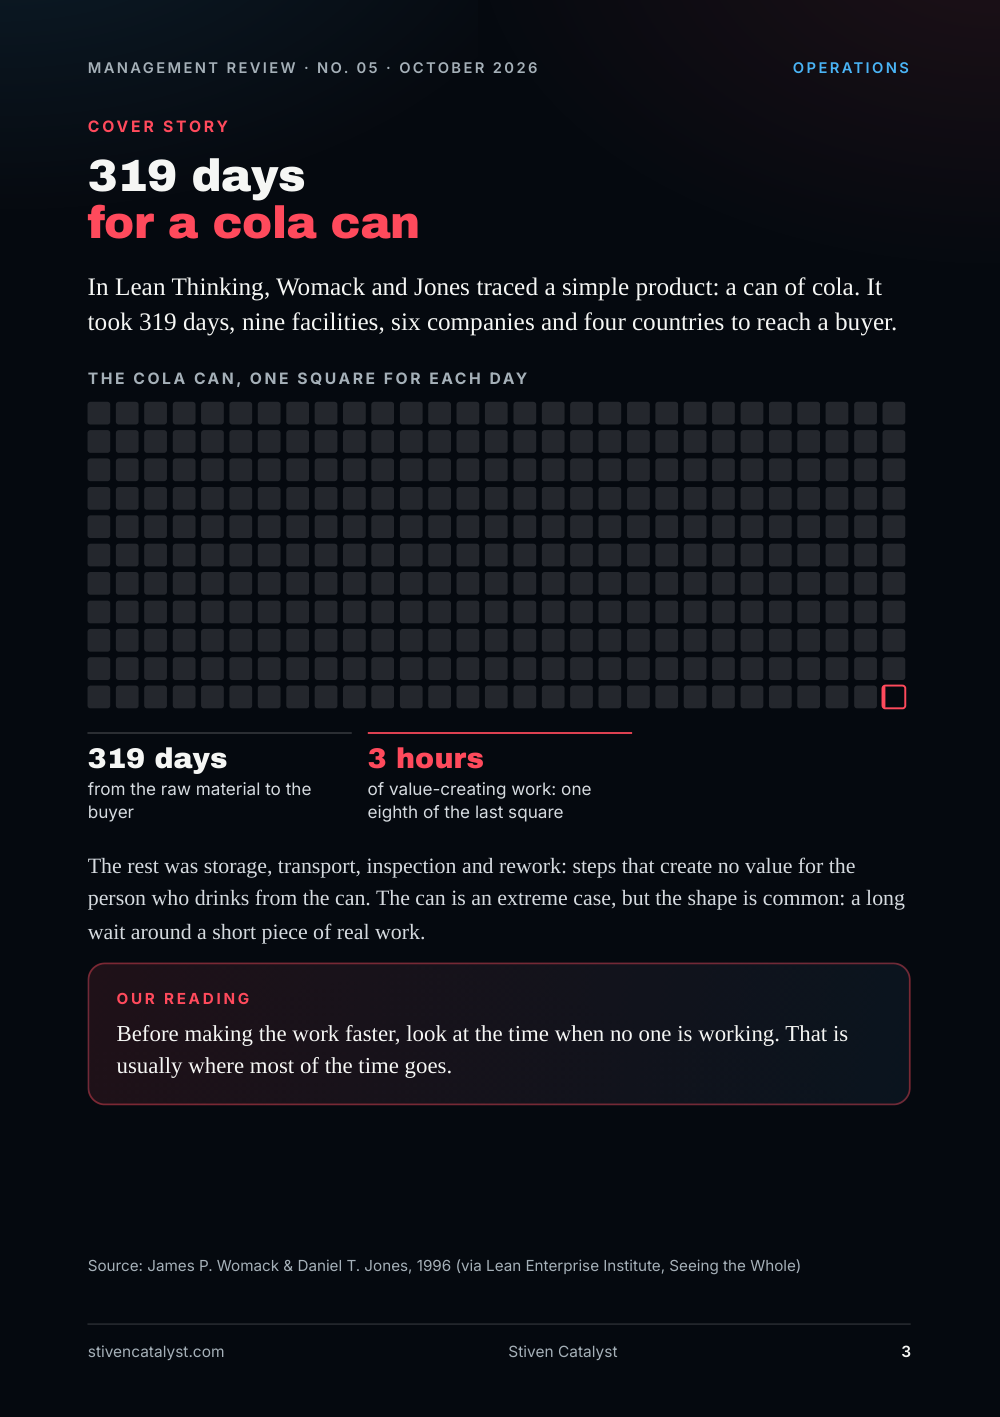
In Lean Thinking, Womack and Jones traced a simple product: a can of cola. It took 319 days, nine facilities, six companies and four countries to reach a buyer.
The cola can, one square for each day: 319 days from the raw material to the buyer, 3 hours of value-creating work: one eighth of the last square.
The rest was storage, transport, inspection and rework: steps that create no value for the person who drinks from the can. The can is an extreme case, but the shape is common: a long wait around a short piece of real work.
Our reading
Before making the work faster, look at the time when no one is working. That is usually where most of the time goes.
Source: James P. Womack & Daniel T. Jones, 1996 (via Lean Enterprise Institute, Seeing the Whole)
The model
Seven wastes, and an eighth
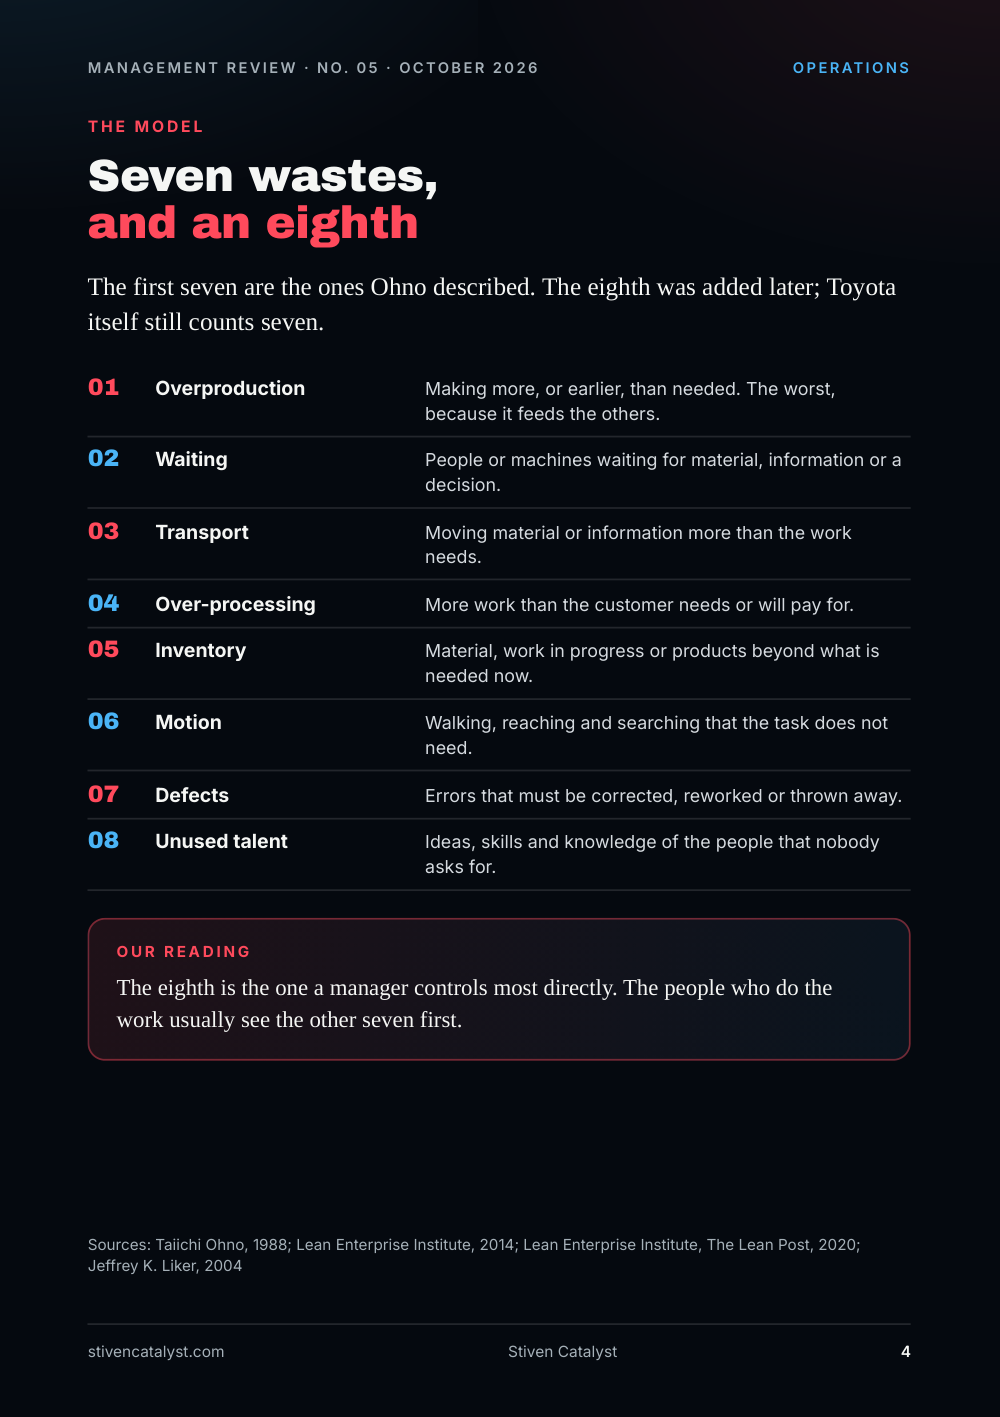
The first seven are the ones Ohno described. The eighth was added later; Toyota itself still counts seven.
- 01: Overproduction. Making more, or earlier, than needed. The worst, because it feeds the others.
- 02: Waiting. People or machines waiting for material, information or a decision.
- 03: Transpo
r t. Moving material or information more than the work needs. - 04: Over-processing. More work than the customer needs or will pay for.
- 05: Inven
t ory. Material, work in progress or products beyond what is needed now. - 06: Motion. Walking, reaching and searching that the task does not need.
- 07: Defects. Errors that must be corrected, reworked or thrown away.
- 08: Unused talent. Ideas, skills and knowledge of the people that nobody asks for.
Our reading
The eighth is the one a manager controls most directly. The people who do the work usually see the other seven first.
Sources: Taiichi Ohno, 1988; Lean Enterprise Institute, 2014; Lean Enterprise Institute, The Lean Post, 2020; Jeffrey K. Liker, 2004
The principles
Five steps of Lean thinking
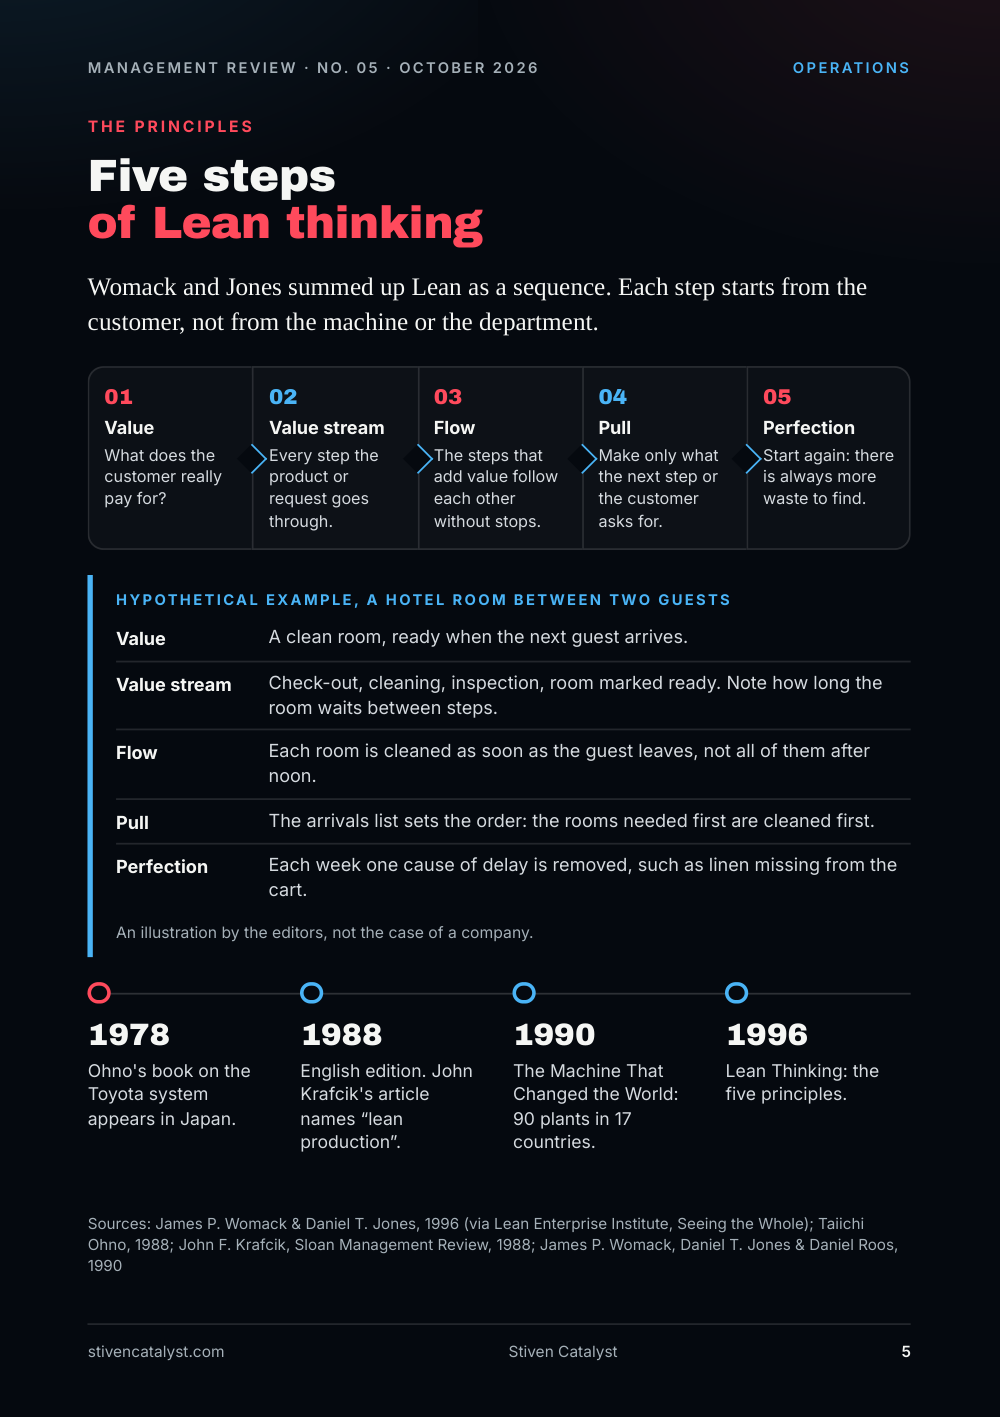
Womack and Jones summed up Lean as a sequence. Each step starts from the customer, not from the machine or the department.
- Value. What does the customer really pay for?
- Value stream. Every step the product or request goes through.
- Flow. The steps that add value follow each other without stops.
- Pull. Make only what the next step or the customer asks for.
- Perfection. Start again: there is always more waste to find.
Hypothe tical example, a hotel room be tween two guests
- Value: A clean room, ready when the next guest arrives.
- Value stream: Check-out, cleaning, inspection, room marked ready. Note how long the room waits between steps.
- Flow: Each room is cleaned as soon as the guest leaves, not all of them after noon.
- Pull: The arrivals list sets the order: the rooms needed first are cleaned first.
- Perfection: Each week one cause of delay is removed, such as linen missing from the cart.
An illustration by the editors, not the case of a company.
- 1978 Ohno's book on the Toyota system appears in Japan.
- 1988 English edition. John Krafcik's article names “lean production”.
- 1990 The Machine That Changed the World: 90 plants in 17 countries.
- 1996 Lean Thinking: the five principles.
Sources: James P. Womack & Daniel T. Jones, 1996 (via Lean Enterprise Institute, Seeing the Whole); Taiichi Ohno, 1988; John F. Krafcik, Sloan Management Review, 1988; James P. Womack, Daniel T. Jones & Daniel Roos, 1990
Beyond the factory
The same wastes, other names
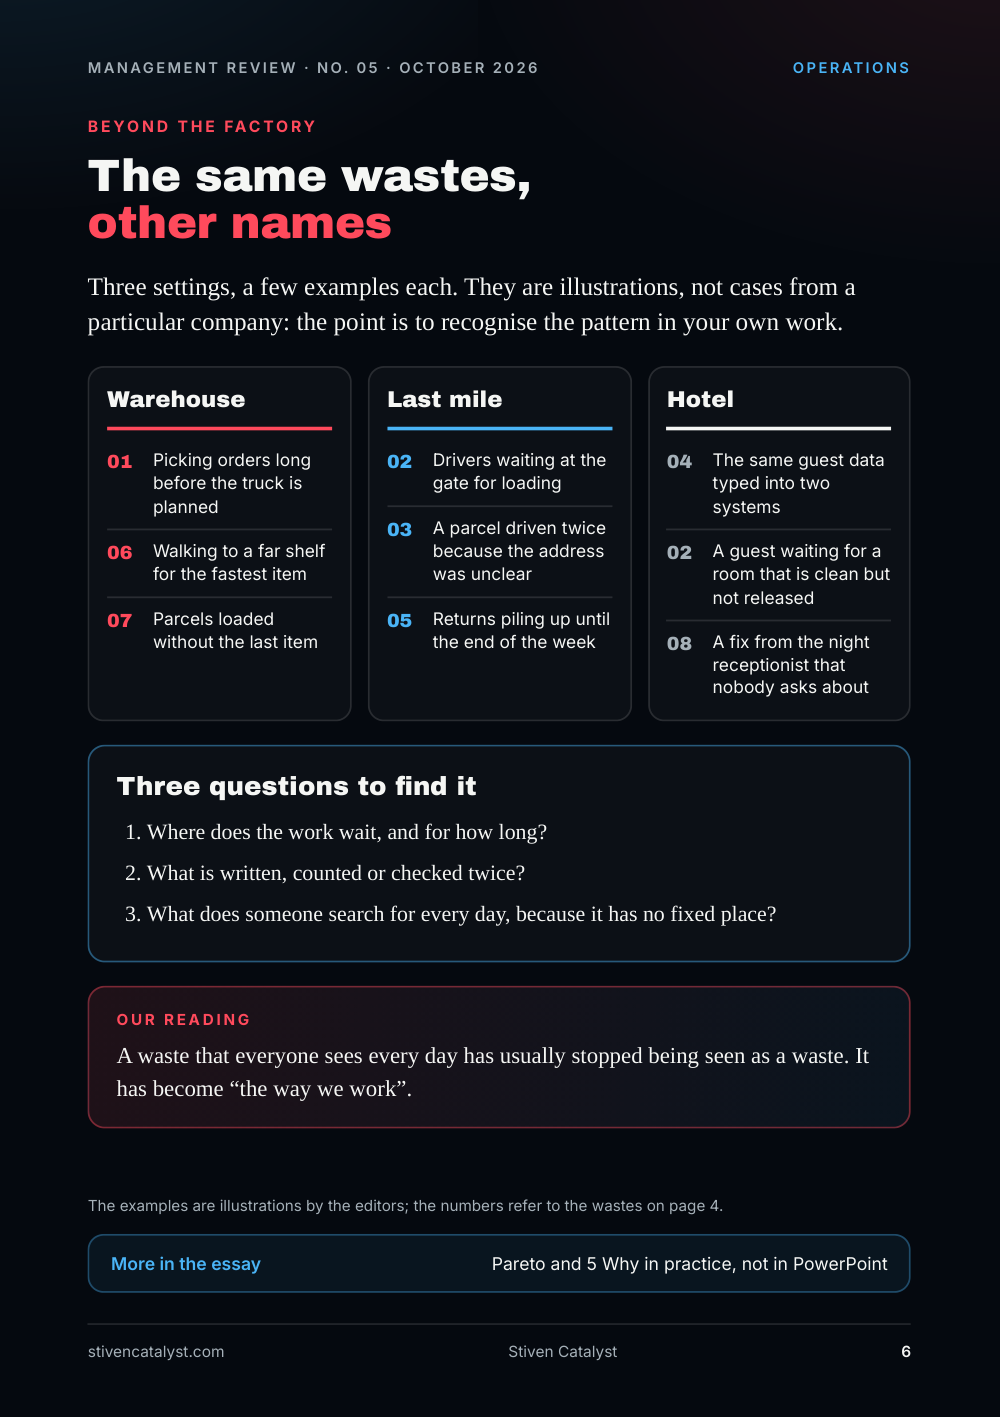
Three settings, a few examples each. They are illustrations, not cases from a particular company: the point is to recognise the pattern in your own work.
Warehouse
- 01. Picking orders long before the truck is planned
- 06. Walking to a far shelf for the fastest item
- 07. Parcels loaded without the last item
Last mile
- 02. Drivers waiting at the gate for loading
- 03. A parcel driven twice because the address was unclear
- 05. Returns piling up until the end of the week
Hotel
- 04. The same guest data typed into two systems
- 02. A guest waiting for a room that is clean but not released
- 08. A fix from the night receptionist that nobody asks about
Three questions t o find it
- Where does the work wait, and for how long?
- What is written, counted or checked twice?
- What does someone search for every day, because it has no fixed place?
Our reading
A waste that everyone sees every day has usually stopped being seen as a waste. It has become “the way we work”.
The examples are illustrations by the editors; the numbers refer to the wastes on page 4.
More in the essay: Pareto and 5 Why in practice, not in PowerPoint
How it is measured
How much of the time creates value?
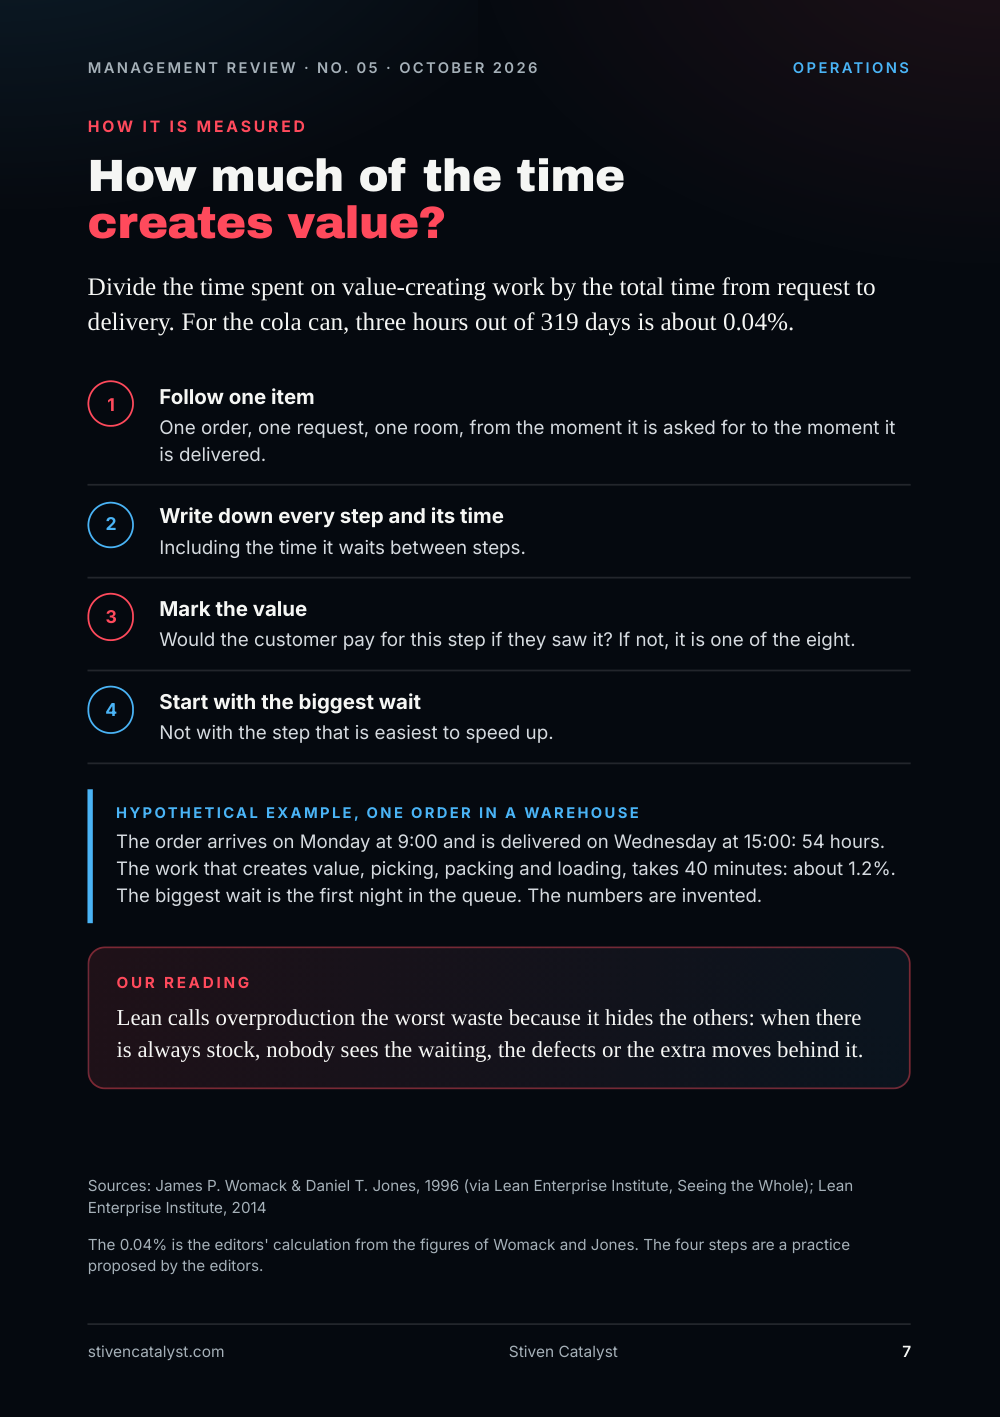
Divide the time spent on value-creating work by the total time from request to delivery. For the cola can, three hours out of 319 days is about 0.04%.
- Follow one item. One order, one request, one room, from the moment it is asked for to the moment it is delivered.
- Write down every step and its time. Including the time it waits between steps.
- Mark the value. Would the customer pay for this step if they saw it? If not, it is one of the eight.
- Sta
r t with the biggest wait. Not with the step that is easiest to speed up.
Hypoth
Our reading
Lean calls overproduction the worst waste because it hides the others: when there is always stock, nobody sees the waiting, the defects or the extra moves behind it.
The 0.04% is the editors' calculation from the figures of Womack and Jones. The four steps are a practice proposed by the editors.
Sources: James P. Womack & Daniel T. Jones, 1996 (via Lean Enterprise Institute, Seeing the Whole); Lean Enterprise Institute, 2014
Tool of the week
The waste walk card
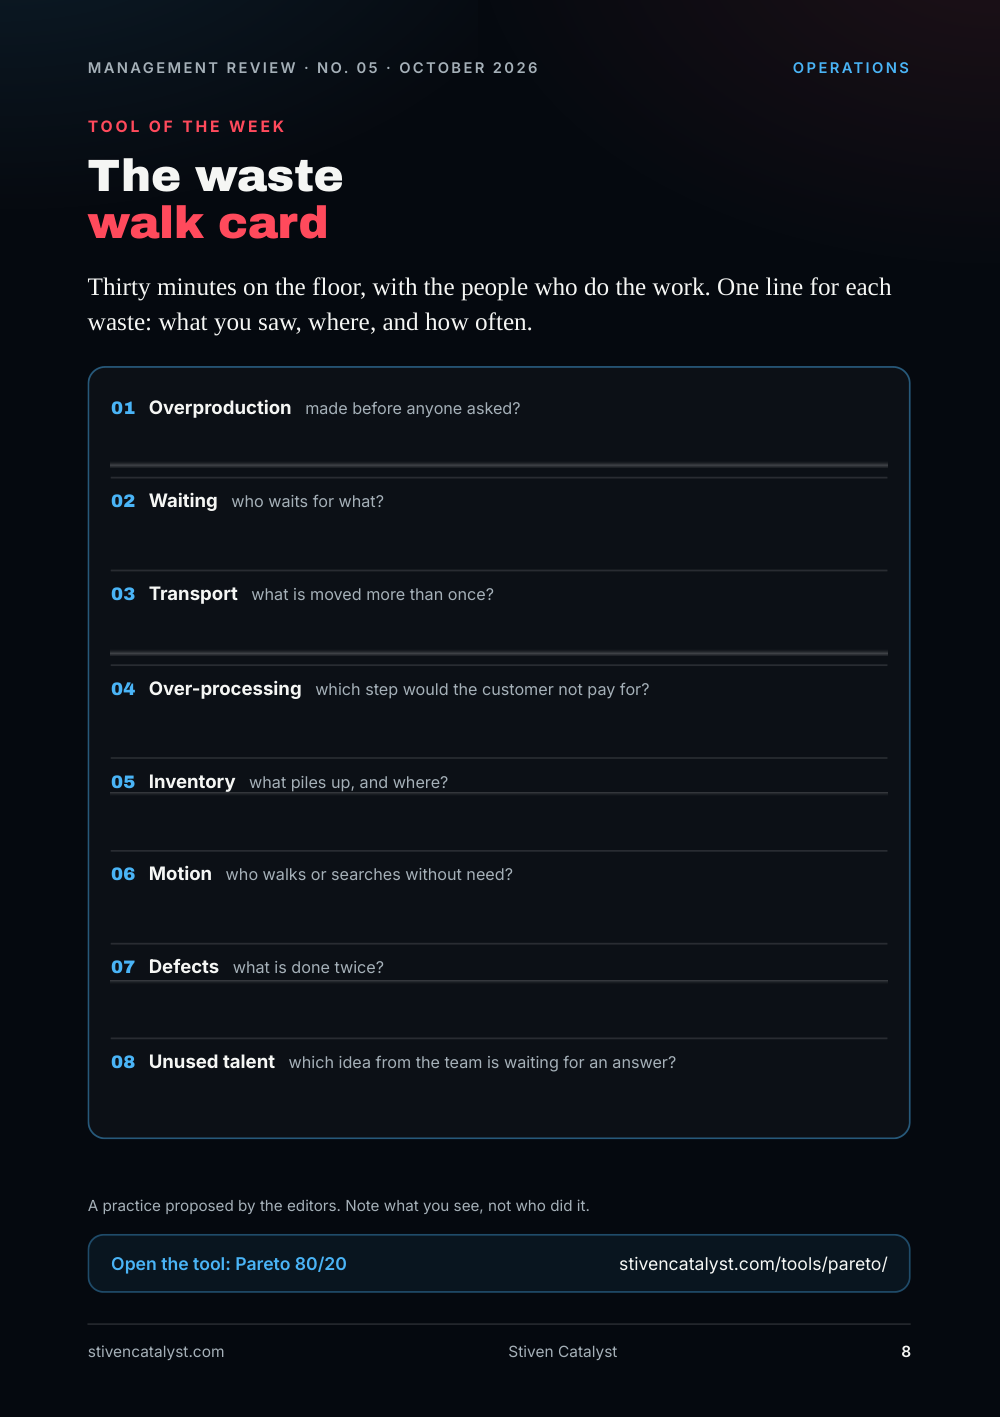
Thirty minutes on the floor, with the people who do the work. One line for each waste: what you saw, where, and how often.
- Overproduction made before anyone asked?
- Waiting who waits for what?
- Transpo
r t what is moved more than once? - Over-processing which step would the customer not pay for?
- Inven
t ory what piles up, and where? - Motion who walks or searches without need?
- Defects what is done twice?
- Unused talent which idea from the team is waiting for an answer?
A practice proposed by the editors. Note what you see, not who did it.
Open the tool: Pareto 80/20
Sources and method
Every figure has a source.
The figures in this issue come from the sources below. The year shows how recent each one is.
- James P. Womack & Daniel T. Jones, “Lean Thinking”, 1996 (via Lean Enterprise Institute, Seeing the Whole). https://www.lean.org/wp-content/uploads/2021/01/seeing-the-whole-introduction.pdf
- Taiichi Ohno, “Toyota Production System: Beyond Large-Scale Production”, 1988.
- Lean Enterprise Institute, “Lean Lexicon: seven wastes”, 2014. https://www.lean.org/lexicon-terms/seven-wastes/
- Lean Enterprise Institute, The Lean Post, “The Eight Wastes of Lean”, 2020. https://www.lean.org/the-lean-post/articles/the-eight-wastes-of-lean/
- Jeffrey K. Liker, “The Toyota Way”, 2004.
- John F. Krafcik, Sloan Management Review, “Triumph of the Lean Production System”, 1988.
- James P. Womack, Daniel T. Jones & Daniel Roos, “The Machine That Changed the World”, 1990.
Edit orial me thod
Each figure was checked for its year, its publisher and what exactly it measures. Where the publisher's page could not be opened, the figure was checked against independent summaries and is marked “via”. The editors' interpretation is marked “Our reading”. Figures that could not be confirmed are not in the issue.