This second volume follows a single question across three worlds: what happens between the moment work becomes ready and the moment another person can use it? It starts with an imagined night-shift handover, moves through the loading ramp and a wholesale order, tests the allure of executive visits against research, and finishes with a practical closure system. Where a scene is constructed, it says so; the verified background is narrower: last-mile loading, cross-shift hotel handovers and a network of wholesale partners. No individual, guest, employer or confidential system is identified.
In-depth narrative analysis and theoretical-practical operational treatise · Volume 2 · October 2026
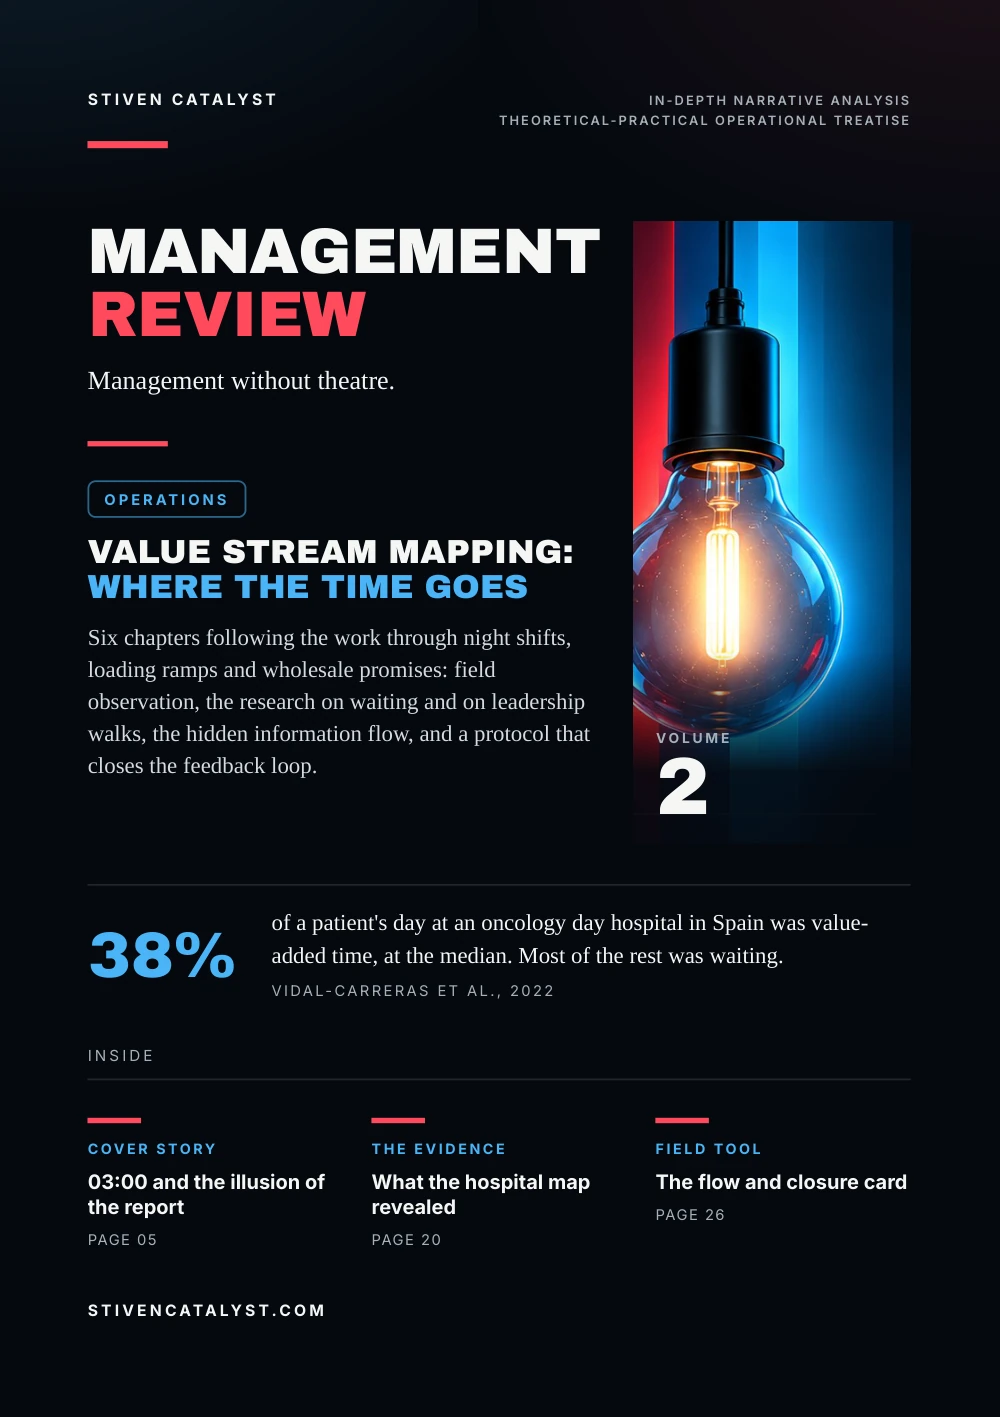
Value stream mapping: where the time goes
Six chapters following the work through night shifts, loading ramps and wholesale promises: field observation, the research on waiting and on leadership walks, the hidden information flow, and a protocol that closes the feedback loop.
- Volume
- 2
- Chapters
- 6
- Pages
- 30
- Sources
- 12
How every chapter is built
- 1The living scene
A shift, a ramp, a desk at 03:00: one piece of work followed as it actually happens, with the hand-off where it breaks. Scenes are constructed from real categories of work and say so.
- 2The conce
p tual and scientific breakdownThe mechanism behind the scene, named with the model that explains it, and the research that tests it: the study, its population, its year and its limits, before it is applied anywhere else.
- 3The operating pro
t ocol for actionWhat a working team can try on Monday: fields, questions, a cadence and a count, each with an owner, a next step and a return of information to the people who do the work.
Stiven CatalystIn-depth narrative analysis
Theoretical-practical operational treatise
Theoretical-practical operational treatise
ManagementReview
Management without theatre.
Operations
Value stream mapping:where the time goes
Six chapters following the work through night shifts, loading ramps and wholesale promises: field observation, the research on waiting and on leadership walks, the hidden information flow, and a protocol that closes the feedback loop.

Volume2
38%
of a patient's day at an oncology day hospital in Spain was value-added time, at the median. Most of the rest was waiting.Vidal-Carreras et al., 2022
stivencatalyst.com
Editorial · Volume 2
Where thework waits
A process may take minutes to perform and still take hours to deliver. The mystery is rarely inside the minutes. It lives in the queue, the hand-off and the information that failed to travel with the work.
How every chapter is built
- 1
The living scene
A shift, a ramp, a desk at 03:00: one piece of work followed as it actually happens, with the hand-off where it breaks. Scenes are constructed from real categories of work and say so.
- 2
The conceptual and scientific breakdown
The mechanism behind the scene, named with the model that explains it, and the research that tests it: the study, its population, its year and its limits, before it is applied anywhere else.
- 3
The operating protocol for action
What a working team can try on Monday: fields, questions, a cadence and a count, each with an owner, a next step and a return of information to the people who do the work.
The reading contract
Field
Only documented work categories, without invented personal incidents.
Evidence
The study, population, year and limits named before applying it.
Action
A clear owner, next step and return of information at the end.
Contents
The chap ters,in three layers
Chapter I03:00 and the illusion of the report05
1 Scene03:00 and the illusion052 BreakdownA status is not a resolution063 ProtocolProtocol: close the loop07Chapter IIOhno's circle at the loading ramp08
1 SceneThe circle at the ramp082 BreakdownOhno and the discipline of seeing093 ProtocolFour questions at the loading point10Chapter IIIThe promise and the warehouse11
1 SceneThe promise and the warehouse112 BreakdownHorizontal value, vertical departments123 ProtocolProtocol: handover a promise13Chapter IVThe paradox of presence14
1 SceneThe visit that changes nothing142 BreakdownThe uncomfortable experiment15Who hears what changed?163 ProtocolOwnership before applause17Chapter VProcess time versus queue time18
1 SceneThe minute and the queue182 BreakdownThree numbers, one ratio19What the hospital map revealed20Maps without a future213 ProtocolFrom current state to future state22Chapter VIThe 30-day response loop23
1 SceneThe 30-day response loop232 BreakdownFive actions, one obligation243 ProtocolThirty days without a ritual25
Also in this volume
- 04Research noteWhat evidence is allowed to say
- 26Field toolThe one-page flow and closure card
- 27Closing essayWhat stays when the manager leaves
- 28MethodHow this volume was built
- 29SourcesSources and method
Research note
What evidenceis allowed t o say
The numerical cases in this volume come mostly from healthcare. That is a strength when used carefully: hospitals make waiting, coordination and handovers unusually visible. It is also a limit. One hospital is not a warehouse.
One verified 2022 study reported a 38.12% median share of value-added time in the measured patient journey of one oncology day hospital. Two higher ratios were modelled as alternative future states: projections, not observed improvements. We use the example to examine the logic of queues, not to assert that warehouses show the same proportion. A randomised hospital programme studied by Tucker and Singer found that management walkarounds were not beneficial on average in the study's measured outcome, while ownership and active resolution went with better local results. A cross-sectional survey by Sexton and colleagues connected feedback with better safety-culture ratings and less reported burnout. Association is not proof of causation.
01
Observed
Published sample, definition, year, design, reported estimate.
02
Transferred
A management hypothesis that could be tested in another sector.
03
Unproven
A claim of impact in the editor's own workplaces without measurements.
Sources: Pilar I. Vidal-Carreras, Julio J. Garcia-Sabater & Juan A. Marin-Garcia, International Journal of Environmental Research and Public Health 19(7), 2022; Anita L. Tucker & Sara J. Singer, Production and Operations Management, 2015 (via Harvard Business School, Working Paper 12-113, 2013); J. Bryan Sexton et al., BMJ Quality & Safety, 2014
Full references on the sources page; the three studies are read in their published versions.
- 1Scene
- 2Breakdown
- 3Protocol
Chapter I · 03:00 and the illusion of the report
03:00 andthe illusion
The night desk is quiet in the story that follows. That quiet is a narrative device, not evidence that any particular hotel had a failed handover.
Hypothetical scene, not a reported hotel incident
It is 03:00. A night auditor reads a brief note left by the earlier shift: a guest has reported a defect in the room. The case is marked for follow-up. The previous colleague has finished. The specialist team will not see the guest until later. Everyone has done something, and yet no one can say whether the guest will receive an answer. There is an entry in the log. There may be a message somewhere else. The guest has a memory of a promise. None of these alone is a completed remedy. The weak point is the interval between a problem being recorded and the next person having the information, authority and time to act.
The story resembles ordinary categories of hotel work that can be discussed publicly: technical room issues, cleaning concerns, matters carried into the morning handover. The hour, the note, the dialogue and the outcome are fictional.
Our reading
A finished shift is not the same thing as finished work.
The work categories reflect the author's documented night-audit experience, without identifying properties, guests or confidential procedures.
- 1Scene
- 2Breakdown
- 3Protocol
Chapter I · 03:00 and the illusion of the report
A status isnot a resolution
A service process often gives each department its own definition of completion. Reception can finish registering a request; maintenance can complete a repair; housekeeping can complete a task. The guest experiences one result: was the problem dealt with, and did someone keep the promise?
This is the first analytical error to avoid when reading a dashboard. A green status may be true within the system that produced it and incomplete within the entire service. Shift work adds a less visible division: time. The people handing over and receiving a case may never be in the building together, so a note must carry enough context to preserve the decision already made. Womack's purpose, process, people lens moves attention from the vertical unit to the end-to-end outcome.
01
Purpose
What does a good outcome mean to the customer, not merely to one team?
02
Process
What information and decision must travel from one shift to the next?
03
People
Who accepts the open work, and what support can they reach?
01
Weak handover
“Room issue reported.” No state, no owner, no next commitment.
02
Actionable handover
Issue, observed facts, action taken, next owner, next update.
Sources: James P. Womack, Lean Enterprise Institute, 2006; Lean Enterprise Institute, 2014
Womack's framework from his 2006 column and the Lean Enterprise Institute's lexicon; the hotel application is editorial.
- 1Scene
- 2Breakdown
- 3Protocol
Chapter I · 03:00 and the illusion of the report
Prot ocol:close the loop
A five-field handover that survives the morning. Not every issue can be solved at night; the problem begins when an unresolved issue is disguised as complete.
What happened?
Record the observation, not an assumption about the person responsible.
What was verified?
Distinguish the reporter's account from checks actually performed.
What action was taken?
Only the real action, not the hoped-for outcome.
Who owns the remainder?
A responsible role and the channel used for the transfer.
When will the receiver respond?
The next review or update commitment.
A manager can audit the quality of this handover without reading private guest details: sample anonymous records and ask whether the next shift could act without calling the previous shift for basic facts. If not, the handover is incomplete even if every field is filled. The remedy is a smaller, clearer record of what remains open.
Our reading
The handover is complete when the next person can work, not when the first person presses Send.
Source: James P. Womack, Lean Enterprise Institute, 2006
Practice proposed by the editors, after Womack's value-stream lens; not a procedure certified for a named hotel. The site's Shift Handover tool carries the same fields.
More in the essayWhat a Night Auditor learns about a business that most managers never see
- 1Scene
- 2Breakdown
- 3Protocol
Chapter II · Ohno's circle at the loading ramp
The circleat the ramp
A last-mile operation can put the apparent owner of a delay at the very end of a chain that began before the driver arrived.
Hypothetical composite, grounded in real work categories
A driver is expected to leave the loading area. The route is ready on paper. One bag cannot be found. A trolley nearby holds items that must be checked again. Minutes pass. On the dashboard, the departure grows later. At the loading point the visible work is not driving at all; it is searching, checking, clarifying and waiting for a decision.
Missing bags, mixed trolleys and loading discipline were real categories of work in the author's last-mile experience. The particular driver, clock time, sequence and root cause in this scene are invented. The tempting managerial response is immediate: demand that the driver leave faster. But if the load is incomplete, more urgency only moves the problem downstream. The useful question is not “who is late?” but “which condition made the agreed next step impossible?”
Our reading
The point at which the delay appears is not necessarily the point at which it began.
No unpublished figures or person-identifying details from the author's employers are used. The essay named below tells the same shape from the dispatch desk.
More in the essayWhere part of the order goes missing
- 1Scene
- 2Breakdown
- 3Protocol
Chapter II · Ohno's circle at the loading ramp
Ohno and thediscipline of seeing
The story of Taiichi Ohno's circle is memorable because the student must watch before being permitted to explain. It is a teaching account transmitted by people who worked with Ohno, not a controlled experiment. Its discipline still matters.
01
See
Describe an observable sequence rather than an inferred motive.
02
Ask
Ask the worker what the standard requires and where reality differs.
03
Check
Compare an explanation with timing, status and the work itself.
A delivery system carries two objects. The physical object is the order: items, bags, containers, the vehicle. The informational object is the instruction: which order belongs where, what has been checked, what is missing, what the next worker should do. Transport is possible only when both flows make sense to the receiving person. When they separate, the employee at the end becomes an improvised information system: waiting, calling, searching, inventing a workaround. Rother and Shook's Learning to See made drawing both streams together, from a current state to a future state with a plan, a practical method. Drawing only the material boxes loses much of the point.
- 01
Prepare
Right units?
- 02
Hand over
Clear status?
- 03
Load
Complete scan?
- 04
Depart
Ready to go?
Sources: John Teresko, IndustryWeek, 2004; Lean Enterprise Institute, 2014; Mike Rother & John Shook, Lean Enterprise Institute, 1999 (via Lean Enterprise Institute, introduction and Part I excerpts)
Ohno's circle as told by Teruyuki Minoura (IndustryWeek, 2004); gemba and genchi genbutsu from the Lean Enterprise Institute; Rother & Shook via the excerpts the LEI publishes. The diagram is editorial and generic.
- 1Scene
- 2Breakdown
- 3Protocol
Chapter II · Ohno's circle at the loading ramp
Four questionsat the loading point
David Mann frames the gemba visit as a repeatable part of leader standard work rather than an executive tour. His four questions shift attention away from performance theatre and toward conditions a responsible manager can investigate.
Show me the standard process.
How an order becomes ready, not just how fast a vehicle leaves.
How can we tell it is working?
What signal confirms completeness before the scan?
What happens when it is not?
What a worker does when a bag is absent, in their own words.
Who is working on improving it?
Who is authorised to alter the upstream condition that causes rechecking.
An informative gemba walk ends with a traceable question or decision. If no one owns the discovered impediment, the visit has produced a description, not an improvement. Ohno's circle is not permission to stand silently while a safety risk continues: immediate harm requires immediate intervention. For everything else, the rule is to learn enough before deciding.
Our reading
Presence provides access to evidence. Evidence still has to be collected, owned and acted on.
Sources: Mark Graban, Lean Blog Podcast #212, 2014; John Teresko, IndustryWeek, 2004
Mann's questions from a 2014 interview, paraphrased; the loading-point hints are editorial. Anonymised notes about the process are enough: a useful observation needs no employee names.
- 1Scene
- 2Breakdown
- 3Protocol
Chapter III · The promise and the warehouse
The promiseand the warehouse
A sale is often made in a conversation. Fulfilment is made across a chain of commitments that the salesperson may not control.
Hypothetical wholesale example, not a claimed incident
An account manager confirms an urgent order to an independent reseller. The customer assumes delivery can follow immediately. Only later does the team learn that the required stock needs verification and the warehouse is already processing several commitments. No one has lied. The problem is a promise made before the capacity behind it was visible.
The author previously managed a wholesale network of 61 active resellers in Albania and worked across sales, warehousing and financial coordination. These are real elements of that background; this particular rushed promise, conversation and delay are not documented personal events. A wholesale partner is not an employee: the supplier cannot issue an instruction and assume the partner will reorganise its business around it. Reliability has to be earned at the interface: what was promised, what was confirmed, what changed and who will communicate the new reality.
Our reading
The sale may be recorded today. Trust is tested when the promise meets capacity.
The network size is background supplied by the author, not a research sample; no order-level dataset from that role is available for this publication. The essay named below tells that story.
More in the essay61 resellers: what wholesale taught me about trust
- 1Scene
- 2Breakdown
- 3Protocol
Chapter III · The promise and the warehouse
Horizontal value,ver tical depar tments
A company is often managed vertically: sales objectives, preparation and accuracy objectives, departure and service targets. Each dashboard may be fair inside its own remit. The customer receives one horizontal experience, and it can fail between the dashboards.
01
Local success
Order accepted, list completed, vehicle assigned.
02
Customer success
Correct product delivered, in the promised condition, with reliable updates.
Womack's three questions apply to the whole chain: fulfil the order in the condition and time the partner can rely on; confirm availability, prepare, hand over, transport and update; agree on roles, escalation and exceptions across all units. Someone must have authority to ask whether the total promise remains credible when each department takes a locally reasonable action; Rother and Shook call that person the value-stream manager. Design does not erase individual responsibility: a knowingly false promise or a skipped safety step still requires fair investigation. The point is to distinguish a defect in the system from a decision made against a clear standard.
Our reading
When customer success depends on several local successes, the join between them deserves its own standard and owner.
Sources: James P. Womack, Lean Enterprise Institute, 2006; Lean Enterprise Institute, 2014; Mike Rother & John Shook, Lean Enterprise Institute, 1999 (via Lean Enterprise Institute, introduction and Part I excerpts)
Womack's lens and the Lean Enterprise Institute's lexicon; the value-stream manager from Part I of Learning to See; the wholesale application is editorial.
- 1Scene
- 2Breakdown
- 3Protocol
Chapter III · The promise and the warehouse
Prot ocol:handover a promise
Six fields for a cross-functional commitment. The template is deliberately modest: a shared record and disciplined language are often the first measurable experiment.
Customer result
What exactly has been requested and accepted?
Stock or resource check
What availability has been verified, and at what time?
Next owner
Who accepts responsibility for the next step?
Exception condition
What must stop a promise from being treated as confirmed?
Update channel
Who informs the partner if the condition changes?
Closure evidence
What proves the recipient got the promised result?
Sample a small set of orders and ask how often the receiving team needed clarification before it could act. Does the organisation have one shared meaning for “confirmed”? Is stock confirmation distinct from order acceptance? Can a warehouse flag that a promise needs revision without being treated as obstructive? Who tells the reseller when the answer changes?
Our reading
The hospital's 38.12% belongs to patients in one hospital, not to wholesale. What transfers is the question: what happens to work after one department says it is ready?
Sources: Lean Enterprise Institute, 2014; Pilar I. Vidal-Carreras, Julio J. Garcia-Sabater & Juan A. Marin-Garcia, International Journal of Environmental Research and Public Health 19(7), 2022
Editorial checklist after end-to-end flow concepts from the Lean Enterprise Institute; Vidal-Carreras et al. (2022) is used only as an external comparative case.
- 1Scene
- 2Breakdown
- 3Protocol
Chapter IV · The paradox of presence
The visit thatchanges nothing
A leader can visit the workplace, listen carefully and still make the working day worse if every concern ends as another unanswered promise.
Hypothetical scene, not an account of a named leader
A senior manager makes a late visit. Colleagues explain a recurring obstacle that makes their shift harder. The manager writes it down, thanks them and leaves. Days pass. The staff are asked to explain the same obstacle during another visit, but they cannot identify a decision, an owner or a deadline from the first. At the first visit the team may have felt heard. At the second, the invitation to speak begins to look like more work: management presence has increased, the employees' capacity to solve the problem has not.
Our reading
If listening creates expectations, silence after listening is part of the intervention.
A constructed illustration of a general organisational risk, not a documented encounter with the author; its significance rests on the two studies that follow, read in the settings where they were collected.
- 1Scene
- 2Breakdown
- 3Protocol
Chapter IV · The paradox of presence
The uncomfor tableexperiment
Anita Tucker and Sara Singer studied a management-by-walking-around programme in US hospitals chosen at random. For 18 months senior managers met frontline workers, gathered improvement ideas and worked with staff on problems. 56 work areas took part; 138 in control hospitals did not.
Work area averages reported in the working paper (2013)
The average estimated effect on the study's outcome was negative, a finding that resists the easy claim that visible management is necessarily good. Results were better where managers were assigned responsibility for seeing issues through and where teams prioritised easier-to-solve problems that produced more action. The figure above is a descriptive count, not a conversion rate and not evidence that every action fully solved its issue. The experiment does not prove that any 30-day policy is optimal in logistics or hospitality. It supports a narrower, more useful warning: finding problems is not the same as resolving them.
Source: Anita L. Tucker & Sara J. Singer, Production and Operations Management, 2015 (via Harvard Business School, Working Paper 12-113, 2013)
Improvement was rated by nurses on a 1–5 scale, before (2004) and after (2006); the counts per work area come from the 2013 working paper, the published article (2015) reports the same design. Hospital findings are not a measure of warehouse or hotel performance.
- 1Scene
- 2Breakdown
- 3Protocol
Chapter IV · The paradox of presence
Who hearswhat changed?
A different study asked staff in 44 neonatal intensive care units about leadership walkrounds. Of 3,294 surveys administered, 2,073 were returned, a response rate of 62.9%. Almost half the respondents were unsure whether walkrounds occurred at all.
Staff in 44 neonatal intensive care units, 2011
Areas where more staff heard about actions taken after walkrounds also tended to report a more favourable safety culture and less burnout. This was a cross-sectional survey: it cannot establish that feedback caused those ratings. The question is nonetheless worth testing locally. If a worker identifies a recurring obstacle in a loading area, do they later learn whether anyone checked it? If a night-shift colleague documents a cross-team barrier, does the next shift receive a decision? Feedback is not public relations: it closes the information loop that a walk opened.
Our reading
To the team, an improvement they never hear about can look like no improvement at all.
Source: J. Bryan Sexton et al., BMJ Quality & Safety, 2014
Participation and feedback are mean unit-level values; 49.1% is the share of respondents unsure that walkrounds took place. Percentages refer to the surveyed clinical population, not to warehouses or hotels.
- 1Scene
- 2Breakdown
- 3Protocol
Chapter IV · The paradox of presence
Ownershipbefore applause
A gemba walk fails when management treats the conversation as proof of engagement. The useful artefact is a short register: a fact, a priority, an owner, a next action and a date for reporting back. It is valuable only if it changes what happens next.
Before the walk
Choose one process and the outcome being investigated.
During
Capture verifiable conditions, not impressions about people.
Immediately after
Classify immediate hazards separately from routine improvement.
Before the next review
Name one accountable owner and one next milestone.
At the return
Show the team what changed, what failed and what remains open.
Not all problems belong in the same lane. A safety concern may require immediate containment and formal escalation; a cross-department design problem may take weeks and authority beyond the local leader. In every lane, the team should still hear what was decided. A manager must also protect the worker's right to say the standard is unrealistic: a workaround may conceal a breach, or signal that the process no longer matches the real work.
Sources: Anita L. Tucker & Sara J. Singer, Production and Operations Management, 2015 (via Harvard Business School, Working Paper 12-113, 2013); J. Bryan Sexton et al., BMJ Quality & Safety, 2014; Mark Graban, Lean Blog Podcast #212, 2014
Editorial action protocol informed by Tucker & Singer, Sexton et al. and David Mann. Not an intervention tested in the author's workplaces.
- 1Scene
- 2Breakdown
- 3Protocol
Chapter V · Process time versus queue time
The minuteand the queue
When people complain that a process takes too long, the first instinct is to make the task faster. Sometimes the task is already fast. The delay is in the space before it begins.
Hypothetical example, with invented times
18 minof active work: pick, check, load, release
145 minfrom entering the flow to ready for departure
12.4%activity ratio: 18 divided by 145
Imagine a parcel that needs just a few minutes for each physical action. The actions total 18 minutes, yet the parcel takes 145 minutes from entering the chosen flow to being ready for departure. It spends most of that time waiting for a prior step, a clarification or an available resource. Making the loading action two minutes faster would barely change the total journey. That distinction is the purpose of value stream mapping: not a floor plan, not an organisation chart, but a map of how a particular family of work moves, including the information that makes the next action possible and the time consumed while the work is idle.
Our reading
A fast task can live inside a slow system.
The synthetic numbers are included so the calculation can be checked. They are not a measurement of the author's actual loading time, shift, site or company; real measurement needs consistent timestamps and an agreed process boundary.
- 1Scene
- 2Breakdown
- 3Protocol
Chapter V · Process time versus queue time
Three numbers,one ratio
Karen Martin and Mike Osterling map office and service work with three measures: process time, the effort spent actively doing the defined work; lead time, the elapsed time from entry to exit; and percent complete and accurate, whether work reaches the next step usable, without correction, addition or clarification.
PT, process time
Actual active work time. How long we work.
LT, lead time
Elapsed time from entry to exit. How long it waits.
%C&A, complete and accurate
Accepted without repair. How good the hand-off is.
For the hypothetical flow, 18 minutes of process time inside 145 minutes of lead time gives an activity ratio of 12.4%. This does not mean employees were productive for 12.4% of their day; it describes a flow and its time, not the utilisation of staff. That distinction matters whenever managers start turning a process metric into a judgment about people. With several steps, add the active times and divide by the overall lead time, in one consistent scope. And %C&A is not a speed measure: a fast handover that sends incomplete information increases the burden downstream, so the receiving team should define it.
Our reading
Measure the whole elapsed journey, including the work waiting between steps.
Sources: Karen Martin & Mike Osterling, McGraw-Hill Education, 2014 (via Karen Martin, "Value Stream Mapping: Lead Time" (author's blog, 2014)); Karen Martin & Associates, Institute of Industrial Engineers, 2009
Definitions from Karen Martin's 2014 post and her 2009 slides; the book itself was not seen. The calculation is hypothetical.
- 1Scene
- 2Breakdown
- 3Protocol
Chapter V · Process time versus queue time
What the hospitalmap revealed
Pilar Vidal-Carreras, Julio Garcia-Sabater and Juan Marin-Garcia mapped the day of adults receiving chemotherapy at the oncology day hospital of a large public hospital in Spain: a blood test, a visit to the oncologist, then the treatment. The median stay was 446 minutes, with 306 minutes of non-value-added time, 300 of them waiting.
Value-added time as a share of the stay, median
The laboratory could test a sample in under 15 minutes, yet the next appointment was an hour later. A dose took 15 minutes to prepare on average, yet the pharmacy would not promise it in less than three hours: requests from the whole hospital arrived at once, with no priority. The future states are projected designs, not before-and-after outcomes; reporting them as achieved gains would overstate the study. The practical comparison is about coordination, not about pretending a patient journey and a parcel journey are equivalent.
Our reading
The work was quick. The day was long because of the time between departments, which no department owned.
Source: Pilar I. Vidal-Carreras, Julio J. Garcia-Sabater & Juan A. Marin-Garcia, International Journal of Environmental Research and Public Health 19(7), 2022
Tables 1 and 2 of the article, published in IJERPH 19(7), 2022. One hospital; the number of patients observed is not given.
- 1Scene
- 2Breakdown
- 3Protocol
Chapter V · Process time versus queue time
Maps withouta future
Juan Marin-Garcia and colleagues reviewed 80 publications on value stream mapping in healthcare from 2015 to 2019. Twenty spoke of a map but drew none. Of the 60 drawn maps, only 20 showed a future state, and only 19 the flow of information.
80 publications on value stream mapping in healthcare, 2015–2019
No study in the review reported a negative or barely noticeable result; the authors ask whether publication bias plays a part. The review cannot tell us how much mapping helped the author's workplaces. It does show how easily diagnosis becomes the last step rather than the first step toward a change. A material map without its information flow cannot explain many modern delays: a product may be physically present but not released, a reservation may exist without the next shift knowing what remains open, an order may be accepted without a verified capacity promise. The object is there; the authority or information to proceed is not. A map needs both: where the item is, and what the next person knows.
Sources: Juan A. Marin-Garcia, Pilar I. Vidal-Carreras & Julio J. Garcia-Sabater, International Journal of Environmental Research and Public Health 18(3), 2021; Lean Enterprise Institute, 2014
20 of 80 drew no map; of the 60 maps, 38 showed waiting (read from a figure), 20 a future state and 19 the information flow (the text; the figure shows 21 and 18). Material and information flows after the Lean Enterprise Institute's lexicon.
- 1Scene
- 2Breakdown
- 3Protocol
Chapter V · Process time versus queue time
From current statet o future state
A current-state map answers “what is happening now?” The future-state map answers a harder question: “what should we change, and what will tell us that the change works?” Rother and Shook pair the map with an implementation plan because diagnosis alone does not improve flow.
- 01
Map
Select one flow and observe it end to end, including the information path.
- 02
Measure
Capture active time, total lead time, exceptions and %C&A.
- 03
Design
Identify one queue or hand-off whose condition can be changed.
- 04
Test
Assign an owner, run a bounded test and measure the complete outcome.
Start with one item type, one class of request or one shift handover. Record the current state without judging individuals. Then draw a future state that changes a condition rather than demanding more speed. A successful test should make a downstream outcome better, not just the local metric: a faster loading phase paired with more missing items is not an improvement; a neater log that forces the next shift to telephone the previous one is not a better handover. Some waiting protects safety, quality and sequencing; the question is which delay is necessary and which is created by uncertainty, rework or poor coordination.
Our reading
The map is useful only if it changes a decision.
Sources: Mike Rother & John Shook, Lean Enterprise Institute, 1999 (via Lean Enterprise Institute, introduction and Part I excerpts); Karen Martin & Mike Osterling, McGraw-Hill Education, 2014 (via Karen Martin, "Value Stream Mapping: Lead Time" (author's blog, 2014))
Steps after Part I of Learning to See and the measures of Martin & Osterling; the testing questions are editorial proposals.
- 1Scene
- 2Breakdown
- 3Protocol
Chapter VI · The 30-day response loop
The 30-dayresponse loop
A manager who asks staff to show the real work makes an implicit commitment: the information will not disappear into a notebook.
Hypothetical scene, not a recorded follow-up
A frontline colleague points out a recurring delay. The manager records it and leaves. A week later the problem still exists, but the team can see that someone has checked the underlying sequence, assigned an owner and scheduled a decision. A month later the team hears whether the change worked, failed or needs more time. No hero appears. The difference is the clarity of the response.
The thirty days are not a law of improvement and not a promise that every operational failure can be repaired inside one month. In the hospital study by Tucker and Singer, quicker-to-solve issues went with more action and better outcomes in the local analysis; this volume uses 30 days as an illustrative review horizon for non-urgent problems. Immediate safety or compliance risks demand immediate treatment; structural issues may need a longer roadmap.
Our reading
An observation without a return answer is an unfinished management process.
Source: Anita L. Tucker & Sara J. Singer, Production and Operations Management, 2015 (via Harvard Business School, Working Paper 12-113, 2013)
Editorial scene and proposed planning cycle, informed by Tucker & Singer (2015).
- 1Scene
- 2Breakdown
- 3Protocol
Chapter VI · The 30-day response loop
Five actions,one obligation
Observe, verify, assign, act, tell back: a five-stage synthesis of gemba observation, value-stream analysis, problem ownership and the feedback research, the same chain as in Volume 1.
Observe
Select one value stream and record what actually happened. Do not begin with an accusation about who was slow; where there is immediate risk, make the situation safe first.
Verify
Check the sequence, timestamps, standard, exception conditions and the downstream effect. Ask the people who send work and the people who receive it; they often describe two honest versions of the same handover.
Assign
Name the person responsible for the next decision, not just the department in an email. Set a checkpoint. Distinguish the local owner from the person with authority to remove a cross-functional barrier.
Act
Apply a correction or a controlled test. Document what changed and what remains uncertain. Do not describe a planned action as completed, and do not treat a status update as evidence of customer benefit.
Tell back
Return to the frontline with the result: what changed, what did not, and the next milestone if the work remains open. This completes the obligation created when management asked people to expose a problem.
Sources: Lean Enterprise Institute, 2014; Anita L. Tucker & Sara J. Singer, Production and Operations Management, 2015 (via Harvard Business School, Working Paper 12-113, 2013); J. Bryan Sexton et al., BMJ Quality & Safety, 2014
Five-stage editorial synthesis after the Lean Enterprise Institute's gemba walk, Tucker & Singer (2015) and Sexton et al. (2014); no new causal effect is estimated.
- 1Scene
- 2Breakdown
- 3Protocol
Chapter VI · The 30-day response loop
Thir t y dayswithout a ritual
A sample schedule and a small scorecard, not an evidence-based deadline. A safety issue needs immediate escalation; a large redesign needs longer, and then “tell back” means an honest progress update.
- Day 0Observe, record facts and contain immediate risk.
- Day 3Verify the mechanism and choose an accountable owner.
- Day 10Review the first action and any cross-team block.
- Day 30Check the measured outcome and report back to staff.
Found
Verified findings. Discovery volume.
Owned
Owner per verified finding. Clear responsibility.
Acted
Action per owned finding. Follow-through.
Told back
Staff updated per actioned finding. Feedback closure.
The denominators matter: an organisation can report a 100% feedback rate by excluding unresolved cases. Track all verified findings by age and status, and keep a visible list of unresolved risks. Do not publish worker names or guest details as proof of transparency; a public example shows the method, not the case file.
Our reading
A walk is complete when learning returns to the people who supplied it.
Sources: Anita L. Tucker & Sara J. Singer, Production and Operations Management, 2015 (via Harvard Business School, Working Paper 12-113, 2013); J. Bryan Sexton et al., BMJ Quality & Safety, 2014
Editorial planning horizon and measurement design, influenced by Tucker & Singer (2015) and Sexton et al. (2014); metrics proposed, not tested for validity.
Field tool
The one-page flowand closure card
For the warehouse, the office or a night-shift handover: one single flow, one bounded experiment. If you do not yet have a reliable time measurement, write “not measured” rather than inventing minutes.
01Process and customerwhich single flow are we following, and for whose outcome?
02Current conditionwhat did we directly observe? what is still only reported?
03Time and qualityPT, LT, waiting and %C&A where measurement is valid
04The failed hand-offwhere did work, information or authority stop travelling?
05Next action and ownerwho can change the condition, and when will they check it?
06Tell backwho will report to the people doing the work, and by when?
Sources: Mike Rother & John Shook, Lean Enterprise Institute, 1999 (via Lean Enterprise Institute, introduction and Part I excerpts); James P. Womack, Lean Enterprise Institute, 2006; Mark Graban, Lean Blog Podcast #212, 2014; Karen Martin & Mike Osterling, McGraw-Hill Education, 2014 (via Karen Martin, "Value Stream Mapping: Lead Time" (author's blog, 2014))
Original editorial tool, synthesising Rother & Shook, Womack, Mann and Martin & Osterling. If the cause is uncertain, write the next verification step rather than a conclusion; if the issue is sensitive, keep the internal record secure and use only an anonymised summary in public.
Open the tool: Delay Analyzerstivencatalyst.com/tools/delay-analyzer/
Closing essay
What stays whenthe manager leaves
The hotel shift, the last-mile loading point and the wholesale network are not interchangeable. Their customers, risks and authority structures differ. Yet each exposes the same fragility: work can be completed locally while its value is stranded between people, teams or moments in time.
The first instinct is to ask for a better report. Reports are needed; they tell us whether a target was met, a departure was delayed, a request remains open. But a report is a description produced by one information boundary. The second instinct is to send a leader to the floor. Observation is needed too; Ohno, Womack and Mann remind us to look at the actual work and to be wary of easy explanations. The research adds a difficult qualification: visiting without resolving and reporting back can make leadership less credible rather than more useful. The third instinct is to build a protocol. That is necessary, provided the protocol belongs to the work rather than to the performance of management: a form that records a problem and leaves it unowned is not improvement; a map that never leads to a future state is not transformation; a KPI that counts activity without showing its customer effect is not a result.
What remains is a quieter discipline: see the work; trace the whole flow; distinguish cause from blame; assign a decision; test a change; return to the people with the answer. The manager cannot eliminate every constraint. The manager can stop pretending that noticing a constraint is the same as solving it.
Our reading
Follow the work all the way to the customer. Then follow your own promise all the way back to the team.
Editorial conclusion. No project-level improvement is attributed to the author without an independently documented measurement.
Method
How this volumewas built
An evidence-informed editorial synthesis, not a field experiment. This volume keeps the evidence of Management Review No. 56 on value stream mapping and No. 40 on gemba; the scenes and timestamps invented to explain a mechanism are always labelled hypothetical or constructed.
Research: Rother and Shook, Womack and the Lean Enterprise Institute provide the conceptual frameworks; Martin and Osterling the process-time, lead-time and quality measures; Vidal-Carreras and colleagues the oncology patient-flow example; Marin-Garcia and colleagues the review of published maps; Tucker and Singer and Sexton and colleagues two distinct healthcare studies of leadership walkrounds, action and feedback. Boundaries: the 38.12% is not a wholesale or logistics estimate; projected future states are not achieved gains; perceived improvement in a hospital intervention cannot be translated into a measured drop in loading delays; associations in a cross-sectional survey cannot establish a causal change in burnout. Practice: the value stream with 18 minutes of active work and 145 minutes of lead time is wholly invented; the 30-day schedule is an editorial review rhythm, not a procedure said to have been used by the author.
01
Source
Verifiable references, sample populations, published definitions.
02
Interpretation
A reasoned comparison across different kinds of operations.
03
Proposal
Checklists and action cycles awaiting local testing.
Sources: Pilar I. Vidal-Carreras, Julio J. Garcia-Sabater & Juan A. Marin-Garcia, International Journal of Environmental Research and Public Health 19(7), 2022; Juan A. Marin-Garcia, Pilar I. Vidal-Carreras & Julio J. Garcia-Sabater, International Journal of Environmental Research and Public Health 18(3), 2021; Anita L. Tucker & Sara J. Singer, Production and Operations Management, 2015 (via Harvard Business School, Working Paper 12-113, 2013); J. Bryan Sexton et al., BMJ Quality & Safety, 2014
Sources include primary articles where accessible and institutional lean guidance; where a book was not seen, its entry carries “via” on the next page. There are no names of guests, colleagues, employers or private internal technologies in the case descriptions.
Sources and method
Where the claimscome from
The figures in this volume come from the sources below, each with its year. The scenes are constructed; the protocols are proposals; what is research is named as research.
- Learning to SeeMike Rother & John Shook, Lean Enterprise Institute, 1999 · via Lean Enterprise Institute, introduction and Part I excerptshttps://www.lean.org/wp-content/uploads/2021/01/Learning-to-See-part1.pdf
- Lean Lexicon: value-stream mapping; production lead time, processing time, value-creating timeLean Enterprise Institute, 2014https://www.lean.org/lexicon-terms/value-stream-mapping/
- Lean Lexicon: gemba; gemba walkLean Enterprise Institute, 2014https://www.lean.org/lexicon-terms/gemba-walk/
- Purpose, Process, PeopleJames P. Womack, Lean Enterprise Institute, 2006https://www.lean.org/the-lean-post/articles/purpose-process-people/
- Step Inside the CircleJohn Teresko, IndustryWeek, 2004https://www.industryweek.com/leadership/companies-executives/article/21942244/step-inside-the-circle
- Creating a Lean Culture: David Mann on Leader Standard Work and Lean Management SystemsMark Graban, Lean Blog Podcast #212, 2014https://www.leanblog.org/2014/12/podcast-212-david-mann-creating-a-lean-culture-3rd-ed/
- Value Stream Mapping: How to Visualize Work and Align Leadership for Organizational TransformationKaren Martin & Mike Osterling, McGraw-Hill Education, 2014 · via Karen Martin, "Value Stream Mapping: Lead Time" (author's blog, 2014)https://www.goodreads.com/author_blog_posts/6062479-value-stream-mapping-lead-time
- Metrics-Based Process Mapping (webinar slides)Karen Martin & Associates, Institute of Industrial Engineers, 2009https://www.iise.org/uploadedfiles/Webcasts/2009%20Webinar%20Metrics-Based%20Process%20Mapping.pdf
- Applying Value Stream Mapping to Improve the Delivery of Patient Care in the Oncology Day HospitalPilar I. Vidal-Carreras, Julio J. Garcia-Sabater & Juan A. Marin-Garcia, International Journal of Environmental Research and Public Health 19(7), 2022https://doi.org/10.3390/ijerph19074265
- The Role of Value Stream Mapping in Healthcare Services: A Scoping ReviewJuan A. Marin-Garcia, Pilar I. Vidal-Carreras & Julio J. Garcia-Sabater, International Journal of Environmental Research and Public Health 18(3), 2021https://doi.org/10.3390/ijerph18030951
- The Effectiveness of Management-By-Walking-Around: A Randomized Field StudyAnita L. Tucker & Sara J. Singer, Production and Operations Management, 2015 · via Harvard Business School, Working Paper 12-113, 2013https://doi.org/10.1111/poms.12226
- Exposure to Leadership WalkRounds in neonatal intensive care units is associated with a better patient safety culture and less caregiver burnoutJ. Bryan Sexton et al., BMJ Quality & Safety, 2014https://pmc.ncbi.nlm.nih.gov/articles/PMC4167964/
ManagementReview
Management without theatre.
Every volume, one question about operations, followed from the floor to the protocol and tested against research.
All volumes
stivencatalyst.com/magazine/operational-treatise.html
Operational Treatise · Volume 2 · October 2026 · Stiven Catalyst
Click or swipe a page to turn it. The arrow keys work too.
Operational Treatise · Volume 2
The figures of the volume
The charts of the printed pages, with their sources. Invented examples are marked as such.
Source: Anita L. Tucker & Sara J. Singer, Production and Operations Management, 2015 (via Harvard Business School, Working Paper 12-113, 2013)
Source: J. Bryan Sexton et al., BMJ Quality & Safety, 2014
Source: Pilar I. Vidal-Carreras, Julio J. Garcia-Sabater & Juan A. Marin-Garcia, International Journal of Environmental Research and Public Health 19(7), 2022
Source: Juan A. Marin-Garcia, Pilar I. Vidal-Carreras & Julio J. Garcia-Sabater, International Journal of Environmental Research and Public Health 18(3), 2021
The whole text Read the volume as text For reading on a small screen, searching or a screen reader. The same words, without the page design.
Editorial
Where the work waits
A process may take minutes to perform and still take hours to deliver. The mystery is rarely inside the minutes. It lives in the queue, the hand-off and the information that failed to travel with the work.
This second volume follows a single question across three worlds: what happens between the moment work becomes ready and the moment another person can use it? It starts with an imagined night-shift handover, moves through the loading ramp and a wholesale order, tests the allure of executive visits against research, and finishes with a practical closure system. Where a scene is constructed, it says so; the verified background is narrower: last-mile loading, cross-shift hotel handovers and a network of wholesale partners. No individual, guest, employer or confidential system is identified.
Stiven Janaqi, Editor
How every chap ter is built
- The living scene. A shift, a ramp, a desk at 03:00: one piece of work followed as it actually happens, with the hand-off where it breaks. Scenes are constructed from real categories of work and say so.
- The conce
p tual and scientific breakdown. The mechanism behind the scene, named with the model that explains it, and the research that tests it: the study, its population, its year and its limits, before it is applied anywhere else. - The operating pro
t ocol for action. What a working team can try on Monday: fields, questions, a cadence and a count, each with an owner, a next step and a return of information to the people who do the work.
The reading contract
- Field. Only documented work categories, without invented personal incidents.
- Evidence. The study, population, year and limits named before applying it.
- Action. A clear owner, next step and return of information at the end.
Research note
What evidence is allowed t o say
The numerical cases in this volume come mostly from healthcare. That is a strength when used carefully: hospitals make waiting, coordination and handovers unusually visible. It is also a limit. One hospital is not a warehouse.
One verified 2022 study reported a 38.12% median share of value-added time in the measured patient journey of one oncology day hospital. Two higher ratios were modelled as alternative future states: projections, not observed improvements. We use the example to examine the logic of queues, not to assert that warehouses show the same proportion. A randomised hospital programme studied by Tucker and Singer found that management walkarounds were not beneficial on average in the study's measured outcome, while ownership and active resolution went with better local results. A cross-sectional survey by Sexton and colleagues connected feedback with better safety-culture ratings and less reported burnout. Association is not proof of causation.
- Observed. Published sample, definition, year, design, reported estimate.
- Transferred. A management hypothesis that could be tested in another sector.
- Unproven. A claim of impact in the editor's own workplaces without measurements.
Full references on the sources page; the three studies are read in their published versions.
Sources: Pilar I. Vidal-Carreras, Julio J. Garcia-Sabater & Juan A. Marin-Garcia, International Journal of Environmental Research and Public Health 19(7), 2022; Anita L. Tucker & Sara J. Singer, Production and Operations Management, 2015 (via Harvard Business School, Working Paper 12-113, 2013); J. Bryan Sexton et al., BMJ Quality & Safety, 2014
Chap ter I: 03:00 and the illusion of the repor t
Layer 1 · The living scene
03:00 and the illusion
The night desk is quiet in the story that follows. That quiet is a narrative device, not evidence that any particular hotel had a failed handover.
Hypothetical scene, not a reported hotel incident
It is 03:00. A night auditor reads a brief note left by the earlier shift: a guest has reported a defect in the room. The case is marked for follow-up. The previous colleague has finished. The specialist team will not see the guest until later. Everyone has done something, and yet no one can say whether the guest will receive an answer. There is an entry in the log. There may be a message somewhere else. The guest has a memory of a promise. None of these alone is a completed remedy. The weak point is the interval between a problem being recorded and the next person having the information, authority and time to act.
The story resembles ordinary categories of hotel work that can be discussed publicly: technical room issues, cleaning concerns, matters carried into the morning handover. The hour, the note, the dialogue and the outcome are fictional.
Our reading
A finished shift is not the same thing as finished work.
The work categories reflect the author's documented night-audit experience, without identifying properties, guests or confidential procedures.
Layer 2 · The conceptual and scientific breakdown
A status is not a resolution
A service process often gives each department its own definition of completion. Reception can finish registering a request; maintenance can complete a repair; housekeeping can complete a task. The guest experiences one result: was the problem dealt with, and did someone keep the promise?
This is the first analytical error to avoid when reading a dashboard. A green status may be true within the system that produced it and incomplete within the entire service. Shift work adds a less visible division: time. The people handing over and receiving a case may never be in the building together, so a note must carry enough context to preserve the decision already made. Womack's purpose, process, people lens moves attention from the vertical unit to the end-to-end outcome.
- Purpose. What does a good outcome mean to the customer, not merely to one team?
- Process. What information and decision must travel from one shift to the next?
- People. Who accepts the open work, and what support can they reach?
- Weak handover. “Room issue reported.” No state, no owner, no next commitment.
- Actionable handover. Issue, observed facts, action taken, next owner, next update.
Womack's framework from his 2006 column and the Lean Enterprise Institute's lexicon; the hotel application is editorial.
Sources: James P. Womack, Lean Enterprise Institute, 2006; Lean Enterprise Institute, 2014
Layer 3 · The operating protocol for action
Prot ocol: close the loop
A five-field handover that survives the morning. Not every issue can be solved at night; the problem begins when an unresolved issue is disguised as complete.
- What happened?. Record the observation, not an assumption about the person responsible.
- What was verified?. Distinguish the reporter's account from checks actually performed.
- What action was taken?. Only the real action, not the hoped-for outcome.
- Who owns the remainder?. A responsible role and the channel used for the transfer.
- When will the receiver respond?. The next review or update commitment.
A manager can audit the quality of this handover without reading private guest details: sample anonymous records and ask whether the next shift could act without calling the previous shift for basic facts. If not, the handover is incomplete even if every field is filled. The remedy is a smaller, clearer record of what remains open.
Our reading
The handover is complete when the next person can work, not when the first person presses Send.
Practice proposed by the editors, after Womack's value-stream lens; not a procedure certified for a named hotel. The site's Shift Handover tool carries the same fields.
Source: James P. Womack, Lean Enterprise Institute, 2006
More in the essay: What a Night Auditor learns about a business that most managers never see
Chap ter II: Ohno's circle at the loading ramp
Layer 1 · The living scene
The circle at the ramp
A last-mile operation can put the apparent owner of a delay at the very end of a chain that began before the driver arrived.
Hypothetical composite, grounded in real work categories
A driver is expected to leave the loading area. The route is ready on paper. One bag cannot be found. A trolley nearby holds items that must be checked again. Minutes pass. On the dashboard, the departure grows later. At the loading point the visible work is not driving at all; it is searching, checking, clarifying and waiting for a decision.
Missing bags, mixed trolleys and loading discipline were real categories of work in the author's last-mile experience. The particular driver, clock time, sequence and root cause in this scene are invented. The tempting managerial response is immediate: demand that the driver leave faster. But if the load is incomplete, more urgency only moves the problem downstream. The useful question is not “who is late?” but “which condition made the agreed next step impossible?”
Our reading
The point at which the delay appears is not necessarily the point at which it began.
No unpublished figures or person-identifying details from the author's employers are used. The essay named below tells the same shape from the dispatch desk.
More in the essay: Where part of the order goes missing
Layer 2 · The conceptual and scientific breakdown
Ohno and the discipline of seeing
The story of Taiichi Ohno's circle is memorable because the student must watch before being permitted to explain. It is a teaching account transmitted by people who worked with Ohno, not a controlled experiment. Its discipline still matters.
- See. Describe an observable sequence rather than an inferred motive.
- Ask. Ask the worker what the standard requires and where reality differs.
- Check. Compare an explanation with timing, status and the work itself.
A delivery system carries two objects. The physical object is the order: items, bags, containers, the vehicle. The informational object is the instruction: which order belongs where, what has been checked, what is missing, what the next worker should do. Transport is possible only when both flows make sense to the receiving person. When they separate, the employee at the end becomes an improvised information system: waiting, calling, searching, inventing a workaround. Rother and Shook's Learning to See made drawing both streams together, from a current state to a future state with a plan, a practical method. Drawing only the material boxes loses much of the point.
- Prepare. Right units?
- Hand over. Clear status?
- Load. Complete scan?
- Depa
r t. Ready to go?
Ohno's circle as told by Teruyuki Minoura (IndustryWeek, 2004); gemba and genchi genbutsu from the Lean Enterprise Institute; Rother & Shook via the excerpts the LEI publishes. The diagram is editorial and generic.
Sources: John Teresko, IndustryWeek, 2004; Lean Enterprise Institute, 2014; Mike Rother & John Shook, Lean Enterprise Institute, 1999 (via Lean Enterprise Institute, introduction and Part I excerpts)
Layer 3 · The operating protocol for action
Four questions at the loading point
David Mann frames the gemba visit as a repeatable part of leader standard work rather than an executive tour. His four questions shift attention away from performance theatre and toward conditions a responsible manager can investigate.
- Show me the standard process.. How an order becomes ready, not just how fast a vehicle leaves.
- How can we tell it is working?. What signal confirms completeness before the scan?
- What happens when it is not?. What a worker does when a bag is absent, in their own words.
- Who is working on improving it?. Who is authorised to alter the upstream condition that causes rechecking.
An informative gemba walk ends with a traceable question or decision. If no one owns the discovered impediment, the visit has produced a description, not an improvement. Ohno's circle is not permission to stand silently while a safety risk continues: immediate harm requires immediate intervention. For everything else, the rule is to learn enough before deciding.
Our reading
Presence provides access to evidence. Evidence still has to be collected, owned and acted on.
Mann's questions from a 2014 interview, paraphrased; the loading-point hints are editorial. Anonymised notes about the process are enough: a useful observation needs no employee names.
Sources: Mark Graban, Lean Blog Podcast #212, 2014; John Teresko, IndustryWeek, 2004
Chap ter III: The promise and the warehouse
Layer 1 · The living scene
The promise and the warehouse
A sale is often made in a conversation. Fulfilment is made across a chain of commitments that the salesperson may not control.
Hypothetical wholesale example, not a claimed incident
An account manager confirms an urgent order to an independent reseller. The customer assumes delivery can follow immediately. Only later does the team learn that the required stock needs verification and the warehouse is already processing several commitments. No one has lied. The problem is a promise made before the capacity behind it was visible.
The author previously managed a wholesale network of 61 active resellers in Albania and worked across sales, warehousing and financial coordination. These are real elements of that background; this particular rushed promise, conversation and delay are not documented personal events. A wholesale partner is not an employee: the supplier cannot issue an instruction and assume the partner will reorganise its business around it. Reliability has to be earned at the interface: what was promised, what was confirmed, what changed and who will communicate the new reality.
Our reading
The sale may be recorded today. Trust is tested when the promise meets capacity.
The network size is background supplied by the author, not a research sample; no order-level dataset from that role is available for this publication. The essay named below tells that story.
More in the essay: 61 resellers: what wholesale taught me about trust
Layer 2 · The conceptual and scientific breakdown
Horizontal value, ver tical depar tments
A company is often managed vertically: sales objectives, preparation and accuracy objectives, departure and service targets. Each dashboard may be fair inside its own remit. The customer receives one horizontal experience, and it can fail between the dashboards.
- Local success. Order accepted, list completed, vehicle assigned.
- Cus
t omer success. Correct product delivered, in the promised condition, with reliable updates.
Womack's three questions apply to the whole chain: fulfil the order in the condition and time the partner can rely on; confirm availability, prepare, hand over, transport and update; agree on roles, escalation and exceptions across all units. Someone must have authority to ask whether the total promise remains credible when each department takes a locally reasonable action; Rother and Shook call that person the value-stream manager. Design does not erase individual responsibility: a knowingly false promise or a skipped safety step still requires fair investigation. The point is to distinguish a defect in the system from a decision made against a clear standard.
Our reading
When customer success depends on several local successes, the join between them deserves its own standard and owner.
Womack's lens and the Lean Enterprise Institute's lexicon; the value-stream manager from Part I of Learning to See; the wholesale application is editorial.
Sources: James P. Womack, Lean Enterprise Institute, 2006; Lean Enterprise Institute, 2014; Mike Rother & John Shook, Lean Enterprise Institute, 1999 (via Lean Enterprise Institute, introduction and Part I excerpts)
Layer 3 · The operating protocol for action
Prot ocol: handover a promise
Six fields for a cross-functional commitment. The template is deliberately modest: a shared record and disciplined language are often the first measurable experiment.
- Cus
t omer result. What exactly has been requested and accepted? - S
t ock or resource check. What availability has been verified, and at what time? - Next owner. Who accepts responsibility for the next step?
- Exce
p tion condition. What must stop a promise from being treated as confirmed? - Update channel. Who informs the partner if the condition changes?
- Closure evidence. What proves the recipient got the promised result?
Sample a small set of orders and ask how often the receiving team needed clarification before it could act. Does the organisation have one shared meaning for “confirmed”? Is stock confirmation distinct from order acceptance? Can a warehouse flag that a promise needs revision without being treated as obstructive? Who tells the reseller when the answer changes?
Our reading
The hospital's 38.12% belongs to patients in one hospital, not to wholesale. What transfers is the question: what happens to work after one department says it is ready?
Editorial checklist after end-to-end flow concepts from the Lean Enterprise Institute; Vidal-Carreras et al. (2022) is used only as an external comparative case.
Sources: Lean Enterprise Institute, 2014; Pilar I. Vidal-Carreras, Julio J. Garcia-Sabater & Juan A. Marin-Garcia, International Journal of Environmental Research and Public Health 19(7), 2022
Chap ter IV: The paradox of presence
Layer 1 · The living scene
The visit that changes nothing
A leader can visit the workplace, listen carefully and still make the working day worse if every concern ends as another unanswered promise.
Hypothetical scene, not an account of a named leader
A senior manager makes a late visit. Colleagues explain a recurring obstacle that makes their shift harder. The manager writes it down, thanks them and leaves. Days pass. The staff are asked to explain the same obstacle during another visit, but they cannot identify a decision, an owner or a deadline from the first. At the first visit the team may have felt heard. At the second, the invitation to speak begins to look like more work: management presence has increased, the employees' capacity to solve the problem has not.
Our reading
If listening creates expectations, silence after listening is part of the intervention.
A constructed illustration of a general organisational risk, not a documented encounter with the author; its significance rests on the two studies that follow, read in the settings where they were collected.
Layer 2 · The conceptual and scientific breakdown
The uncomfor table experiment
Anita Tucker and Sara Singer studied a management-by-walking-around programme in US hospitals chosen at random. For 18 months senior managers met frontline workers, gathered improvement ideas and worked with staff on problems. 56 work areas took part; 138 in control hospitals did not.
Work area averages reported in the working paper (2013): Identified 19, Action taken 11.
The average estimated effect on the study's outcome was negative, a finding that resists the easy claim that visible management is necessarily good. Results were better where managers were assigned responsibility for seeing issues through and where teams prioritised easier-to-solve problems that produced more action. The figure above is a descriptive count, not a conversion rate and not evidence that every action fully solved its issue. The experiment does not prove that any 30-day policy is optimal in logistics or hospitality. It supports a narrower, more useful warning: finding problems is not the same as resolving them.
Improvement was rated by nurses on a 1–5 scale, before (2004) and after (2006); the counts per work area come from the 2013 working paper, the published article (2015) reports the same design. Hospital findings are not a measure of warehouse or hotel performance.
Source: Anita L. Tucker & Sara J. Singer, Production and Operations Management, 2015 (via Harvard Business School, Working Paper 12-113, 2013)
Layer 2 · The conceptual and scientific breakdown
Who hears what changed?
A different study asked staff in 44 neonatal intensive care units about leadership walkrounds. Of 3,294 surveys administered, 2,073 were returned, a response rate of 62.9%. Almost half the respondents were unsure whether walkrounds occurred at all.
Staff in 44 neonatal intensive care units, 2011: Not sure walkrounds occurred 49.1%, Participated in walkrounds 20.9%, Heard back about actions 18.4%.
Areas where more staff heard about actions taken after walkrounds also tended to report a more favourable safety culture and less burnout. This was a cross-sectional survey: it cannot establish that feedback caused those ratings. The question is nonetheless worth testing locally. If a worker identifies a recurring obstacle in a loading area, do they later learn whether anyone checked it? If a night-shift colleague documents a cross-team barrier, does the next shift receive a decision? Feedback is not public relations: it closes the information loop that a walk opened.
Our reading
To the team, an improvement they never hear about can look like no improvement at all.
Participation and feedback are mean unit-level values; 49.1% is the share of respondents unsure that walkrounds took place. Percentages refer to the surveyed clinical population, not to warehouses or hotels.
Source: J. Bryan Sexton et al., BMJ Quality & Safety, 2014
Layer 3 · The operating protocol for action
Ownership before applause
A gemba walk fails when management treats the conversation as proof of engagement. The useful artefact is a short register: a fact, a priority, an owner, a next action and a date for reporting back. It is valuable only if it changes what happens next.
- Before the walk. Choose one process and the outcome being investigated.
- During. Capture verifiable conditions, not impressions about people.
- Immediately a
f ter. Classify immediate hazards separately from routine improvement. - Before the next review. Name one accountable owner and one next milestone.
- At the r
e turn. Show the team what changed, what failed and what remains open.
Not all problems belong in the same lane. A safety concern may require immediate containment and formal escalation; a cross-department design problem may take weeks and authority beyond the local leader. In every lane, the team should still hear what was decided. A manager must also protect the worker's right to say the standard is unrealistic: a workaround may conceal a breach, or signal that the process no longer matches the real work.
Editorial action protocol informed by Tucker & Singer, Sexton et al. and David Mann. Not an intervention tested in the author's workplaces.
Sources: Anita L. Tucker & Sara J. Singer, Production and Operations Management, 2015 (via Harvard Business School, Working Paper 12-113, 2013); J. Bryan Sexton et al., BMJ Quality & Safety, 2014; Mark Graban, Lean Blog Podcast #212, 2014
Chap ter V: Process time versus queue time
Layer 1 · The living scene
The minute and the queue
When people complain that a process takes too long, the first instinct is to make the task faster. Sometimes the task is already fast. The delay is in the space before it begins.
Hypothetical example, with invented times
- 18 min of active work: pick, check, load, release
- 145 min from entering the flow to ready for departure
- 12.4% activity ratio: 18 divided by 145
Imagine a parcel that needs just a few minutes for each physical action. The actions total 18 minutes, yet the parcel takes 145 minutes from entering the chosen flow to being ready for departure. It spends most of that time waiting for a prior step, a clarification or an available resource. Making the loading action two minutes faster would barely change the total journey. That distinction is the purpose of value stream mapping: not a floor plan, not an organisation chart, but a map of how a particular family of work moves, including the information that makes the next action possible and the time consumed while the work is idle.
Our reading
A fast task can live inside a slow system.
The synthetic numbers are included so the calculation can be checked. They are not a measurement of the author's actual loading time, shift, site or company; real measurement needs consistent timestamps and an agreed process boundary.
Layer 2 · The conceptual and scientific breakdown
Three numbers, one ratio
Karen Martin and Mike Osterling map office and service work with three measures: process time, the effort spent actively doing the defined work; lead time, the elapsed time from entry to exit; and percent complete and accurate, whether work reaches the next step usable, without correction, addition or clarification.
P T, process time. Actual active work time. How long we work.- LT, lead time. Elapsed time from entry to exit. How long it waits.
- %C&A, compl
e te and accurate. Accepted without repair. How good the hand-off is.
For the hypothetical flow, 18 minutes of process time inside 145 minutes of lead time gives an activity ratio of 12.4%. This does not mean employees were productive for 12.4% of their day; it describes a flow and its time, not the utilisation of staff. That distinction matters whenever managers start turning a process metric into a judgment about people. With several steps, add the active times and divide by the overall lead time, in one consistent scope. And %C&A is not a speed measure: a fast handover that sends incomplete information increases the burden downstream, so the receiving team should define it.
Our reading
Measure the whole elapsed journey, including the work waiting between steps.
Definitions from Karen Martin's 2014 post and her 2009 slides; the book itself was not seen. The calculation is hypothetical.
Sources: Karen Martin & Mike Osterling, McGraw-Hill Education, 2014 (via Karen Martin, "Value Stream Mapping: Lead Time" (author's blog, 2014)); Karen Martin & Associates, Institute of Industrial Engineers, 2009
Layer 2 · The conceptual and scientific breakdown
What the hospital map revealed
Pilar Vidal-Carreras, Julio Garcia-Sabater and Juan Marin-Garcia mapped the day of adults receiving chemotherapy at the oncology day hospital of a large public hospital in Spain: a blood test, a visit to the oncologist, then the treatment. The median stay was 446 minutes, with 306 minutes of non-value-added time, 300 of them waiting.
Value-added time as a share of the stay, median: Current state, measured 38.1%, Future state 2, projected 57.4%, Future state 1, projected 75.2%.
The laboratory could test a sample in under 15 minutes, yet the next appointment was an hour later. A dose took 15 minutes to prepare on average, yet the pharmacy would not promise it in less than three hours: requests from the whole hospital arrived at once, with no priority. The future states are projected designs, not before-and-after outcomes; reporting them as achieved gains would overstate the study. The practical comparison is about coordination, not about pretending a patient journey and a parcel journey are equivalent.
Our reading
The work was quick. The day was long because of the time between departments, which no department owned.
Tables 1 and 2 of the article, published in IJERPH 19(7), 2022. One hospital; the number of patients observed is not given.
Source: Pilar I. Vidal-Carreras, Julio J. Garcia-Sabater & Juan A. Marin-Garcia, International Journal of Environmental Research and Public Health 19(7), 2022
Layer 2 · The conceptual and scientific breakdown
Maps without a future
Juan Marin-Garcia and colleagues reviewed 80 publications on value stream mapping in healthcare from 2015 to 2019. Twenty spoke of a map but drew none. Of the 60 drawn maps, only 20 showed a future state, and only 19 the flow of information.
80 publications on value stream mapping in healthcare, 2015–2019: Drew a map 60 of 80, Showed waiting on it 38 of 80, Drew a future state 20 of 80, Drew the information flow 19 of 80.
No study in the review reported a negative or barely noticeable result; the authors ask whether publication bias plays a part. The review cannot tell us how much mapping helped the author's workplaces. It does show how easily diagnosis becomes the last step rather than the first step toward a change. A material map without its information flow cannot explain many modern delays: a product may be physically present but not released, a reservation may exist without the next shift knowing what remains open, an order may be accepted without a verified capacity promise. The object is there; the authority or information to proceed is not. A map needs both: where the item is, and what the next person knows.
20 of 80 drew no map; of the 60 maps, 38 showed waiting (read from a figure), 20 a future state and 19 the information flow (the text; the figure shows 21 and 18). Material and information flows after the Lean Enterprise Institute's lexicon.
Sources: Juan A. Marin-Garcia, Pilar I. Vidal-Carreras & Julio J. Garcia-Sabater, International Journal of Environmental Research and Public Health 18(3), 2021; Lean Enterprise Institute, 2014
Layer 3 · The operating protocol for action
From current state t o future state
A current-state map answers “what is happening now?” The future-state map answers a harder question: “what should we change, and what will tell us that the change works?” Rother and Shook pair the map with an implementation plan because diagnosis alone does not improve flow.
- Map. Select one flow and observe it end to end, including the information path.
- Measure. Capture active time, total lead time, exceptions and %C&A.
- Design. Identify one queue or hand-off whose condition can be changed.
- Test. Assign an owner, run a bounded test and measure the complete outcome.
Start with one item type, one class of request or one shift handover. Record the current state without judging individuals. Then draw a future state that changes a condition rather than demanding more speed. A successful test should make a downstream outcome better, not just the local metric: a faster loading phase paired with more missing items is not an improvement; a neater log that forces the next shift to telephone the previous one is not a better handover. Some waiting protects safety, quality and sequencing; the question is which delay is necessary and which is created by uncertainty, rework or poor coordination.
Our reading
The map is useful only if it changes a decision.
Steps after Part I of Learning to See and the measures of Martin & Osterling; the testing questions are editorial proposals.
Sources: Mike Rother & John Shook, Lean Enterprise Institute, 1999 (via Lean Enterprise Institute, introduction and Part I excerpts); Karen Martin & Mike Osterling, McGraw-Hill Education, 2014 (via Karen Martin, "Value Stream Mapping: Lead Time" (author's blog, 2014))
Chap ter VI: The 30-day response loop
Layer 1 · The living scene
The 30-day response loop
A manager who asks staff to show the real work makes an implicit commitment: the information will not disappear into a notebook.
Hypothetical scene, not a recorded follow-up
A frontline colleague points out a recurring delay. The manager records it and leaves. A week later the problem still exists, but the team can see that someone has checked the underlying sequence, assigned an owner and scheduled a decision. A month later the team hears whether the change worked, failed or needs more time. No hero appears. The difference is the clarity of the response.
The thirty days are not a law of improvement and not a promise that every operational failure can be repaired inside one month. In the hospital study by Tucker and Singer, quicker-to-solve issues went with more action and better outcomes in the local analysis; this volume uses 30 days as an illustrative review horizon for non-urgent problems. Immediate safety or compliance risks demand immediate treatment; structural issues may need a longer roadmap.
Our reading
An observation without a return answer is an unfinished management process.
Editorial scene and proposed planning cycle, informed by Tucker & Singer (2015).
Source: Anita L. Tucker & Sara J. Singer, Production and Operations Management, 2015 (via Harvard Business School, Working Paper 12-113, 2013)
Layer 2 · The conceptual and scientific breakdown
Five actions, one obligation
Observe, verify, assign, act, tell back: a five-stage synthesis of gemba observation, value-stream analysis, problem ownership and the feedback research, the same chain as in Volume 1.
- Observe. Select one value stream and record what actually happened. Do not begin with an accusation about who was slow; where there is immediate risk, make the situation safe first.
- Veri
f y. Check the sequence, timestamps, standard, exception conditions and the downstream effect. Ask the people who send work and the people who receive it; they often describe two honest versions of the same handover. - Assign. Name the person responsible for the next decision, not just the department in an email. Set a checkpoint. Distinguish the local owner from the person with authority to remove a cross-functional barrier.
- Act. Apply a correction or a controlled test. Document what changed and what remains uncertain. Do not describe a planned action as completed, and do not treat a status update as evidence of customer benefit.
- Tell back. Return to the frontline with the result: what changed, what did not, and the next milestone if the work remains open. This completes the obligation created when management asked people to expose a problem.
Five-stage editorial synthesis after the Lean Enterprise Institute's gemba walk, Tucker & Singer (2015) and Sexton et al. (2014); no new causal effect is estimated.
Sources: Lean Enterprise Institute, 2014; Anita L. Tucker & Sara J. Singer, Production and Operations Management, 2015 (via Harvard Business School, Working Paper 12-113, 2013); J. Bryan Sexton et al., BMJ Quality & Safety, 2014
Layer 3 · The operating protocol for action
Thir t y days without a ritual
A sample schedule and a small scorecard, not an evidence-based deadline. A safety issue needs immediate escalation; a large redesign needs longer, and then “tell back” means an honest progress update.
- Day 0 Observe, record facts and contain immediate risk.
- Day 3 Verify the mechanism and choose an accountable owner.
- Day 10 Review the first action and any cross-team block.
- Day 30 Check the measured outcome and report back to staff.
- Found. Verified findings. Discovery volume.
- Owned. Owner per verified finding. Clear responsibility.
- Acted. Action per owned finding. Follow-through.
T old back. Staff updated per actioned finding. Feedback closure.
The denominators matter: an organisation can report a 100% feedback rate by excluding unresolved cases. Track all verified findings by age and status, and keep a visible list of unresolved risks. Do not publish worker names or guest details as proof of transparency; a public example shows the method, not the case file.
Our reading
A walk is complete when learning returns to the people who supplied it.
Editorial planning horizon and measurement design, influenced by Tucker & Singer (2015) and Sexton et al. (2014); metrics proposed, not tested for validity.
Sources: Anita L. Tucker & Sara J. Singer, Production and Operations Management, 2015 (via Harvard Business School, Working Paper 12-113, 2013); J. Bryan Sexton et al., BMJ Quality & Safety, 2014
Field tool
The one-page flow and closure card
For the warehouse, the office or a night-shift handover: one single flow, one bounded experiment. If you do not yet have a reliable time measurement, write “not measured” rather than inventing minutes.
- Process and cus
t omer which single flow are we following, and for whose outcome? - Current condition what did we directly observe? what is still only reported?
- Time and quali
t y PT, LT, waiting and %C&A where measurement is valid - The failed hand-off where did work, information or authority stop travelling?
- Next action and owner who can change the condition, and when will they check it?
- Tell back who will report to the people doing the work, and by when?
Original editorial tool, synthesising Rother & Shook, Womack, Mann and Martin & Osterling. If the cause is uncertain, write the next verification step rather than a conclusion; if the issue is sensitive, keep the internal record secure and use only an anonymised summary in public.
Sources: Mike Rother & John Shook, Lean Enterprise Institute, 1999 (via Lean Enterprise Institute, introduction and Part I excerpts); James P. Womack, Lean Enterprise Institute, 2006; Mark Graban, Lean Blog Podcast #212, 2014; Karen Martin & Mike Osterling, McGraw-Hill Education, 2014 (via Karen Martin, "Value Stream Mapping: Lead Time" (author's blog, 2014))
Open the tool: Delay Analyzer
Closing essay
What stays when the manager leaves
The hotel shift, the last-mile loading point and the wholesale network are not interchangeable. Their customers, risks and authority structures differ. Yet each exposes the same fragility: work can be completed locally while its value is stranded between people, teams or moments in time.
The first instinct is to ask for a better report. Reports are needed; they tell us whether a target was met, a departure was delayed, a request remains open. But a report is a description produced by one information boundary. The second instinct is to send a leader to the floor. Observation is needed too; Ohno, Womack and Mann remind us to look at the actual work and to be wary of easy explanations. The research adds a difficult qualification: visiting without resolving and reporting back can make leadership less credible rather than more useful. The third instinct is to build a protocol. That is necessary, provided the protocol belongs to the work rather than to the performance of management: a form that records a problem and leaves it unowned is not improvement; a map that never leads to a future state is not transformation; a KPI that counts activity without showing its customer effect is not a result.
What remains is a quieter discipline: see the work; trace the whole flow; distinguish cause from blame; assign a decision; test a change; return to the people with the answer. The manager cannot eliminate every constraint. The manager can stop pretending that noticing a constraint is the same as solving it.
Our reading
Follow the work all the way to the customer. Then follow your own promise all the way back to the team.
Editorial conclusion. No project-level improvement is attributed to the author without an independently documented measurement.
Method
How this volume was built
An evidence-informed editorial synthesis, not a field experiment. This volume keeps the evidence of Management Review No. 56 on value stream mapping and No. 40 on gemba; the scenes and timestamps invented to explain a mechanism are always labelled hypothetical or constructed.
Research: Rother and Shook, Womack and the Lean Enterprise Institute provide the conceptual frameworks; Martin and Osterling the process-time, lead-time and quality measures; Vidal-Carreras and colleagues the oncology patient-flow example; Marin-Garcia and colleagues the review of published maps; Tucker and Singer and Sexton and colleagues two distinct healthcare studies of leadership walkrounds, action and feedback. Boundaries: the 38.12% is not a wholesale or logistics estimate; projected future states are not achieved gains; perceived improvement in a hospital intervention cannot be translated into a measured drop in loading delays; associations in a cross-sectional survey cannot establish a causal change in burnout. Practice: the value stream with 18 minutes of active work and 145 minutes of lead time is wholly invented; the 30-day schedule is an editorial review rhythm, not a procedure said to have been used by the author.
- Source. Verifiable references, sample populations, published definitions.
- Interpr
e tation. A reasoned comparison across different kinds of operations. - Proposal. Checklists and action cycles awaiting local testing.
Sources include primary articles where accessible and institutional lean guidance; where a book was not seen, its entry carries “via” on the next page. There are no names of guests, colleagues, employers or private internal technologies in the case descriptions.
Sources: Pilar I. Vidal-Carreras, Julio J. Garcia-Sabater & Juan A. Marin-Garcia, International Journal of Environmental Research and Public Health 19(7), 2022; Juan A. Marin-Garcia, Pilar I. Vidal-Carreras & Julio J. Garcia-Sabater, International Journal of Environmental Research and Public Health 18(3), 2021; Anita L. Tucker & Sara J. Singer, Production and Operations Management, 2015 (via Harvard Business School, Working Paper 12-113, 2013); J. Bryan Sexton et al., BMJ Quality & Safety, 2014
Sources and method
Where the claims come from
The figures in this volume come from the sources below, each with its year. The scenes are constructed; the protocols are proposals; what is research is named as research.
- Mike Rother & John Shook, Lean Enterprise Institute, “Learning to See”, 1999 (via Lean Enterprise Institute, introduction and Part I excerpts). https://www.lean.org/wp-content/uploads/2021/01/Learning-to-See-part1.pdf
- Lean Enterprise Institute, “Lean Lexicon: value-stream mapping; production lead time, processing time, value-creating time”, 2014. https://www.lean.org/lexicon-terms/value-stream-mapping/
- Lean Enterprise Institute, “Lean Lexicon: gemba; gemba walk”, 2014. https://www.lean.org/lexicon-terms/gemba-walk/
- James P. Womack, Lean Enterprise Institute, “Purpose, Process, People”, 2006. https://www.lean.org/the-lean-post/articles/purpose-process-people/
- John Teresko, IndustryWeek, “Step Inside the Circle”, 2004. https://www.industryweek.com/leadership/companies-executives/article/21942244/step-inside-the-circle
- Mark Graban, Lean Blog Podcast #212, “Creating a Lean Culture: David Mann on Leader Standard Work and Lean Management Systems”, 2014. https://www.leanblog.org/2014/12/podcast-212-david-mann-creating-a-lean-culture-3rd-ed/
- Karen Martin & Mike Osterling, McGraw-Hill Education, “Value Stream Mapping: How to Visualize Work and Align Leadership for Organizational Transformation”, 2014 (via Karen Martin, "Value Stream Mapping: Lead Time" (author's blog, 2014)). https://www.goodreads.com/author_blog_posts/6062479-value-stream-mapping-lead-time
- Karen Martin & Associates, Institute of Industrial Engineers, “Metrics-Based Process Mapping (webinar slides)”, 2009. https://www.iise.org/uploadedfiles/Webcasts/2009%20Webinar%20Metrics-Based%20Process%20Mapping.pdf
- Pilar I. Vidal-Carreras, Julio J. Garcia-Sabater & Juan A. Marin-Garcia, International Journal of Environmental Research and Public Health 19(7), “Applying Value Stream Mapping to Improve the Delivery of Patient Care in the Oncology Day Hospital”, 2022. https://doi.org/10.3390/ijerph19074265
- Juan A. Marin-Garcia, Pilar I. Vidal-Carreras & Julio J. Garcia-Sabater, International Journal of Environmental Research and Public Health 18(3), “The Role of Value Stream Mapping in Healthcare Services: A Scoping Review”, 2021. https://doi.org/10.3390/ijerph18030951
- Anita L. Tucker & Sara J. Singer, Production and Operations Management, “The Effectiveness of Management-By-Walking-Around: A Randomized Field Study”, 2015 (via Harvard Business School, Working Paper 12-113, 2013). https://doi.org/10.1111/poms.12226
- J. Bryan Sexton et al., BMJ Quality & Safety, “Exposure to Leadership WalkRounds in neonatal intensive care units is associated with a better patient safety culture and less caregiver burnout”, 2014. https://pmc.ncbi.nlm.nih.gov/articles/PMC4167964/
Edit orial me thod
Each figure was checked for its year, its publisher and what exactly it measures, at the full text where it could be opened. Where the publisher's page could not be opened, the figure was checked against independent summaries and is marked “via”. The editors' interpretation is marked “Our reading”. No figure of the author's own workplaces is claimed.
Operational Treatise · Operational treatise